Journal of Fluid Flow, Heat and Mass Transfer (JFFHMT)
ISSN: 2368-6111

Volume 11 - Year 2024 - Pages 91-105
DOI: 10.11159/jffhmt.2024.010
The Impact of Dispersed Nanoparticles on Long Wavelength Heat Radiation through Opaque and Transparent Passive Cooling Skylight Glass
Gopalakrishna Gangisetty1, Jan-Henrik Smått 2, Ron Zevenhoven1
1Laboratory of Process and Systems Engineering, Åbo Akademi University
Henrikinkatu 2, Turku, Finland, 20500
gopalakrishna.gangisetty@abo.fi; ron.zevenhoven@abo.fi
2Laboratory of Molecular Science and Engineering, Åbo Akademi University
Henrikinkatu 2, Turku, Finland, 20500.
jan-henrik.smatt@abo.fi
Abstract - Selecting materials for passive radiative cooling (PRC) skylights is crucial, but finding affordable options for widespread use is challenging. Åbo Akademi University (ÅAU) introduced a passive skylight enhancing heat transfer through thermal convection and radiation, effective at night but challenging for daytime use. Dispersions of randomly distributed TiO2-SiO2 or ZnS-SiO2 nanoparticles (NPs) were used on conventional window glasses (WG) and on long-wavelength (LW) translucent Cleartran® ZnS glasses (CG®) to control the surface temperature and absorptivity (α)/emissivity (ε) at different heat source temperatures. The tested NPs are known for their optical properties underwent testing via capturing IR imaging with a thermal camera (wavelength: 7.5-14 µm) and pyrgeometer (wavelength: 4.5-42 µm). LW heat flux measurements through the glass samples were taken on conventional WGs and CG®s, each with randomly dispersed NPs on one side, with the thermal camera or pyrgeometer positioned at different distances from the heat source. The data analysis compared heat fluxes from the different distances, forming the basis for determining glass sample LW emissivities via a mathematical model. Additionally, scanning electron microscope (SEM) analysis conducted on WG samples allowed for precise determination of NP quantity (in g/m²) and NP surface coverage (%). The results showed an average of 0.25 mg/m² for TiO2-SiO2 NPs and 0.3 mg/m² for ZnS-SiO2 NPs, with surface coverages approximately ≈ 8% and ≈ 15%, respectively. Although conventional WG glass exhibited a heat flux increase when using NPs of 2 to 4 times, CG® indicated only marginal change by the NPs. The findings indicate that a larger quantity, possibly five times the current amount of NPs, may be required. Further, Vis-NIR spectrophotometry measures reflectance and transmittance in the 0.25-2.5 μm range for all WGs with NPs and without NPs for comparison. Maximum reflectance is 4.20% with TiO2 – SiO2 NPs and 1.50 % with ZnS-SiO2 NPs, while transmittance is 69.6% with TiO2 -SiO2 NPs and 85.5 % with ZnS-SiO2 NPs. Solar Reflective Index (SRI) quantifies solar radiation reflection, with maximum SRI being 70.5 with TiO2 -SiO2 NPs and 68.2 with ZnS-SiO2 NPs.
Keywords: Radiative heat transfer, Atmospheric window (8-14 μm), Skylight, Daytime passive radiative cooling, TiO2-SiO2 NPs and ZnS-SiO2 NPs, Longwave emittance, Reflectance and Transmittance.
© Copyright 2024 Authors - This is an Open Access article published under the Creative Commons Attribution License terms Creative Commons Attribution License terms. Unrestricted use, distribution, and reproduction in any medium are permitted, provided the original work is properly cited.
Date Received: 2024-02-26
Date Revised: 2024-05-29
Date Accepted: 2024-05-28
Date Published: 2024-06-13
1. Introduction
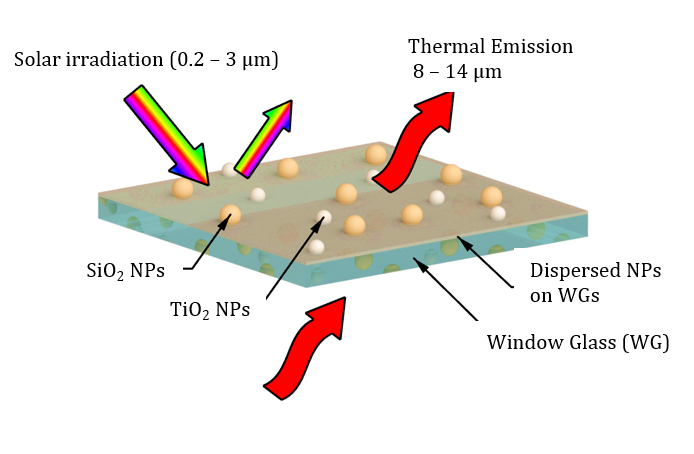
The anticipated rise in temperatures from climate change is increasing the need for building cooling in many regions. During warmer seasons, air conditioning and cooling systems are used more frequently to maintain indoor comfort. The roof contributes significantly, accounting for 70% of overall heat gain. Passive cooling techniques, relying on natural processes rather than energy-intensive mechanical systems, aim to create comfort while reducing energy usage and greenhouse gas emissions. These techniques, including reflective and radiative processes, help dissipate excess heat from a building's interior. Reflective processes redirect solar irradiation in short wavelength (SW) range 0.2-3 μm away from the building, while radiative cooling releases heat into the upper atmosphere and to outer space through the atmospheric window covering wavelengths 8-13 μm [1].
Åbo Akademi University (ÅAU) has innovatively researching on passive radiative cooling (PRC) since 2007, combining heat convection and thermal radiation rather than heat conduction and thermal radiation using a transmissive skylight roof window. This method, integrating reflective processes and radiative cooling, is especially relevant for energy-efficient cooling in buildings like data centers. Initial ÅAU prototypes achieved substantial nocturnal cooling of around 100 W/m2 [2].
Achieving daytime PRC with the current prototype faces challenges due to solar irradiation. A promising solution involves using radiative cooling coatings integrated with nanoparticles (NPs) for its simplicity in manufacturing and design. The chosen ÅAU skylight material, Cleartran ZnS (CG®), offers high longwave (LW) heat radiation transmittance (τ≈0.75),cost-effectiveness, and large availability. The study assessed heat fluxes through conventional window glass (WG) and CG® with dispersed NPs on one side. Note that, fully coating WG with NPs could impact window transparency, affecting both incoming light and outgoing LW radiation.
A thermal camera (Fluke Ti9 ,7.5 – 14 μm) or a Kipp & Zonen CGR3 pyrgeometer (4.5 – 42 μm), specialized for measuring long-wavelength infrared (LWIR) radiation, was positioned at 27 cm or 8 cm from WG or CG® samples to measure heat fluxes. The study compares results with TiO2-SiO2 and ZnS-SiO2 NPs dispersed on glass substrates. These NPs absorb solar light, keeping the window cooler by re-emitting or reflecting it. This process effectively blocks SW solar irradiation while allowing LW radiation to pass through, especially for CG®.
1.1. Preparation of TiO2– SiO2 and ZnS – SiO2 nanoparticle coatings on glass surfaces
TiO2 NPs (~25 nm, 99.5% purity) from Sigma Aldrich, Hombikat Catalyst, SiO2 NPs (20-30 nm, 99+%) from US Research Nanomaterials, Inc., and ZnS pure NPs (~140 nm, 97% purity) from Riedel-de Haën were used. Two types of NP dispersions were prepared: For the TiO2-SiO2 dispersion, 0.4 g of TiO2 NPs and 0.4 g SiO2 NPs were added. For the ZnS-SiO2 dispersion, 0.4 g of ZnS NPs and 0.4 g SiO2 NPs were added. The NPs were dispersed in a mixture comprising 40 g ethanol (99.5%, Altia), 0.8 g terpineol (Sigma-Aldrich), and 0.064 g ethyl cellulose (Sigma-Aldrich) using a 50 W sonic horn (Vibra-Cell 50AT, Sonics & Materials Inc.) for approximately 20 minutes, creating a stable dispersion lasting for days.
Prior to the dip coating process, glass substrates were cleaned with ethanol and oxygen plasma for 5 min. Dip coating was carried out with a KSV dip coater (Biolin Scientific) by pulling the immersed substrate vertically upwards with a constant rate of 85 mm/min, which ensures a uniform coating over the entire substrate. The coated samples were sintered at 500 °C for 30 minutes using a heat ng ramp of 1 °C/min.
Special care should be taken when working with nanocrystalline nanoparticles. When working with dry nanoparticles, it is important to avoid breathing dust and one should work in a fume hood. It is also important to wear protective gloves, eye protection, and respiratory mask.
1. 2. PRC characteristics of TiO2-SiO2 /ZnS-SiO2 NPs
This study explores materials for PRC skylights, controlling SW solar irradiation while allowing LW thermal radiation. TiO2-SiO2 and ZnS-SiO2 composites shows promising for PRC applications, including skylights and cool roofs.
These NP’s properties include:
High refractive index (RI): TiO2 and ZnS possess high refractive indices (≈2.59 and ≈2.42, respectively), making them suitable for optical applications like thin-film coatings and optical filters. When combined with SiO2 (RI ≈1.45), these materials create NPs with a tunable RI, useful for controlling daylight in passive cooling skylights such as the ÅAU skylight. This NPs combination can also produce coatings that can reflect IR radiation.
Transmittance: A TiO2-SiO2 coating is generally known for its lower transmittance in the ultraviolet (UV) and visible light spectrum, which reduces solar heat gain and prevents UV light from entering the interior. ZnS-SiO2 coatings also reduce glare by minimizing the reflection of light at the surface, allowing light to pass through the skylight while reducing the amount of solar irradiation entering into the building.
Reflectance: TiO2 and ZnS NPs can both contribute to greater reflectivity in the SW range, due to their strong UV absorption characteristics, whereas SiO2 NPs are transparent in the visible spectrum; thus, they have less of an impact on reflection. Both composites are unlikely to have a major impact on LW reflection due to their absorption qualities. These NPs, however, have high emissivity in LW region.
The absorption, emission, and reflection properties of NPs are influenced by factors like particle size, concentration, and layer thickness, density of dispersion and surface coverage [5]. When depositing NPs on skylight windows, it's crucial to maintain LW heat transmittance from the building while allowing sufficient visible light during the day.
1.3 ÅA transmissive skylight: Concept for passive cooling
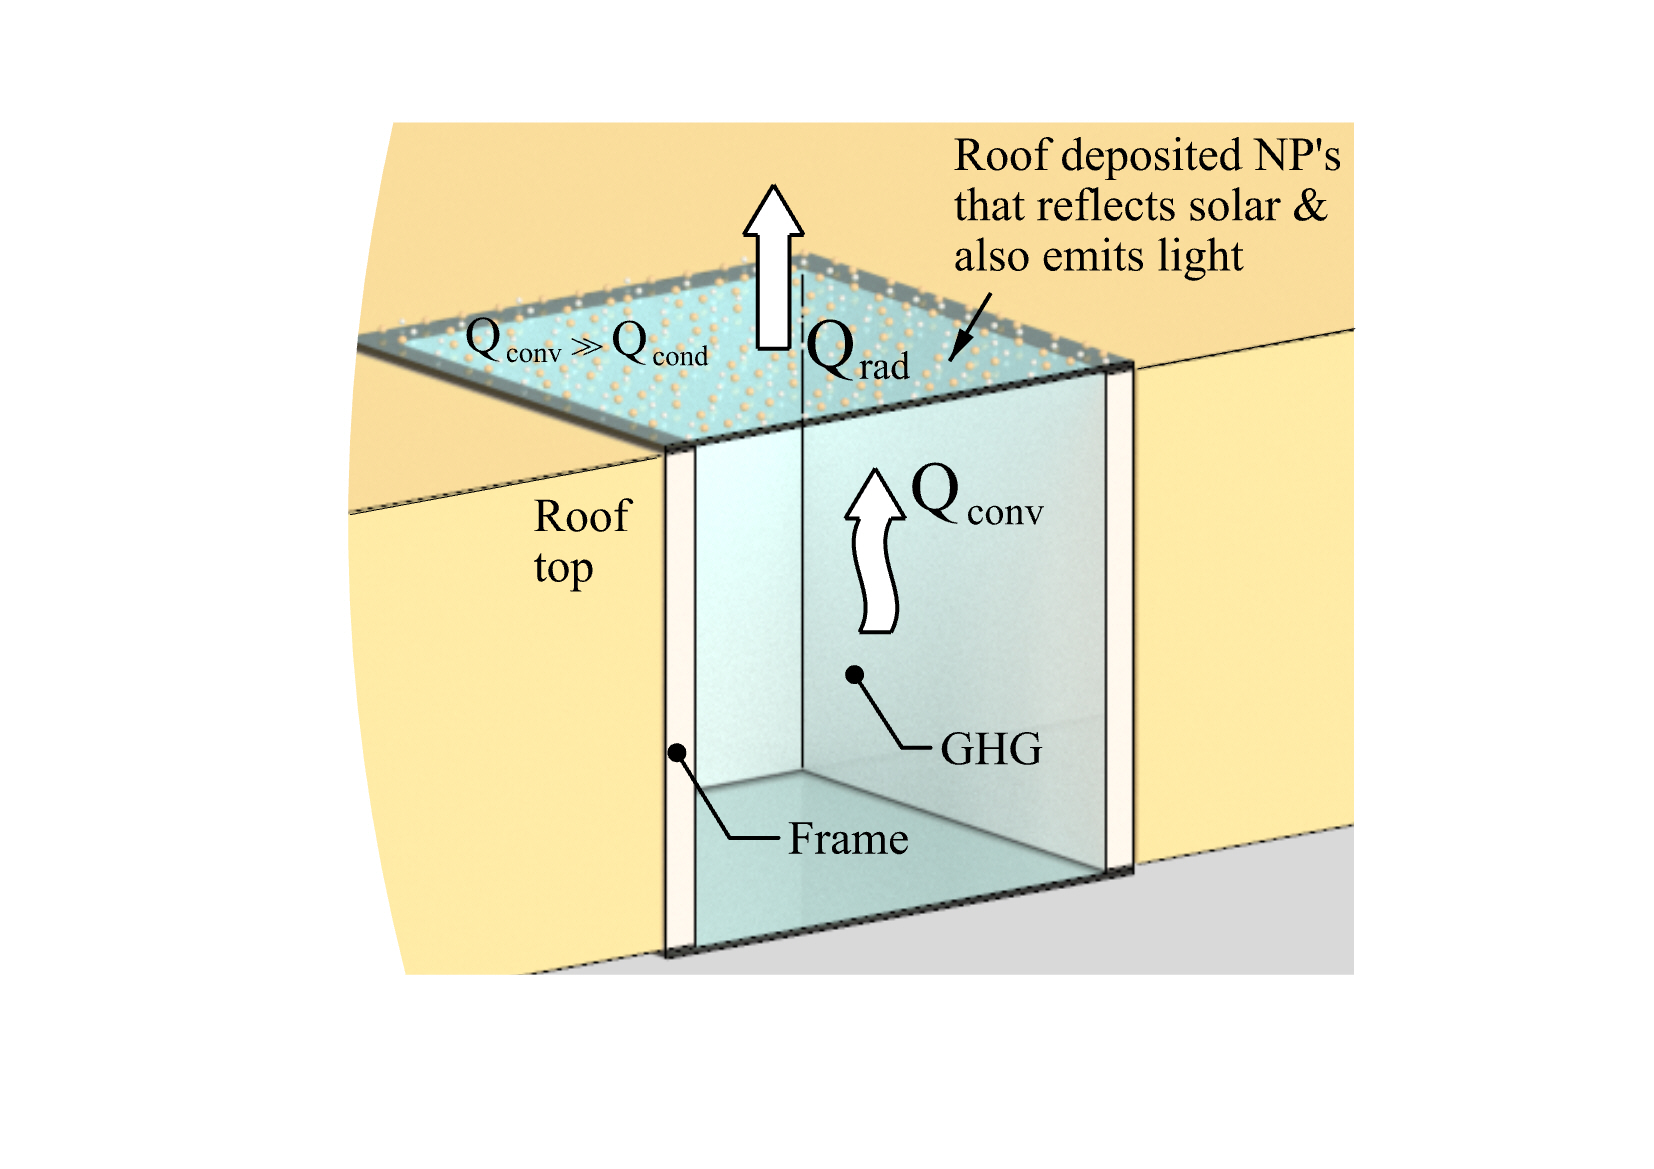
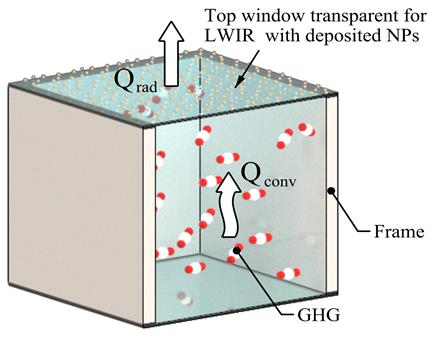
The Figure 2a presents a side view of the transmissive passive cooling skylight, developed, and subjected to proof-of-concept testing at ÅAU [2]. This skylight (see Figure 2b) PRC capability is comparable to that of roof paint or other covering materials exhibiting strong thermal emission in the wavelength range 8-14 μm, i.e., the atmospheric window.
When partially covered with NPs, this skylight: 1) reflects a significant portion of solar irradiation, 2) emits thermal radiation at its own temperature, and 3) allows for the passive cooling radiation to escape from the building space beneath the skylight.
Then the participating greenhouse gases (GHG) within the skylight facilitate the transfer of heat. In contrast to conductive heat transfer(Qcond) through a building roof, skylights give a higher heat transfer rate (per square meter) from the building envelope to the outside surface, regulated by convective circulation (Qconv) within the skylight.
This study proposes using low-cost TiO2-SiO2 and ZnS-SiO2 NPs to enhance the daytime PRC of the ÅAU skylight roof window by reflecting solar irradiation and emitting surface heat. It compares (CG®) and WGs with dispersed NPs for daylight applications.
Thermal performance was assessed on various WGs facing heat sources at different temperatures (303 K, 313 K, and 333 K). Heat flow through windows was measured without NPs, with NPs on the front or backside, while NP size, deposition amount, and coverage fraction were determined for the produced glass substrates.
2. Mathematical model for the calculation of LW radiative heat flux.
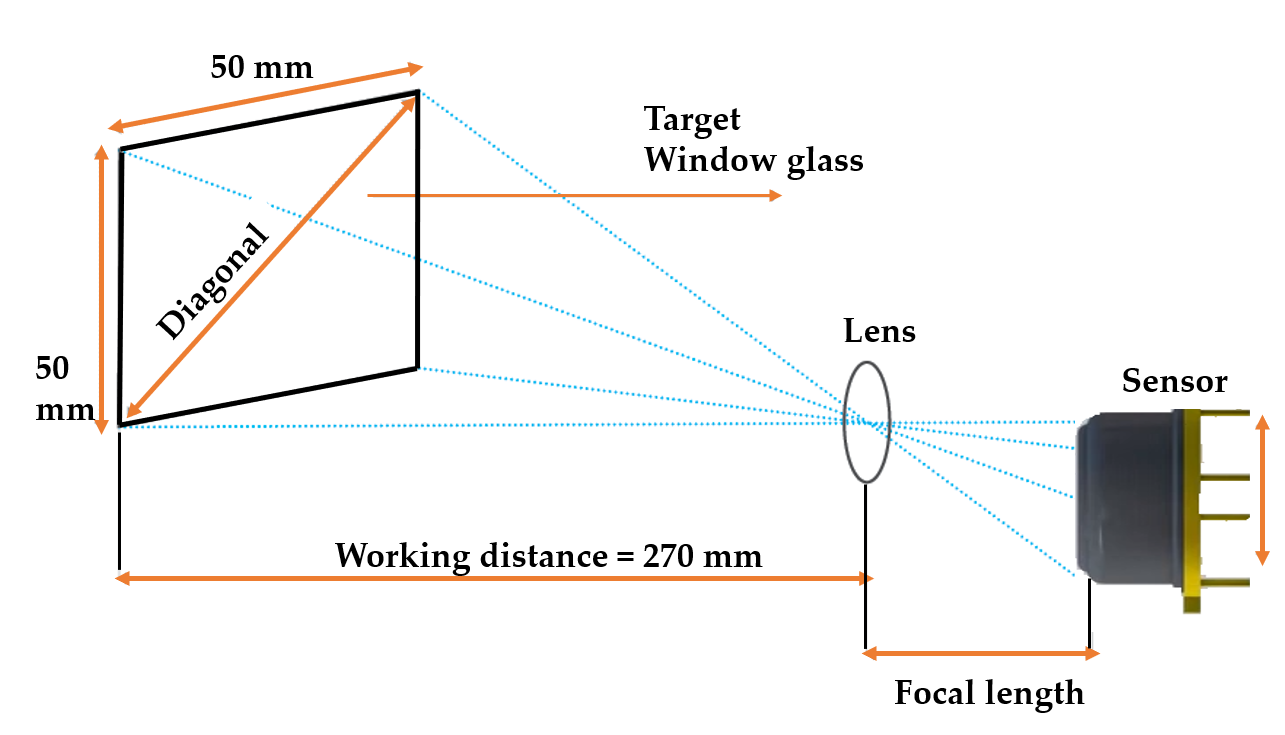
With reference to Figure 3, the mathematical model given by Eq. 1 allows for the calculation of the heat flux (Q2-3) between the WG substrates and the thermal imager only at 27 cm, as well as with the pyrgeometer at two different distances 27 cm and 8 cm. The radiative heat transfer Q2-3 from surface A2 (WG substrate) to surface A3 (the heat camera or pyrgeometer) can be described by Eq.1 [6].
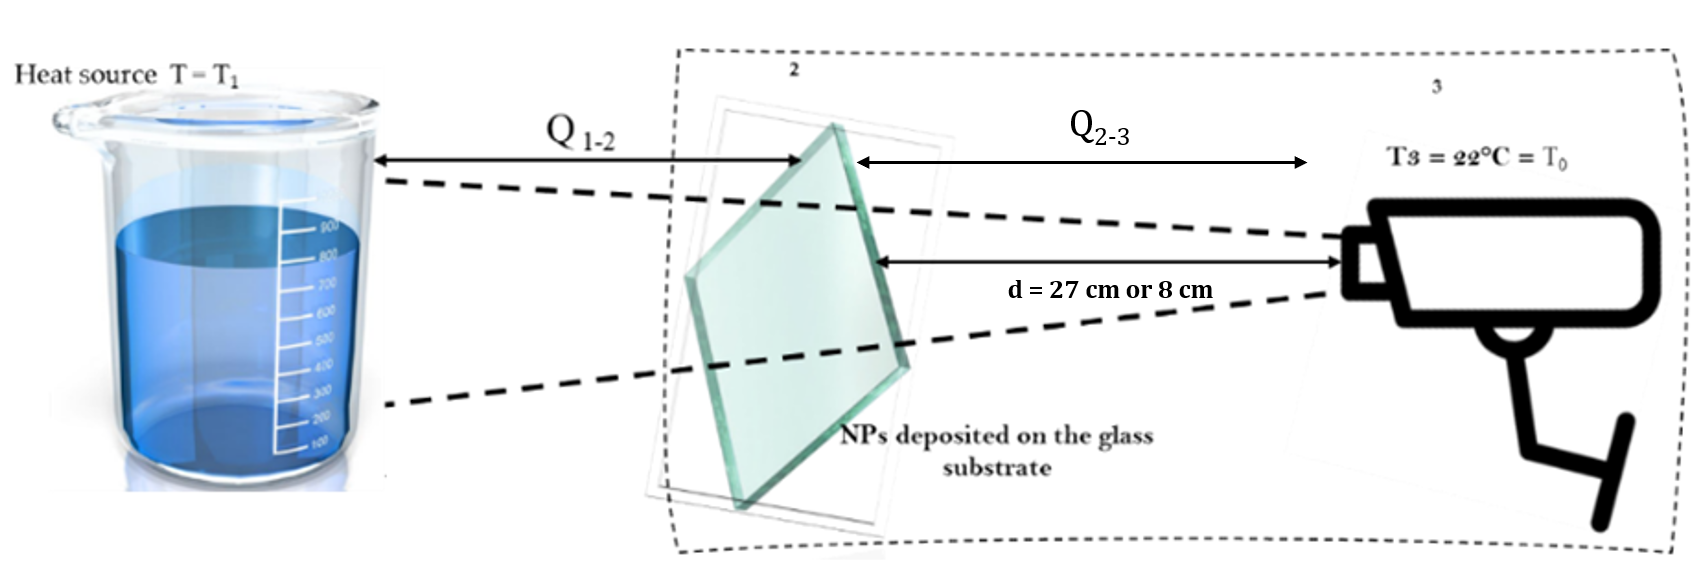
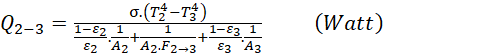
Here, σ=5.67×10⁻⁸ W/m2·K, is the Stefan–Boltzmann constant while T2 and ε2 are unknowns. T2 stands for the WG substrate's surface temperature, and ε2is the WG substrate's surface emissivity, respectively. T3 = T0 = 295 K is the ambient (laboratory) temperature, which is same as the temperature of a thermal/heat camera and pyrgeometer. The surface area of the WG substrate denoted as A2 (0.05 m × 0.05 m = 0.0025 m2), and the calculable view factor is F2→3 (for ΔTi=27 cm)=0.05523 for the thermal imager while F2→3=0.00284 and 0.02859 at distances ΔPyr = 27 cm and 8 cm respectively for the pyrgeometer. (see section 6).
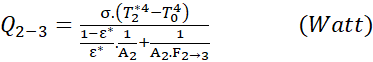
The estimated value ε2= ε*= 0.95 provided by the thermal imager software, gives a value T2*, an estimate only but not the real value for T2. Then, ε2= 1 is the emissivity of the thermal imager. Nonetheless, using a value for ε* which gives an estimate T2* for T2 allows for determining the heat flow. Then, Eq. 2 can be used to determine heat flows Q2-3 at T1 = 303 K, 313 K, and 333 K for all individual WG samples. For the pyrgeometer measurements, the device provided the heat flux in W/m2 directly as its output.
3. Experimental Procedures
3.1. Production of WG samples with NPs
Conventional WG samples were coated with TiO2-SiO2 NPs using a dip coating approach [7]. One side contains dispersed NPs, while the other side does not. Heat flow measurements conducted with the side ontaining NPs exposed to the heat source are referred to as "NP Hot," while the opposite side facing the thermal camera is referred to as "NP Cold." This process was replicated for ZnS-SiO2 NPs and subsequently for CG®(ZnS) glass samples with and without NPs. The entire test series involved 12 test samples i.e, one conventional WG sample without NPs, four with TiO2-SiO2 NPs on conventional WG samples, four with ZnS-SiO2 NPs on conventional WG samples, a CG® glass sample, and two CG® glass samples each with both types of NPs. The samples for both types of NPs were labeled as [WG 1 NP, WG 2 NP , WG 3 NP, WG 4 NP], [CG, CG NP] respectively, with increasing amounts of dispersed NPs on them.
3.2. Analysis of the NPs Coverage Area and Particle Size on Window Glass
The WG samples containing NPs underwent scanning electron microscope (SEM) characterization to a (refer to Fig.4a and Fig.4b) to assess the random dispersion of NPs on the glass surface. Image analysis software (ImageJ) was used to determine the NP coverage on the glass surface. TiO2, SiO2, and ZnS have primary particle sizes of around 25 nm, 30 nm, and 140 nm, respectively. The average particle (cluster) size and area covered by the NPs on the glass surface can be estimated from SEM images.
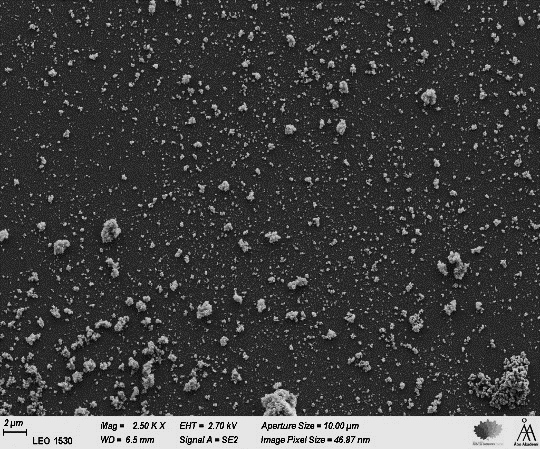
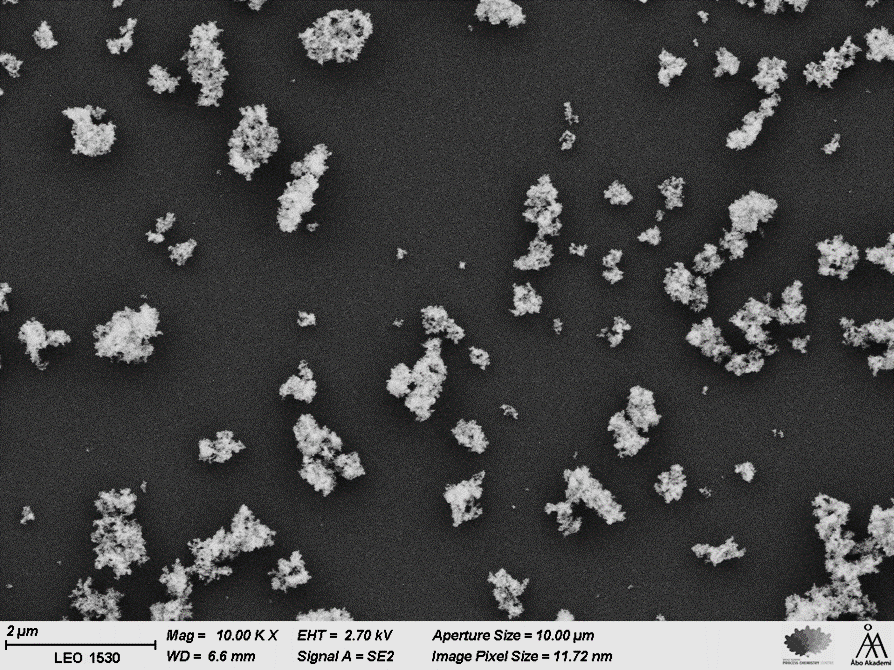
The TiO2-SiO2 sample exhibited an average particle aggregate size of 0.4 µm, whereas the ZnS-SiO2 agglomerates averaged a size of 0.1 µm. The presence of somewhat agglomerated NPs on the glass surface, could impact the scattering performance on the skylight, i.e., lowers the quality of the light that is being transmitted. Agglomerated NPs can also lead to increased reflection, thereby reducing the amount of light transmitted through the window glass material. The research conducted by Peoples et al. [8] demonstrated that NPs do not necessarily need to have uniform sizes but can instead exhibit a size distribution, such as d = 104 ± 37 nm, to achieve solar reflection > 85% during daytime.
The TiO2-SiO2 glass sample demonstrated an estimated surface coverage area of NPs at 8.0%, while the ZnS-SiO2 glass shows an estimated coverage of 15.8%. Specifically, the measured quantities of TiO2-SiO2 NPs on the WG1, WG2, WG3, and WG4 samples are 0.2 mg, 0.3 mg, 0.3 mg, and 0.4 mg, respectively. Correspondingly, for ZnS-SiO2 NPs on WG1, WG2, WG3, and WG4, the measured masses are 0.2 mg, 0.2 mg, 0.3 mg, and 0.3 mg. ( The precision of measured masses of the NPs is ± 0.1 mg.)
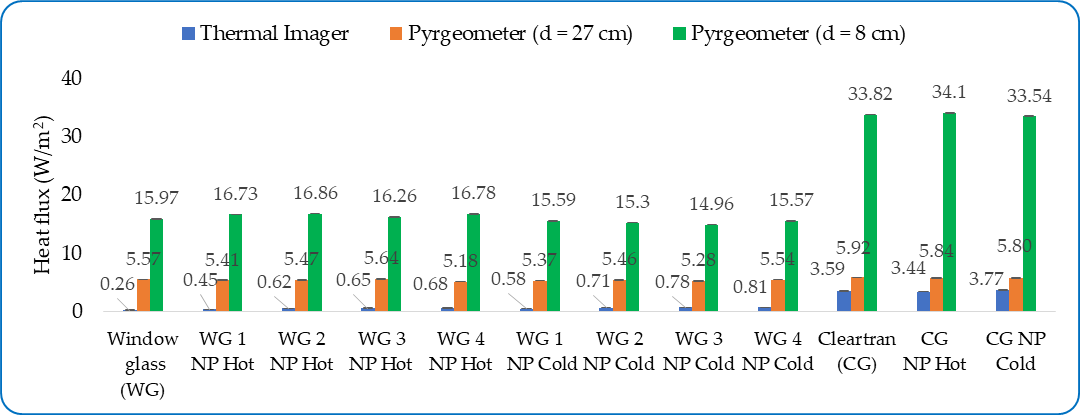
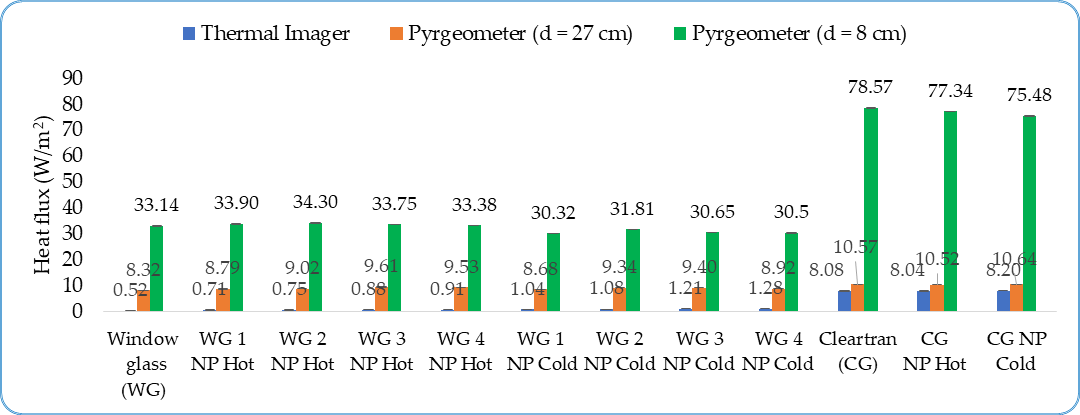
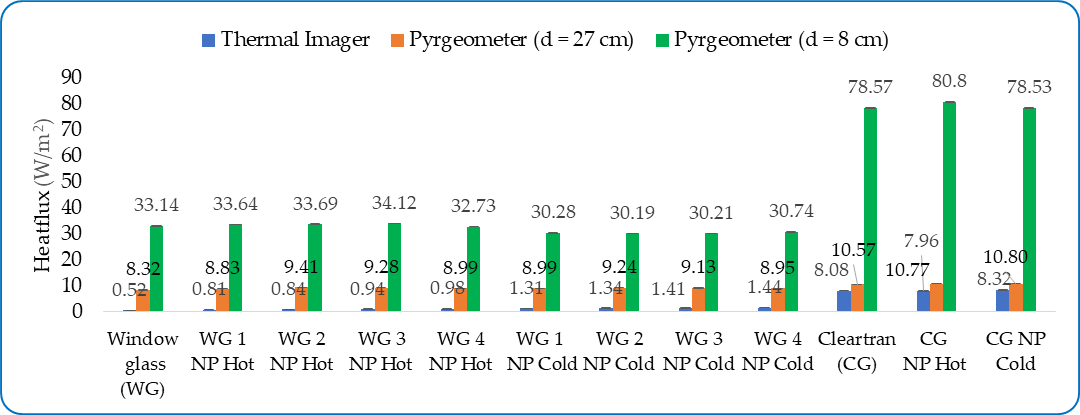
3.3. Comparing heat flux (Q2-3) between two types of NP composites at 313 K using thermal imager
Despite all the WGs being manufactured using the same procedure, variations in measured heat fluxes arise from differing quantities of NPs on each glass. Two instruments, a thermal imager and a pyrgeometer, were utilized for the measurements of heat fluxes at 27 cm and 8 cm, respectively from the WG and CG® samples.
The findings using the thermal camera indicated that the randomly NPs dispersed on the backside of the WGs facing away from the heat source - referred to as NP Cold, - resulted in a higher heat flux than those with NPs on the front side (NP Hot). Perhaps not surprisingly, the heat flux consistently rises with elevated heat source temperatures, in the order of 333 K > 313 K > 303 K. The reason behind the Q2- 3 NP Cold > Q2-3 NP Hot may be as follows: NPs facing the heat source (NP Hot) reflect heat away from the camera, whereas NPs on the opposite side (NP Cold) do not reflect heat away; instead, they absorb heat through conduction via the glass. (Note: conventional WG cannot transmit LW radiation from the heat source).
For CG® tests, a LW transmittance of 75% results in additional heat flow equivalent to τ·Q1-2 = 0.75·Q1-2 through the substrate, combining with Q2-3, following a model equation similar to Eq.(1) for Q1-2. Analysis reveals that CG® without NPs allows for greater heat transfer compared to the NP Hot side, with reduced LW heat flux observed on the NP Hot side, indicating significant heat reflection from NPs. Conversely, NP Cold experiments show higher heat transfer due to improved emissivity of CG® when combined with NPs, as opposed to CG® glass alone. Even with some reflectance (ρ ≠ 0), the emissivity value must be < 0.25, derived from ρ + ε + τ =1, with τ ≈ 0.75 for CG® glass.
3.4. Comparing heat flux (Q2-3) between two types of NP composites at 313 K using pyrgeometer
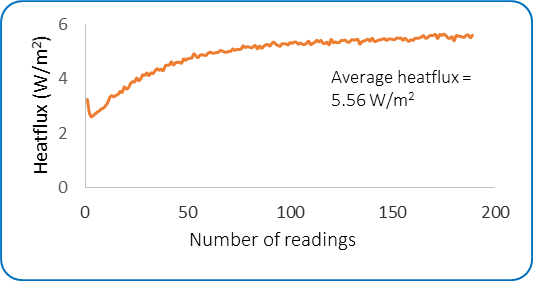
The pyrgeometer, like the thermal camera, measures LW heat radiation and provides comparative data, as shown as an example in Figure 5.
An experiment continued for around 40 minutes, with a time interval of Δt = 10 seconds, until the heat flux reached a steady-state situation. The recorded heat flux at 8 cm is 15.96 W/m², significantly surpassing the value at 27 cm, which is 5.56 W/m². This difference is attributed to the view factor (see the Appendix for view factor calculations). The reported heat flux values represent averaged last 60 seconds measured values after achieving a steady-state condition.
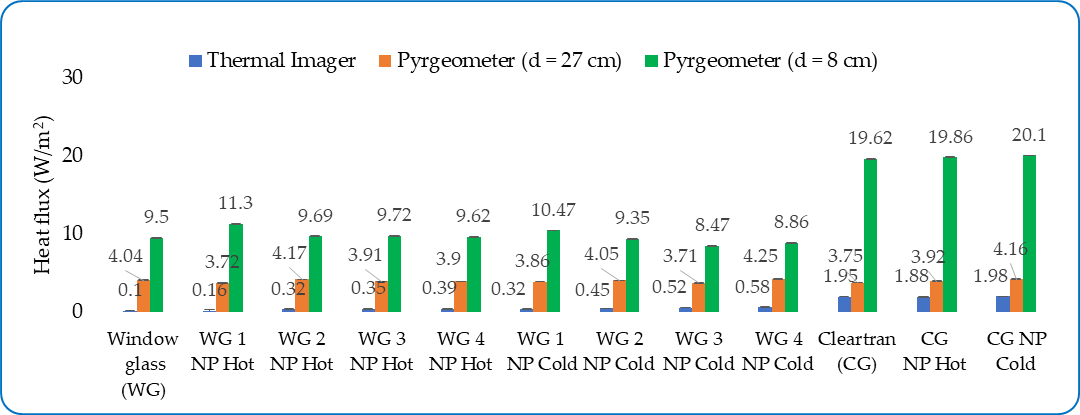
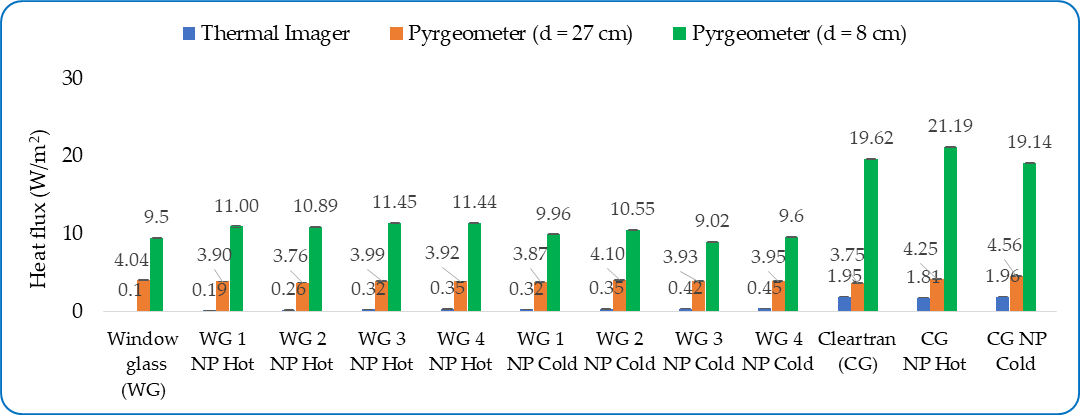
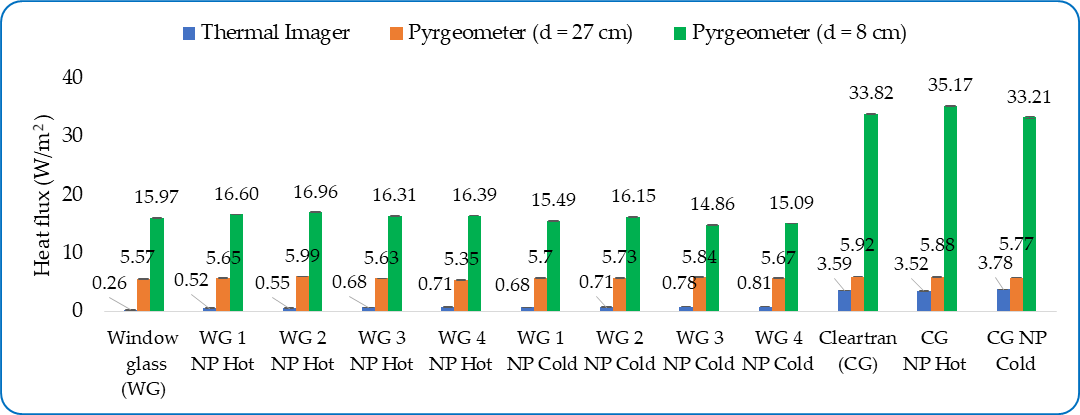
Observing Figures. 6a and 6b below, the blue labels (thermal imager data) and orange labels (pyrgeometer data represents data collected at an identical distance collected at an identical distance (d = 27 cm), implying almost the same view factor. However, the difference in heat flux values is partly attributed to the use of different devices. The pyrgeometer observes approximately twice the amount of heat radiation captured by the thermal imager (ratio Pyr/Ti: 1.99 at 303 K, 1.93 at 313 K and 1.84 at 333 K), owing to its wider wavelength.

where Eb(T,λ) denotes blackbody radiation according to Planck's law, while ε(T,λ) represents material emissivity at temperature (T) and wavelength (λ).
Likewise, the aqua green label data depicts heat flux measurements collected at a shorter distance (d = 8 cm), signifying increased visibility (higher view factor) between the WG surface to the pyrgeometer, giving significantly higher heat flux values. Also, at all the temperatures (303 K, 313 K and 333 K), the measured heat fluxes for conventional WGs with τ ≈ 0 for LW transmittance are consistently lower than those for CG® with τ ≈ 0.75. Unexpectedly, in most cases, the pyrgeometer observations showed that Q2-3 NP Hot > greater than Q2-3 NP Cold, contrary to observations from the thermal imager. The observed differences in results between the thermal camera and pyrgeometer can moreover be attributed to their respective wavelength sensitivities. The devices measure different emissivities for all the window glass (WG) samples.
4. Results and discussion
As said earlier, the thermal camera operates within a narrow wavelength close to the atmospheric window (7.5-14 µm) compared to the broader range covered by the pyrgeometer (4.5-42 µm).
The standard deviations for the heat flux data collected with the pyrgeometer, as depicted in Fig. 6a. to 8b, (see below) at 303 k, 313 K and 333 K respectively were calculated based on 200 recordings for each of the WGs. The calculated standard deviations range from 0.01W/m2 to 0.17 W/m2 for the NP Hot side, 0.01 W/m2 to 0.12 W/m2 for the NP Cold side, and for the CG®, the range is from 0.03 W/m2 to 0.12 W/m2. Additionally, the deviations in temperature recordings during the surface temperature measurements using an IR thermal camera ranging from ± 0.1 to ± 0.5°C. These deviations are based on five observations for each glass sample.
However, the obtained heat fluxes (based on heat camera/pyrgeometer) are insufficient to improve the thermal performance of the windows for passive cooling. While for conventional WGs the heat flux is increased by a factor of 2 to 4, for the CG® glass, the change is only a few percent. The SEM investigation detailed in section 3.2, gives the surface coverage of NPs on the glass surface. It is found that TiO2-SiO2 NPs had roughly 50% lower coverage compared to the ZnS-SiO2 NPs. Not only was there a difference in coverage between these two types of NPs, but the overall amount of NPs deposited on the WG surface was considerably lower. Altogether, quantity of both types of NPs, TiO2-SiO2 and ZnS-SiO2 on the WG surface was insufficient compared to an ideal deposition level required for achieving the desired daytime cooling performance.
A desirable daytime PRC structure should have a solar reflectivity much higher than 90%, preferably exceeding 95% in SW, along with a large emissivity value greater than or equal to 0.95 in the atmospheric window [5]. Therefore, modifying the current window material structure by increasing the NPs composition more than five times than the current levels may be necessary. However, in ÅAU transmissive skylight application, it cannot be necessary to reflect 95% of solar energy since visible light should pass through a building’s roof.
4.1. Measurements of reflectance and transmittance in short wavelength for window glasses
The sun emits SW radiation from 0.2 to 3 µm, consisting of UV, visible (0.4-0.7 µm), and near-IR wavelengths. Materials aiming to restrict exposure to the sun partly or completely block this SW radiation, by altering the surface characteristics. NPs such as TiO2 – SiO2 and ZnS – SiO2 have been designed to alleviate SW radiation due to its unique properties (see section 1.2) like preventing solar rays from penetrating surfaces.
Therefore, Spectrophotometry (Lambda 1050+ UV/Vis/NIR Spectrophotometer) analysis has been performed on all the WG samples focusing on how TiO2-SiO2 and ZnS-SiO2 NPs reflect SW radiation. This assessment is informative and helpful for understanding the daytime PRC system design strategies. By analyzing
the reflectance properties of the current WG samples containing these NPs, valuable insights can be gained into their potential for enhancing SW radiation reflection and maximizing the efficiency of daytime PRC systems.
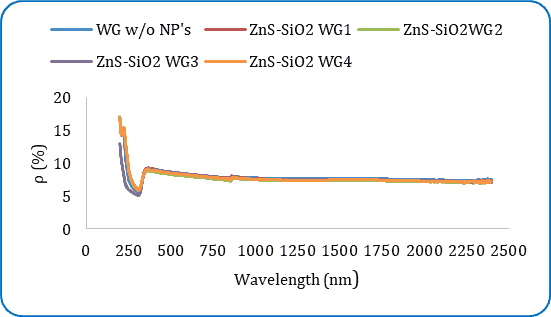
Figures. 9a and 9b shows how SW radiation is reflected differently in conventional WGs containing both types of dispersed NPs compared to the reference WGs without NPs. Figure. 9c shows the reflection ( ) of SW radiation on CG® glass incorporating both types of NPs. The equation used for calculating the difference between WG’s with and without NPs is:
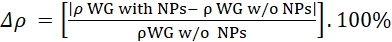

Significantly, sunlight reflection in the visible spectrum is observed with TiO2- SiO2 NPs (Figure. 9a). The calculated values for WGs with TiO2-SiO2 NPs are as follows: WG1 (Δρ = 4.20 %), WG2 (Δρ = 2.75 %), WG3 (Δρ = 2.48 %), and WG4 (Δρ = 2.24 %), in comparison to conventional WG samples. WG1 exhibits the highest Δρ reflectance value.
Similarly (see Figure 9b), among these samples, WG2 with ZnS-SiO2 NPs has the highest Δρ ratio of 3.40. Top of FormThis implies that NPs have some capacity to reflect the incoming SW radiation.
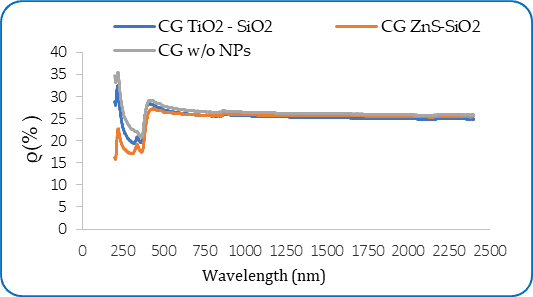
In case of, the CG® glass (see Figure 9c) with TiO2-SiO2 NPs exhibits a ρ = 3.07%, indicating a moderate level of reflectance. Similarly, the CG® glass with ZnS-SiO2 NPs shows a slightly increased effect with ρ = of 4.71%, suggesting a somewhat higher reflectance. Overall, both NPs demonstrate an ability to reflect a portion of incident light in visible spectrum.
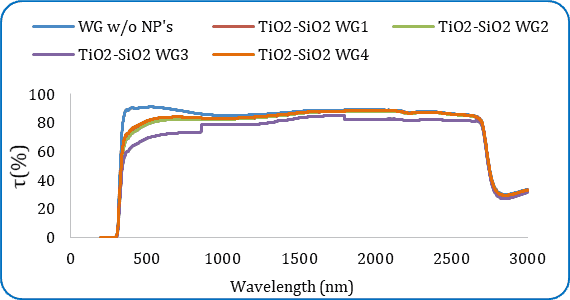
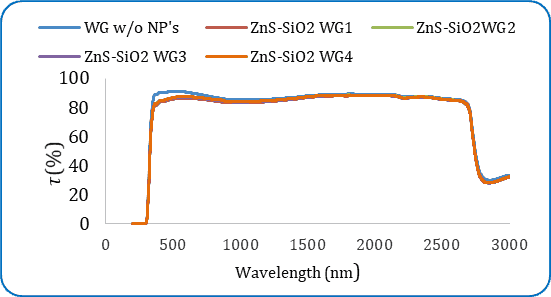
The results shown in Figures 10a to 10c indicate the transmittance in the SW region for the CG® material to stay high at > 2750 nm, at τ ≈ 0.75. As Figure. 7c shows a reflectance ρ ≈ 0.25, a transmittance of τ ≈ 0.75 results in an emissivity (ε) or absorptivity (α) close to zero.
According to Figure. 10a, for the visible wavelength region, the best performing WG in terms of higher transmittance is WG without NPs, 𝜏 = 90.26%. However, WG3 with TiO2-SiO2 NPs has lowest 𝜏 = 69.62% is more effective in limiting transmission in the SW region.
Conversely, ZnS-SiO2 (Figure 10b) WG1 has slightly lower transmittance (85.52%) than the base WG, indicating a moderate reduction in solar transmission. Also, WG2, WG3, and WG4 show reduced transmission compared to the base glass, with transmittances of 86.53%, 86.27%, and 86.58%, respectively.
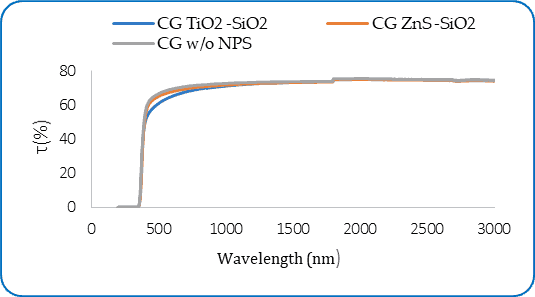
CG® has a relatively high 𝜏 = 67.13%, indicating that it allows a significant amount of solar radiation to pass through, but with CG TiO2-SiO2, 𝜏 = 62.10% is lower than the base CG®, suggesting a reduction in solar transmission. In comparison, the CG ZnS-SiO2 sample shows a slightly higher transmission 𝜏 = 65.55%. Therefore, CG TiO2-SiO2 seems to be the most effective in reducing solar transmission, as it has the lowest transmission percentage among the samples. (See Figure 10c).
5. Determining the longwave emissivity of window glass samples
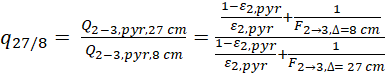
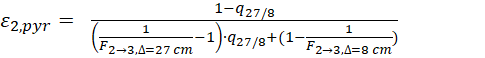
As discussed in the above sections, placing a pyrgeometer at d = 27 cm and d = 8 cm measures LW heat radiation from WGs with or without NPs. A thermal imager at d = 27 cm captures LWIR (7.5-14 µm). Eq. 2 calculates heat flow in W, converted to heat flux (W/m²) for the glass surface. The model determines actual emissivities (ε2) for specific wavelengths, using heat flux data collected at varying distances between WG samples at temperature T2, and identical T0. The pyrgeometer covers 4.5-42 µm. The ratio q27/8 compares heat fluxes at d = 27 cm and d = 8 cm, providing the emissivity value (ε2, pyr) of the WG substrate measured by the pyrgeometer.
The view factor F2→3 from the rectangular WG substrate to the circular detector The vew factor F2→3 from the rectangular WG substrahe
The view factor F2→3 from the rectangular WG substrate to the circular detector (pyrgeometer sensor with a diameter of 3 cm) can be determined as described in the appendix, i.e, F2→3,∆=8cm and F2→3,∆=27cm. Having determined ε2,Pyr or , it becomes possible to calculate T2, which should remain consistent regardless of the distance to the measurement device.
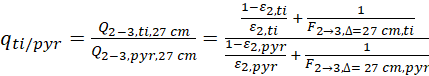
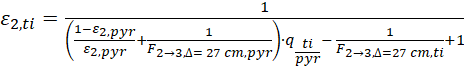
Similarly, the measurements at d = 27 cm using a pyrgeometer and a thermal imager suggest variations in view factors and wavelength ranges, yet they allow for calculating the window substrate emissivity as ε2,ti measured by the thermal imager. This involves using ratios qti/Pyr and wider wavelength values ε2,pyr.
6. Calculated view factors at distances of d = 27 cm and d = 8 cm for both the pyrgeometer and thermal imager.
This section details the mathematical calculation of the view factors F2→3 in three distinct scenarios when measuring the heat fluxes between the window glass (WG) samples and the heat source. This involves defining the geometry of surfaces, and applicable trigonometric equations to determine the radiation exchange between surfaces in a system. These scenarios include measurements taken at a distance of d = 27 cm for both the pyrgeometer and thermal imager, as well as measurements at d = 8 cm for the pyrgeometer alone.
Case 1: As previously mentioned, the pyrgeometer is equipped with a small circular sensor measuring 3 cm in diameter, positioned to face the rectangular window glass (WG) samples with dimensions of 5 cm x 5 cm. The operational distance (H) is set at d = 27 cm, representing the distance between the glass plate and the sensor.
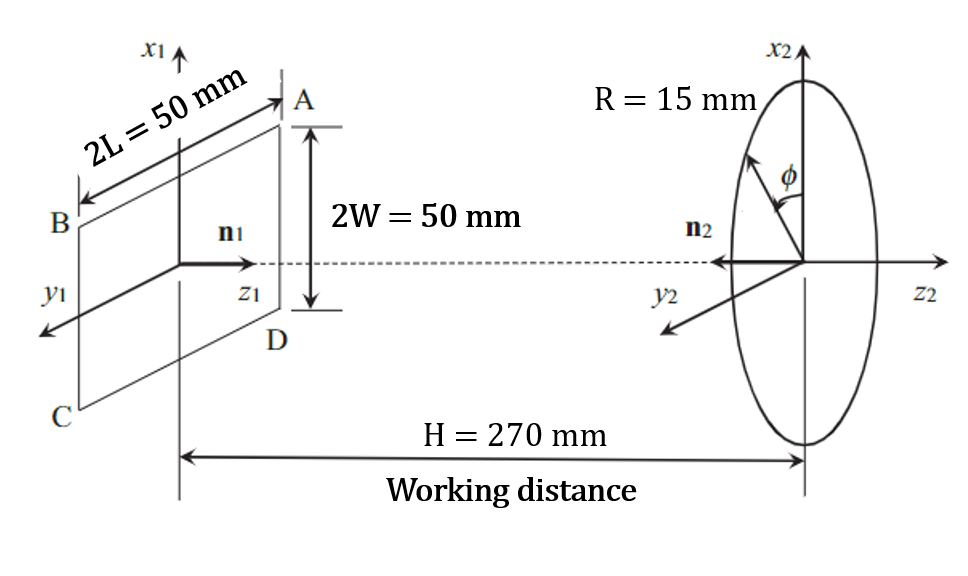
A model correlation is essential to calculate the view factor F between a window glass surface (A1) and a coaxial circular pyrgeometer sensor (A2), both situated in parallel planes. Hence, the formula provided in [10] is used in this context to calculate F2→3, and it is expressed as:
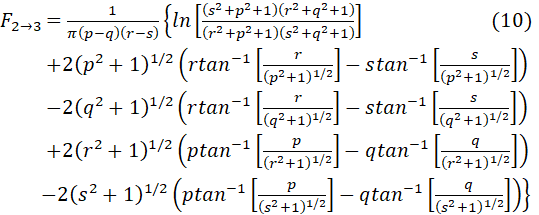
Using p = ![]() /
/![]() +
+ ![]() , q =
, q = ![]() /
/![]() -
- ![]() , r =
, r = ![]() /
/![]() +
+ ![]() and S =
and S = ![]() /
/![]() -
- ![]() in equ (10)
will result in F1i in equ (11). Similarly, using p =
in equ (10)
will result in F1i in equ (11). Similarly, using p = ![]() +
+ ![]() , q = =
, q = = ![]() -
- ![]() , r =
, r = ![]() +
+ ![]() and s =
and s = ![]() +
+ ![]() in equ (10)
will yield F1C in equ (11). The correct value of view factor
must satisfy F1i < F2→3
< F1c. This suggests that F2→3
could be modeled as a combination of F1i
and F1c. Therefore, it is proposed that:
in equ (10)
will yield F1C in equ (11). The correct value of view factor
must satisfy F1i < F2→3
< F1c. This suggests that F2→3
could be modeled as a combination of F1i
and F1c. Therefore, it is proposed that:
F2→3 = 0.3272(F1i)0.9136 + 0.6815(F1c)1.0568 equ (11)
(Note: After substituting all the relevant values, the view factor F2→3 calculated at a working distance H=270 mm is 0.00284. Case 2: where the working distance H is changed to 80 mm while keeping all other parameters same as above, F2→3 =0.02859. Case 3: the thermal imager is positioned at a working distance of H=270 mm, and it features a spherical sensor lens with a diameter of 38 mm (i.e. R=19 mm). Following a procedure similar to the aforementioned, using Equ (10) and Equ(11), the resulting view factor F2→3 is calculated to be 0.05523. However, this is not the correct value because the view factor F2→3 is not applicable for the thermal imager, as it has its own field of view (FOV) of 23° x 17°. Therefore, the previously calculated F2→3 using equations (10) and (11) is not accurate for the thermal imager. To accurately assess the radiation exchange and coverage, the field of view (FOV) of the thermal imager should be considered. This FOV determines the angular range within which the thermal imager can detect and measure thermal radiation. The relationship between the FOV and working distance (H) is given by the formula: S = [H *![]() = R/H,
= R/H, ![]() = W/H,
= W/H, ![]() = L/H, and L =
W = 25 mm, R = 15 mm, H = 270 mm).
= L/H, and L =
W = 25 mm, R = 15 mm, H = 270 mm).
![]() H =
H = ![]()
![]() equ (12)
equ (12)
For a 23° FOV, S1=147.8642 mm, and for a 17° FOV, S2=118.7035 mm. These distances represent the spatial extent covered by the thermal imager within the specified field of view angles. Further, dividing the sensor diameter by S1 and S2 yields the plane of view in both directions of the FOV, resulting in 3.8912 for the 23° FOV for area and 3.1238 for the 17° FOV , this gives a factor of 12.15513 due to the spherical sensor surface. Now, it is possible to correct the calculated view factor (see Table 1) using Equ (10) and Equ (11) by multiplying the previously calculated value of F2→3=0.004544 by the area coverage factor of 12.15513. Thus, the actual view factor F2→3 becomes 0.004544×12.15513=0.055233.
Table 1. Calculated View factors.
|
Experimental Devices |
View factor F2→3 |
|
Pyrgeometer at H = 270 mm |
0.00284 |
|
Pyrgeometer at H = 80 mm |
0.02859 |
|
Thermal imager at H = 270 mm |
0.05523 |
Certainly, with the obtained values for F2→3 in all the experimented scenarios, substituting these values into equ (6) and (9) to determine the longwave emissivities ε2,Pyr and ε2,ti for all the WG and the CG®, both with and without NPs at different temperatures such as 303 K, 313 K and 333 K. These emissivity values can then be listed in the subsequent sections for comparison and analysis:
6.1. Longwave emissivities (ε2Pyr and ε2,ti) for the WG and CG® samples
This section provides an analysis of the LW emissivities ε2,Pyr and ε§2,ti) for all the WG samples and CG® samples, including those with and without NPs on the glass surface. Table 2. LW ε2,Pyr for WG and CG samples with randomly dispersed TiO2 – SiO2 NPs
|
Window Glass Samples |
ε2,Pyr 303 K |
ε2,Pyr 313 K |
ε2,Pyr 333 K |
|
Window glass (WG) |
0.005 |
0.007 |
0.014 |
|
WG 1 NP Hot |
0.008 |
0.008 |
0.013 |
|
WG 2 NP Hot |
0.005 |
0.007 |
0.013 |
|
WG 3 NP Hot |
0.006 |
0.007 |
0.011 |
|
WG 4 NP Hot |
0.005 |
0.008 |
0.011 |
|
WG 1 NP Cold |
0.007 |
0.007 |
0.011 |
|
WG 2 NP Cold |
0.005 |
0.007 |
0.010 |
|
WG 3 NP Cold |
0.005 |
0.006 |
0.009 |
|
WG 4 NP Cold |
0.004 |
0.006 |
0.010 |
|
Cleartran (CG) |
0.024 |
0.030 |
0.065 |
|
CG NP Hot |
0.023 |
0.034 |
0.062 |
|
CG NP Cold |
0.020 |
0.030 |
0.055 |
In Table 2, among the NP Hot WG samples, WG 1 NP Hot exhibits higher emissivity (ε2) values compared to other samples for all heat source temperatures (303 K, 313 K, and 333 K). This suggests that WG1 NP Hot would be more effective at radiating heat compared to other samples. Among the NP Cold glass samples, WG 1 NP Cold and WG 2 NP Cold tests to have slightly higher emissivity values compared to other samples for all temperatures.
The CG® samples with TiO2-SiO2 NPs, including CG NP Hot and CG NP Cold measurements give slightly lower emissivity values compared to the base CG® for all temperatures.
Table 3. LW ε2,Pyr for WG and CG samples with randomly dispersed ZnS-SiO2 NPs
|
Window Glass Samples |
ε2,Pyr 303K |
ε2,Pyr 313 K |
ε2,Pyr 333 K |
|
Window glass (WG) |
0.005 |
0.007 |
0.014 |
|
WG 1 NP Hot |
0.007 |
0.008 |
0.013 |
|
WG 2 NP Hot |
0.007 |
0.008 |
0.011 |
|
WG 3 NP Hot |
0.007 |
0.007 |
0.012 |
|
WG 4 NP Hot |
0.008 |
0.009 |
0.012 |
|
WG 1 NP Cold |
0.006 |
0.008 |
0.010 |
|
WG 2 NP Cold |
0.006 |
0.007 |
0.009 |
|
WG 3 NP Cold |
0.005 |
0.007 |
0.010 |
|
WG 4 NP Cold |
0.005 |
0.007 |
0.010 |
|
Cleartran (CG) |
0.024 |
0.030 |
0.065 |
|
CG NP Hot |
0.022 |
0.032 |
0.067 |
|
CG NP Cold |
0.015 |
0.031 |
0.060 |
Based on the data from Table 3, the WG samples with randomly dispersed ZnS-SiO2 NPs exhibit emissivity values comparable to the corresponding samples with TiO2-SiO2 NPs from Table 2. However, among the WG samples with ZnS-SiO2 NPs, WG 1 NP Hot, WG 2 NP Hot, and WG 4 NP Hot show slightly higher emissivity values compared to the base WG sample for the different heat source temperatures. The WG NP Cold samples give lower emissivity values compared to the base WG sample and for the NP Hot glass samples.
Regarding the CG® glass samples, both the CG NP Hot, CG NP Cold show lower emissivity values compared to the base CG sample for the different temperatures. The slight variations in emissivity values among WG samples with both types of NPs suggest potential for improvement in thermal performance. One strategy is to increase NPs concentration by 5 times (see section 4).
Table 4. LW ε2,ti for WG and CG samples with randomly dispersed TiO2-SiO2 NPs
|
Window Glass Samples |
ε2,ti 303 K |
ε2,ti 313 K |
ε2,ti 333 K |
|
Window glass (WG) |
- |
0.183 |
0.108 |
|
WG 1 NP Hot |
0.297 |
0.037 |
0.056 |
|
WG 2 NP Hot |
0.038 |
0.036 |
0.054 |
|
WG 3 NP Hot |
0.032 |
0.024 |
0.043 |
|
WG 4 NP Hot |
0.028 |
0.022 |
0.039 |
|
WG 1 NP Cold |
0.040 |
0.023 |
0.027 |
|
WG 2 NP Cold |
0.022 |
0.023 |
0.029 |
|
WG 3 NP Cold |
0.016 |
0.019 |
0.024 |
|
WG 4 NP Cold |
0.015 |
0.018 |
0.021 |
|
Cleartran (CG) |
0.005 |
0.005 |
0.004 |
|
CG NP Hot |
0.006 |
0.005 |
0.004 |
|
CG NP Cold |
0.006 |
0.004 |
0.004 |
Table 5. LW ε2,ti for WG and CG samples with randomly dispersed ZnS-SiO2 NPs
|
Window Glass Samples |
ε2,ti 303 K |
ε2,ti 313 K |
ε2,ti 333 K |
|
Window glass (WG) |
- |
0.183 |
0.108 |
|
WG 1 NP Hot |
0.138 |
0.045 |
0.045 |
|
WG 2 NP Hot |
0.062 |
0.028 |
0.046 |
|
WG 3 NP Hot |
0.045 |
0.026 |
0.036 |
|
WG 4 NP Hot |
0.038 |
0.023 |
0.032 |
|
WG 1 NP Cold |
0.038 |
0.028 |
0.021 |
|
WG 2 NP Cold |
0.036 |
0.021 |
0.021 |
|
WG 3 NP Cold |
0.023 |
0.018 |
0.019 |
|
WG 4 NP Cold |
0.022 |
0.018 |
0.018 |
|
Cleartran (CG) |
0.005 |
0.005 |
0.004 |
|
CG NP Hot |
0.007 |
0.005 |
0.004 |
|
CG NP Cold |
0.006 |
0.004 |
0.004 |
In Table 4, LW emissivities ε2,ti is given for WG and CG® samples with randomly dispersed TiO2-SiO2 NPs. The base WG sample lacks a result for ε2,ti at 303 K due to the limited sensitivity range of the thermal imager, which is ≤0.2 °C at 303 K. The ambient temperature (T0) is 295 K, and the average glass temperature (T2*) is 295.3 K. Among the WG samples with TiO2-SiO2 NPs, WG 1 NP Hot has the highest ε2,ti values for all heat source temperatures. The NP Hot data gave higher ε2,ti values compared to the corresponding NP Cold WG samples. Overall, the ε2,ti values for the WG samples tend to decrease with decreasing temperature. For the CG glass samples, both the base CG, CG NP Hot and CG NP Cold have lower ε2,ti values compared to the WG samples for all temperatures.
As for the LW emissivity values presented in Table 5 for WG Samples with randomly dispersed ZnS-SiO2 NPs, WG 1 NP Hot consistently gives relatively higher LW emissivity values compared to other WG samples with NPs across all three different temperatures. WG 1 NP Cold also shows higher emissivity values compared to other WG samples, especially at 303 K and 313 K. Among the WG samples with NPs, WG 1 NP Hot and WG 1 NP Cold showed the highest LW emissivity.
For CG glass samples with and without NPs, CG glass consistently exhibited lower LW emissivity values compared to WG samples with NPs. Both CG NP Hot and CG NP Cold show slightly higher LW emissivity compared to base CG glass, but the difference is relatively small. For certain temperatures, the WG samples with ZnS-SiO2 NPs show slightly lower emissivity values compared to those with TiO2-SiO2 NPs.
6.2. Calculated window glass temperatures
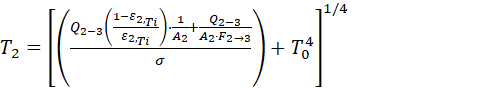
Accurate WG sample temperatures require real emissivities for each glass type. Eq.2 uses a fixed emissivity value (ε* = 0.95), leading to incorrect estimates of averaged glass temperatures (T2*). Actual WG temperatures (T2) can be calculated using Eq.7 with known ε2,ti from Tables 4 and 5. However, no WG values are available at 303 K.
Table 6. Temperature in (°C) WG and CG samples with randomly dispersed TiO2-SiO2 NPs
|
Window Glass Samples |
T2 of WG at 303K |
T2 of WG at 313K |
T2 of WG at 333K |
|
Window glass (WG) |
- |
22.99 |
24.32 |
|
WG 1 NP Hot |
22.56 |
25.84 |
26.18 |
|
WG 2 NP Hot |
24.36 |
26.17 |
26.47 |
|
WG 3 NP Hot |
24.90 |
28.63 |
27.94 |
|
WG 4 NP Hot |
25.47 |
29.42 |
28.44 |
|
WG 1 NP Cold |
24.30 |
28.78 |
31.15 |
|
WG 2 NP Cold |
26.75 |
29.24 |
31.15 |
|
WG 3 NP Cold |
28.77 |
30.93 |
33.55 |
|
WG 4 NP Cold |
30.04 |
31.68 |
35.17 |
|
Cleartran (CG) |
74.59 |
113.61 |
194.13 |
|
CG NP Hot |
70.24 |
110.90 |
193.79 |
|
CG NP Cold |
72.28 |
122.12 |
197.12 |
Table 7. Temperature in (°C) WG samples with randomly dispersed ZnS-SiO2 NPs
|
Window Glass Samples |
T2 of WG at 303K |
T2 of WG at 313K |
T2 of WG at 333K |
|
Window glass (WG) |
- |
22.99 |
24.32 |
|
WG 1 NP Hot |
22.80 |
25.00 |
27.35 |
|
WG 2 NP Hot |
23.46 |
27.44 |
27.46 |
|
WG 3 NP Hot |
24.16 |
28.03 |
29.07 |
|
WG 4 NP Hot |
24.63 |
28.82 |
29.79 |
|
WG 1 NP Cold |
24.37 |
27.13 |
35.61 |
|
WG 2 NP Cold |
24.70 |
29.61 |
36.04 |
|
WG 3 NP Cold |
26.24 |
31.25 |
37.81 |
|
WG 4 NP Cold |
26.69 |
31.60 |
38.51 |
|
Cleartran (CG) |
74.59 |
113.61 |
194.13 |
|
CG NP Hot |
64.67 |
109.10 |
189.56 |
|
CG NP Cold |
69.70 |
121.18 |
198.54 |
In Tables 6 and 7. the calculated real temperatures T2 values for CG glass are unrealistically high. stemming from the heat flux Q1-2 for these cases. in fact, Q2-3 is Q2-3 + 0.75 . Q1-2 for CG glasses.
7. Calculating Solar Reflective Index for roof material
The Solar Reflective Index (SRI) is a standard metric for evaluating the daytime performance rating coefficient of roof materials, as it quantifies their ability to reflect solar irradiation and reduce heat absorption. In general, higher SRI values are desirable for cool roofs, as they indicate greater reflectivity and better thermal performance.
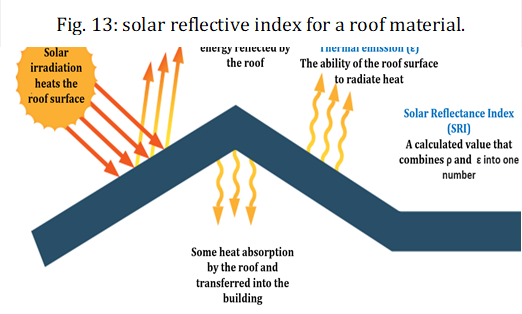
The Cool Roof Rating Council (CRRC) in the United States, for example, categorizes SRI values as follows for highly reflective (cool roofs): SRI = 80-100, moderately reflective: SRI = 65-79, and slightly reflective: SRI = 30-64 [9].
where reflectance (ρ%) and transmittance (τ%) for WG and CG® samples in the SW region in 0.25 µm to 3 µm were measured using spectrophotometry (See Table 7).
Table 8. Solar reflective index.
|
TiO2–SiO2 NPs |
ρ% |
τ% |
SRI |
|
WG w/o NPS |
7.85 |
78.29 |
67.50 |
|
WG1 |
7.34 |
75.38 |
68.85 |
|
WG2 |
7.36 |
75.18 |
68.90 |
|
WG3 |
7.42 |
70.48 |
70.51 |
|
WG4 |
7.41 |
76.04 |
68.57 |
|
CG® |
25.29 |
67.5 |
59.94 |
|
ZnS–SiO2 NPs |
ρ% |
τ% |
SRI |
|
WG w/o NPS |
7.85 |
78.29 |
67.50 |
|
WG1 |
7.8 |
76.45 |
68.17 |
|
WG2 |
7.6 |
76.92 |
68.14 |
|
WG3 |
7.61 |
76.65 |
68.23 |
|
WG4 |
7.63 |
76.9 |
68.13 |
|
CG® |
25.14 |
67.8 |
59.93 |
8. Conclusions
This research investigates LW heat radiation in different glass types: conventional WG, WGs with TiO2-SiO2 NPs, WG with ZnS-SiO2 NPs, and CG® glass. Heat source temperatures (303 K, 313 K, 333 K) assess each glass's LW heat radiation. Experimental results show significantly increased he at flux in conventional WG with NPs on the cold side. CG® glass exhibits a slight increase in heat flux, while ZnS-SiO2 NPs show a slightly stronger effect compared to TiO2-SiO2 NPs. CG® glass with NPs has a small impact on heat flux due to its high LW transmittance.
For tests using the pyrgeometer an unexpected trend emerged where, in most cases, the observed LW heat flux indicated NP Hot > NP Cold, contradicting the findings from the thermal imager. For CG®, the NPs reflect more than they absorb and emit.
Furthermore, reflectance and transmission within the SW region were measured for each WG sample of using spectrophotometry measurements.
The results, showing different heat fluxes due to instrument wavelength sensitivity, serve as the basis for determining glass sample emissivities (ε2.Pyr and ε2.ti) at temperatures of 303 K, 313 K, and 333 K using heat balance equations, known emissivities allow the calculation of actual WG temperatures.
In addition to analyzing WG thermal behavior, calculating the SRI is crucial for understanding their effectiveness in reflecting solar radiation for daytime heat management. To enhance the ÅAU passive cooling skylight's thermal performance. This research suggests the need for larger amounts of NPs (≈ 5 times than NPs used in this study) and exploring parameters like NPs composition and area coverage fraction. Additional investigations will assess how NPs influence both LW and SW radiation characteristics under direct sunlight.Top of Form
Acknowledgements
This project is funded by Åbo Akademi University (February 2022-April 2025) and the Runar Bäckström foundation (project number 20220161). This work acknowledges contributions from Staffan Dahlström with spectrophotometry, Alf Hermanson in the experimental setup. and Linus Silvander for SEM measurements.
References
[1] R. Zevenhoven and M. Fält. "Radiative cooling through the atmospheric window: A third. less intrusive geoengineering approach." Energy. vol. 152. pp. 27-33. 2018. doi: 10.1016/j.energy.2018.03.084. View Article
[2] M. Fält. The utilization of participating gases and longwave thermal radiation in a passive cooling skylight-. PhD thesis. Åbo Akademi University, Turku. Finland. 2016. View Article
[3] A. Bendavid and P. J. Martin. "Review of thin films materials deposition by the filtered cathodic vacuum arc process at CSIRO." 2014. [Online]. Available: www.austceram.com/ACS-Journal View Article
[4] Z. M. Cheng. Y. Shuai. D. Y. Gong. F. Q. Wang. H. X. Liang. and G. Q. Li. "Optical properties and cooling performance analyses of single-layer radiative cooling coating with mixture of TiO2 particles and SiO2 particles." Sci China Technol Sci. vol. 64. no. 5. pp. 1017-1029. 2021. doi: 10.1007/s11431-020-1586-9. View Article
[5] G. Gangisetty and R. Zevenhoven. "A Review of Nanoparticle Material Coatings in Passive Radiative Cooling Systems Including Skylights." Energies. vol. 16. no. 4, 2023. doi: 10.3390/en16041975. View Article
[6] D. Kaminski. M. Jensen "Introduction to Thermal and Fluids Engineering". Wiley (2005). Chapter 14.
[7] G. Gangisetty and R. Zevenhoven. "Selection of nano-particulate material for improved passive cooling skylight performance. in Proceedings of ECOS 2022 - 35th International Conference on Efficiency. Cost. Optimization. Simulation and Environmental Impact of Energy Systems. July 4-7. 2022. Copenhagen. Denmark pp. 1211- 1222.
[8] J. Peoples. X. Li. Y. Lv. J. Qiu. Z. Huang. and X. Ruan. "A strategy of hierarchical particle sizes in nanoparticle composite for enhancing solar reflection." International journal of heat and mass transfer. vol. 131, pp.487-494,2019. doi.org/10.1016/j.ijheatmasstransfer.2018.11.059 View Article
[9] Report by: California building standards commission. ''California Green Building Standards Code. California Code of Regulations. Title 24. Part 11'' 2016.
[10] S. Thyageswaran. "Radiation View Factor from Rectangular Plate to Coaxial Disk: A Model Correlation." Heat Transfer Engineering''. vol. 41. no. 11. pp.1002-1009. 2020. doi.org/10.1080/01457632.2019.1589995. View Article