Journal of Fluid Flow, Heat and Mass Transfer (JFFHMT)
ISSN: 2368-6111

Volume 12 - Year 2025 - Pages 110-118
DOI: 10.11159/jffhmt.2025.012
Design of a Compact Miniature In-Pipe Turbine for Efficient Energy Recovery in Constrained Environment
Tsai, Meng-Hsun1, Tsen Shi-Chang1
1Department of Mechanical Engineering, National Yunlin University of Science and Technology
123 University Road, Section 3, Douliou, Yunlin 64002, Taiwan, R.O.C.
tsaimh@yuntech.edu.tw; tsengsc@yuntech.edu.tw
Abstract - This study presents an innovative miniature in-pipe turbine designed for installation within a cooling water pipeline to efficiently convert fluid kinetic energy into mechanical power for driving a generator, thereby enabling energy recovery. The research begins by selecting a high-efficiency airfoil from the NACA database, optimized for the given experimental conditions. A three-dimensional model is then developed using CAD software and analyzed through fluid-structure interaction (FSI) simulations in CAE software to assess the effects of design parameters on performance. Finally, a prototype is fabricated via 3D printing and experimentally validated, confirming the optimal parameter combination and demonstrating the practical feasibility of the proposed system in energy recovery applications.
Keywords: Miniature In-Pipe Turbine, Energy Recovery, Fluid Dynamics, CFD Simulation, Constrained Environment.
© Copyright 2025 Authors - This is an Open Access article published under the Creative Commons Attribution License terms Creative Commons Attribution License terms. Unrestricted use, distribution, and reproduction in any medium are permitted, provided the original work is properly cited.
Date Received: 2025-03-14
Date Revised: 2025-03-27
Date Accepted: 2025-04-01
Date Published: 2025-04-07
1. Introduction
This study, conducted in collaboration with a technology company within a science and technology industrial park, focuses on designing a miniature power generation mechanism for a 50-mm cooling water pipeline that connects a rooftop cooling tower to a ground-floor pump, utilizing a 4.5-meter height difference. The system operates continuously year-round, ensuring a stable cooling water flow for consistent energy conversion.
While large-scale fluid energy harvesters are well-established in the green energy sector, the miniaturization of such systems for constrained environments—such as pipelines—poses efficiency challenges due to changes in geometric and flow characteristics. This study aims to address these challenges by optimizing the design of the miniature in-pipe turbine, enhancing its efficiency and demonstrating its feasibility for energy recovery in restricted spaces.
2. Methodology
This study integrates fluid dynamics and structural mechanics principles to develop a miniature in-pipe turbine system, focusing on three key aspects:
- Optimizing the diversion tube's inner wall geometry to enhance fluid kinetic energy utilization.
- Refining the shroud design to improve flow distribution and minimize energy losses.
- Modifying the rotor blade geometry to maximize the efficiency of kinetic-to-mechanical energy conversion.
2.1 Inner Wall Shape of the Diversion Tube
The power output of the turbine blades is determined using the momentum theorem and the fluid energy equation, expressed as follows [1]:
Here, x1 and x2 represent the starting and ending positions of the turbine blades, respectively, while Cp(x) denoting the power coefficient distributed along the blade surface. According to Equation (1), even slight variations in the flow velocity V(x) can significantly impact energy output W, highlighting the necessity of optimizing velocity profiles to enhance turbine efficiency.
Additionally, the continuity equation in fluid dynamics establishes that V(x) varies with changes in the cross-sectional area A(x) of the diversion tube under a constant flow rate ![]() , expressed as:
, expressed as:

Where ρ(x) is the fluid density at position x, A(x) is the cross-sectional area, and V(x) is the corresponding velocity [2]. This study focuses on optimizing the diversion tube’s inner wall geometry based on Equation (2) to maximize energy recovery efficiency.
2.2 Shroud Design
The geometric configuration of the shroud plays a crucial role in guiding and stabilizing fluid flow within the miniature in-pipe turbine system. An optimized shroud minimizes turbulence and energy dissipation, thereby enhancing system performance. The influence of shroud geometry on fluid velocity and turbulence characteristics can be quantified using the Reynolds number (Re):
Where ρ(x) is the fluid density, V(x) is the fluid velocity, μ(x) is the dynamic viscosity, and L(x) is the characteristic length scale. Equation (3) provides a mathematical foundation for analyzing flow behavior, particularly in turbulent regions.
The turbulence distribution and intensity were analyzed using the k-ε turbulence model[3][4].Computational Fluid Dynamics (CFD) simulations were performed to generate pressure and velocity fields, enabling a comprehensive evaluation of the shroud’s impact on overall system performance [5].
2.3 Rotor Blade Design
The geometry of the rotor blade plays a crucial role in converting fluid pressure differentials into mechanical energy. Its performance is primarily influenced by the pressure difference between the front and back surfaces of the blade, expressed as [6][7] :
Where S represents the blade surface area, Pfront (x,y) and Pback (x,y) denote the pressure distributions on the respective surfaces, and dA represents the differential surface area element.
Pressure field plots are essential tools in CFD simulations, visually illustrating the fluid-rotor blade interaction and highlighting the influence of blade geometry on aerodynamic performance.
Blade deformation under fluid pressure alters the pressure distribution and lift performance, quantified as follows[8]:
Where δ(x) is the deformation at position x, E is the Young's modulus, M(x') is the bending moment, and I(x') is the second moment of area.
Deformation-induced pressure distribution changes further impact ∆P and lift performance. The corrected pressure difference is given by [9][10]:

Where k is a coefficient representing deformation effects on pressure distribution.
3. Mechanism Design
The optimal aerodynamic profile, tailored to the experimental conditions, was selected from the NACA database. The diversion tube, shroud, and rotor blades were designed using NX software and subsequently imported into ANSYS CFD for simulation. Finally, a physical prototype was fabricated via 3D printing to validate the optimized design.
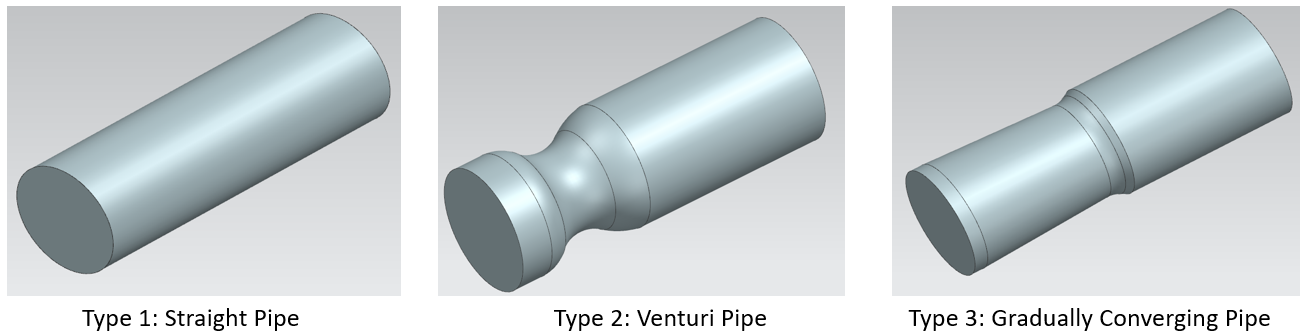
3.1 Design of the Inner Wall Geometry of the Diversion Tube
To optimize velocity profiles and minimize vortex interference, three inner wall geometries were designed: straight, Venturi, and gradually contracting. Based on Equation (2), adjusting the cross-sectional area helps stabilize blade force distribution and enhance power generation efficiency.
The digital models of these designs are presented in Figure 1, and their performance was evaluated using CFD simulations to identify the optimal configuration.
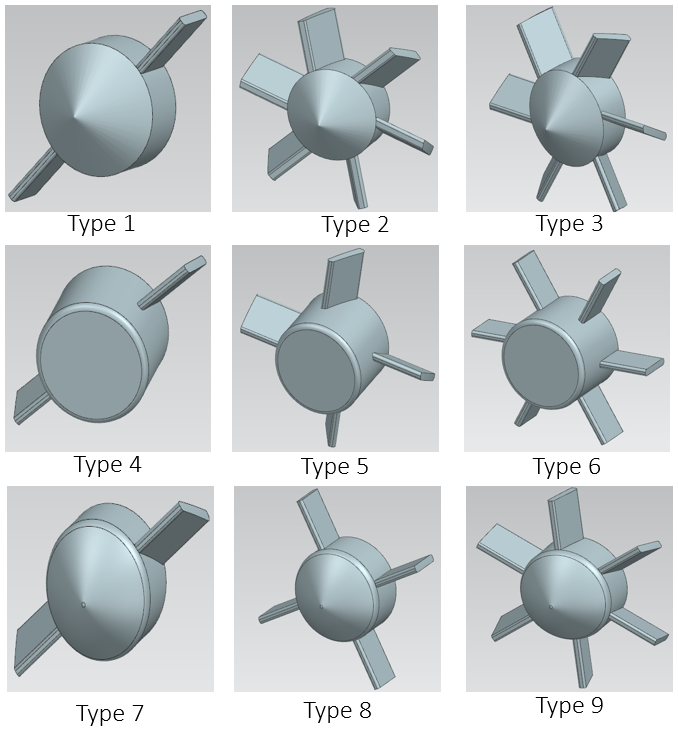
3.2Design of the Shroud Geometry
The shroud geometry was optimized to enhance flow stability and energy conversion efficiency. Table 1 summarizes the key design parameters.
Table 1. Design Parameters of the Shroud Geometry
|
Factor |
Description |
Leve1 |
Leve2 |
Leve3 |
|
A |
Shroud leading cone angle (°) |
108 |
90 |
Rounded |
|
B |
Number of guide vanes |
2 |
4 |
6 |
|
C |
Shroud guide vane angle of attack (°) |
0 |
15 |
30 |
Nine CAD models were developed, as shown in Figure 2. CFD simulations were conducted to analyze pressure and velocity fields, identifying the optimal design based on velocity distribution uniformity and minimized turbulence.
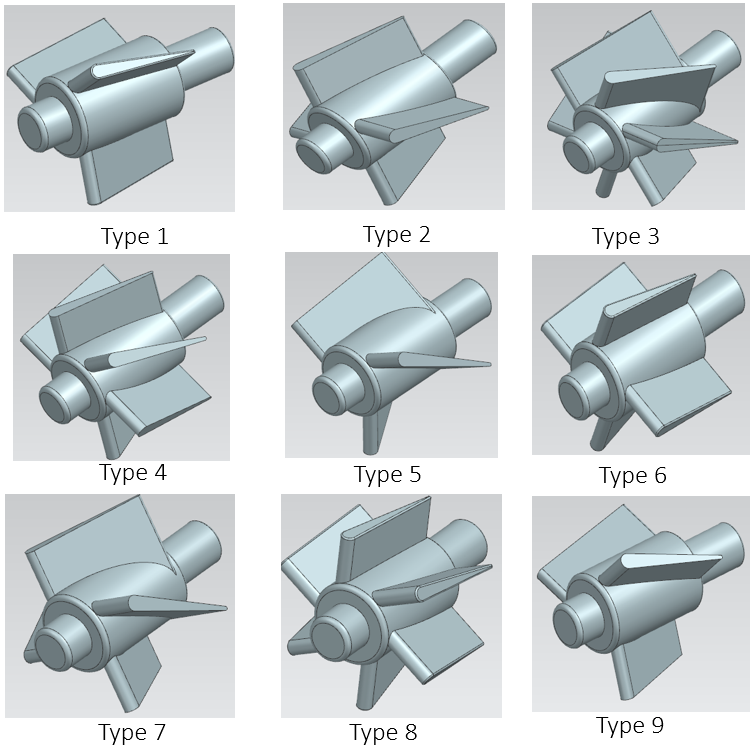
3.3 Design of the Rotor Blade Geometry
The rotor blades were designed to maximize kinetic energy conversion. Key parameters (Table 2) were varied to evaluate their effects on performance. CFD simulations were conducted to assess lift force and efficiency based on Equation (4), while deformation effects were analyzed based on Equations (5) and (6).
Table 2. Design Parameters of Rotor Blade Geometry
|
Factor |
Description |
Leve1 |
Leve2 |
Leve3 |
|
A |
blade angle of attack (°) |
20 |
30 |
45 |
|
B |
Number of rotor blades |
3 |
4 |
6 |
Nine configurations were developed, as shown in Figure 3, and the optimal design was identified through a comprehensive performance analysis.
4. CFD Simulation
This study employed the Taguchi method [12] to systematically design experimental parameters. An ![]() orthogonal array was utilized for parameter optimization, as detailed in Table 3.
orthogonal array was utilized for parameter optimization, as detailed in Table 3.
Table 3. ![]() Orthogonal for Experimental Design
Orthogonal for Experimental Design
|
|
A |
B |
C |
D |
|
1 |
1 |
1 |
1 |
1 |
|
2 |
1 |
2 |
2 |
2 |
|
3 |
1 |
3 |
3 |
3 |
|
4 |
2 |
1 |
2 |
3 |
|
5 |
2 |
2 |
3 |
1 |
|
6 |
2 |
3 |
1 |
2 |
|
7 |
3 |
1 |
3 |
2 |
|
8 |
3 |
2 |
1 |
3 |
|
9 |
3 |
3 |
2 |
1 |
4. 1 CFD Simulation Parameter Setup
The experimental setup was designed for installation 3 meters below the rooftop. Using Bernoulli’s Equation (9), the inlet velocity of the cooling water was calculated as 7.67 m⁄s. The Reynolds number was determined using Equation (3) to be approximately Re≈383,500, indicating a turbulent flow regime.
CFD simulations were configured with the following parameters: an incompressible flow model, k-ε turbulence model, outflow boundary conditions, and no-slip conditions on rotor blade surfaces.
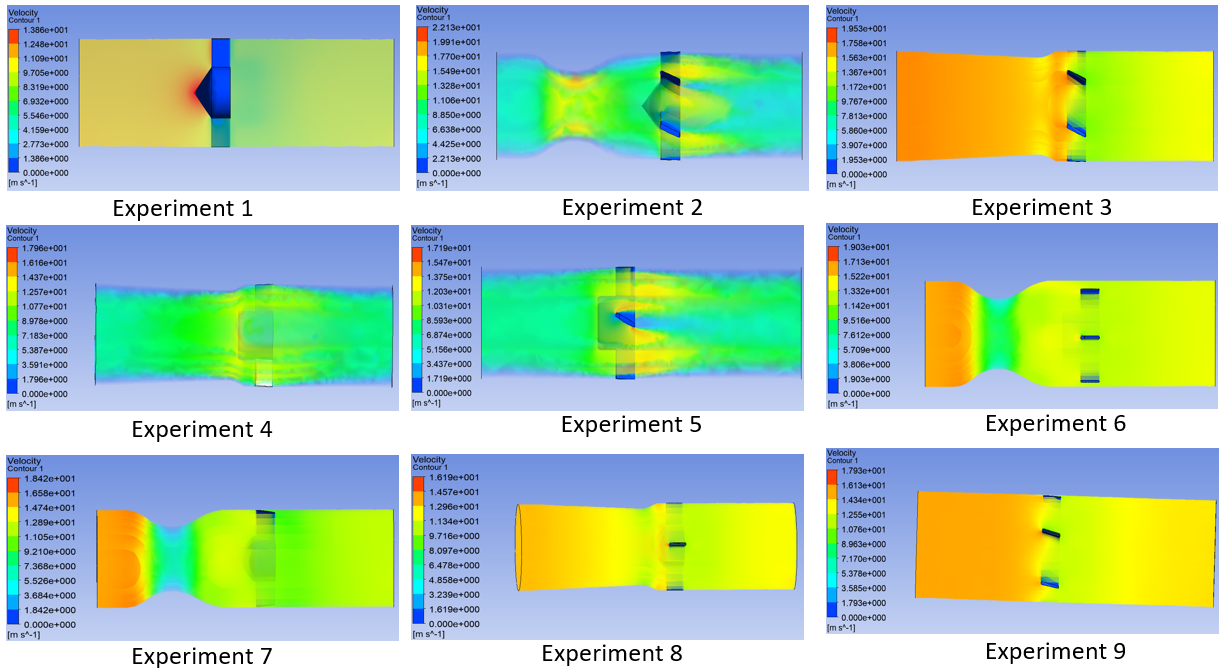
4. 2 Flow Field Analysis of Diversion Tube and Shroud
This section employs CFD simulations and the Taguchi method to analyze the flow characteristics of the diversion tube geometries presented in Section 3.1 and the shroud parameters outlined in Section 3.2. The control factors and levels for the analysis are shown in Table 4. Utilizing the Taguchi orthogonal array, nine simulations were conducted to evaluate flow velocity, pressure fields, and stress deformation of the shroud, aiming to determine the optimal design.
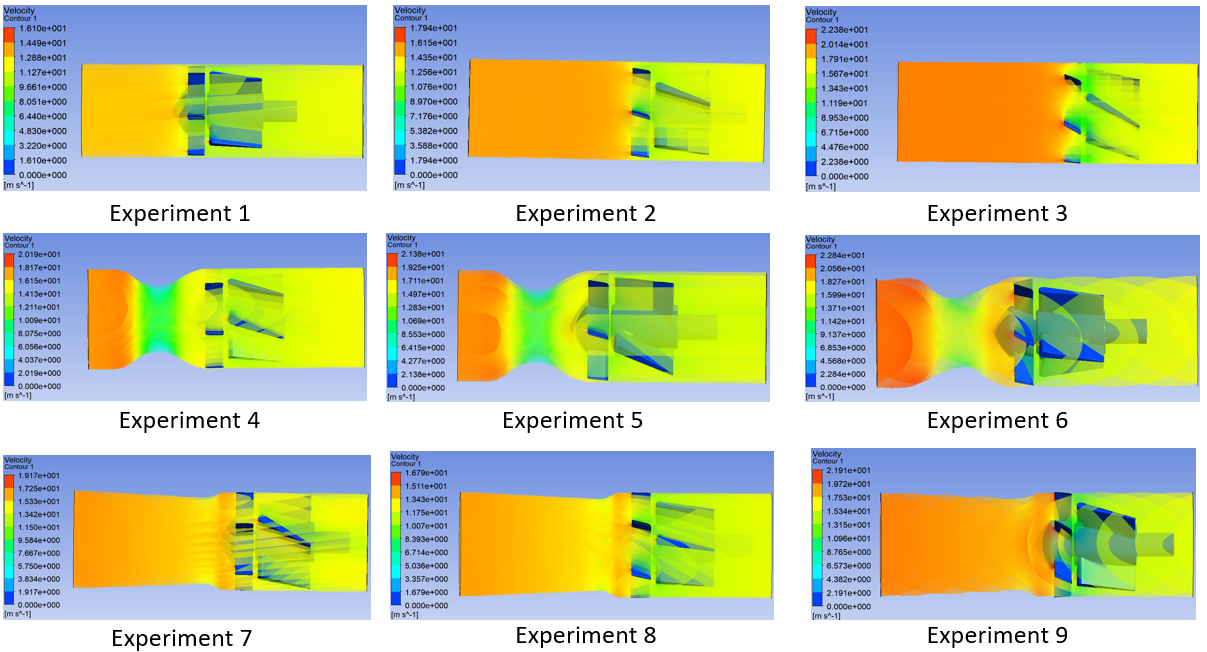
Analysis of Figure 4 reveals that while Type 1 diversion tubes maintain stable flow fields, they do not significantly enhance fluid kinetic energy. In contrast, Type 2 diversion tubes generate high-vortex regions near the midstream constriction, increasing structural stress while substantially boosting water velocity due to pressure differentials. Meanwhile, Type 3 diversion tubes effectively reduce localized vortex formation but achieve less velocity enhancement compared to Type 2.
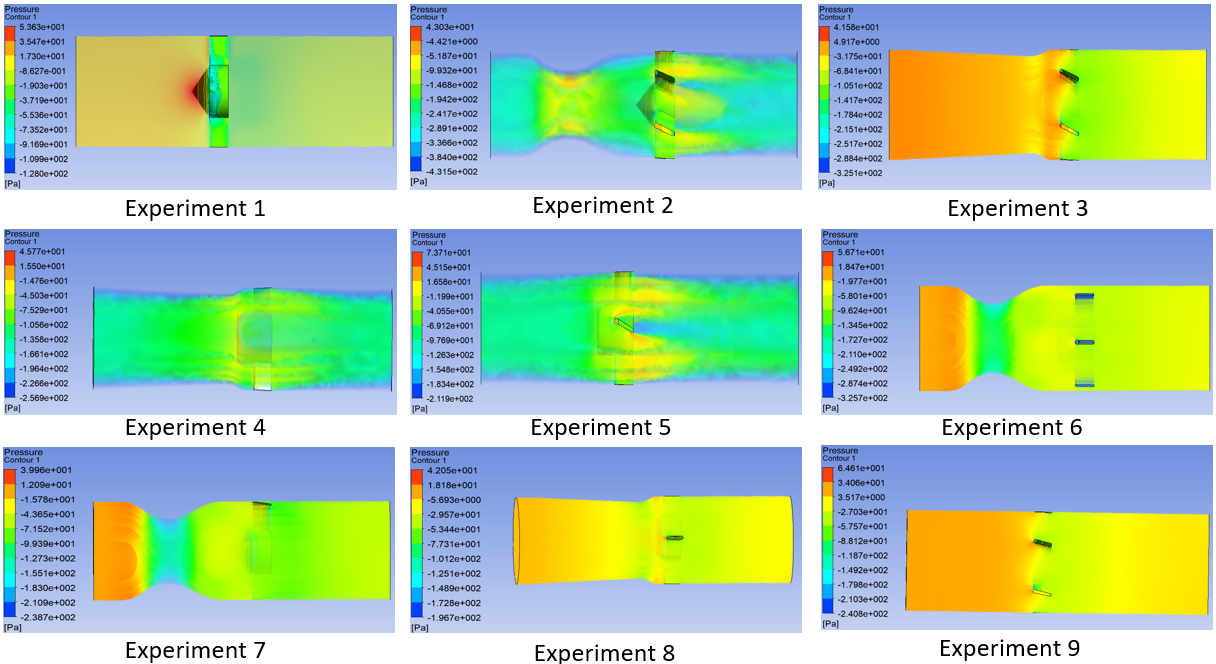
Figure 5 illustrates the pressure fields at the rear of the shroud. Experiments 2, 4, and 5 exhibit substantial pressure differentials, whereas Experiments 7, 8, and 9 achieve more uniform pressure distributions. The results indicate that a rounded windward cone angle minimizes vortex effects and stabilizes flow.
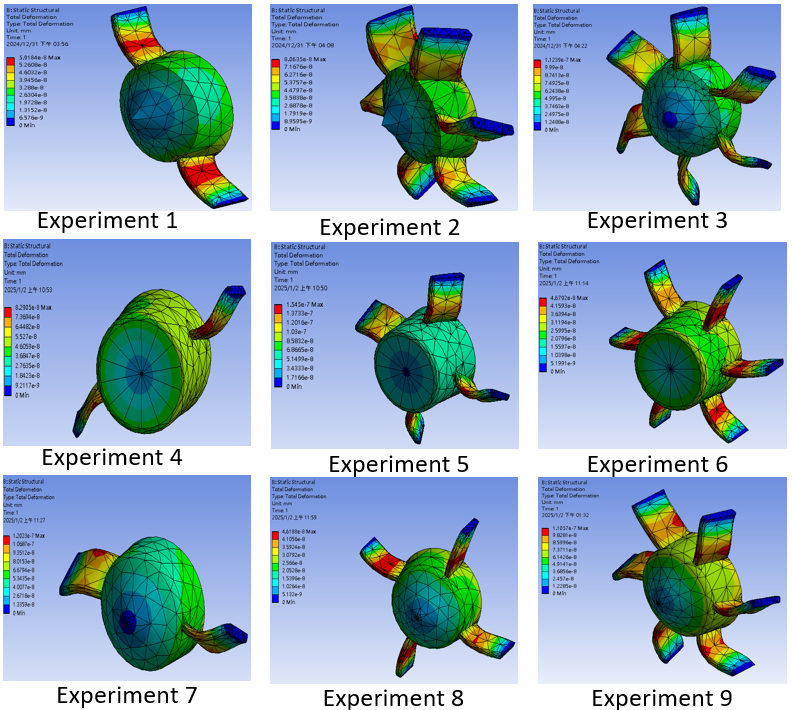
Figure 6 presents the shroud's stress deformation analysis. Among the designs with identical windward cone angles, the shroud with six guide vanes demonstrates the least deformation, with Experiment 9 exhibiting the best overall performance.
Considering the comprehensive analysis of Figures 4, 5, and 6, the Type 9 shroud model (Figure 2) has been identified as the optimal design for subsequent experiments due to its superior performance in enhancing flow stability, achieving uniform pressure distribution, and minimizing structural deformation under operating conditions.
Table 4. Control Factors and Levels for Flow Field Simulation of the Diversion Tube and Shroud
|
Factor |
Description |
Leve1 |
Leve2 |
Leve3 |
|
A |
The windward cone angle of the shroud (°) |
108 |
90 |
Rounded |
|
B |
Number of guide vanes |
2 |
4 |
6 |
|
C |
Windward angle of guide vanes (°) |
0 |
15 |
30 |
|
D |
Inner wall geometry of diversion tube |
Type1 |
Type2 |
Type3 |
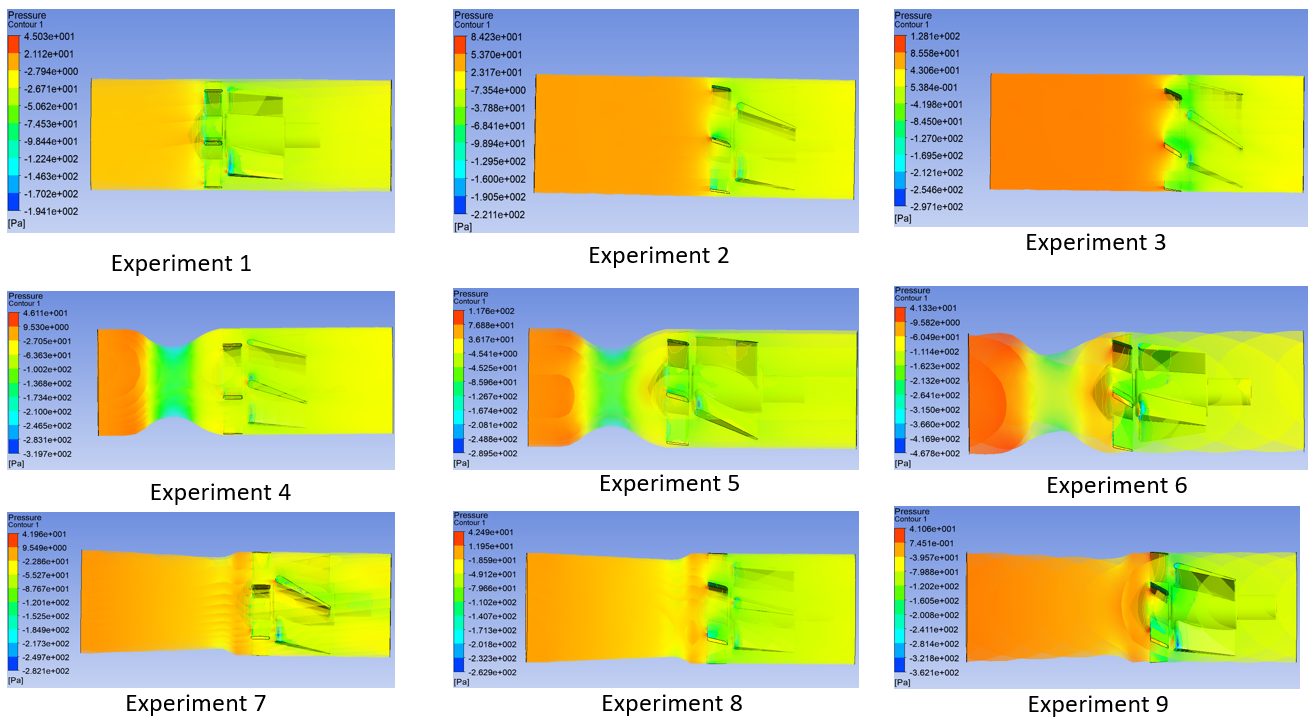
4. 3 Flow Field Analysis of the Miniature In-Pipe Turbine System
Building on the findings from Section 4.2, the Type 9 shroud was selected, and three different diversion vane inlet angles were designed to further analyze the flow field and optimize the geometry, as illustrated in Figure 7. Table 5 outlines the simulation control factors and levels. The Taguchi orthogonal array, a robust experimental design method, was employed to efficiently conduct nine simulation experiments.
Figures 8 and 9 show that Experiments 4 and 7 exhibited superior performance, characterized by stable flow fields and high energy conversion efficiency. In contrast, Experiments 3 and 6 suffered from unstable flow fields due to interactions between high inlet angles and rotor blade geometries, while Experiments 1 and 2 exhibited insufficient pressure differentials. Although Experiments 5 and 8 demonstrated notable diversion effects, turbulence in the wake region compromised flow stability. Experiment 9, with the lowest pressure differential and efficiency, resulted in significant energy losses. Considering both energy conversion efficiency and flow stability, Experiments 4 and 7 emerged as the optimal configurations.
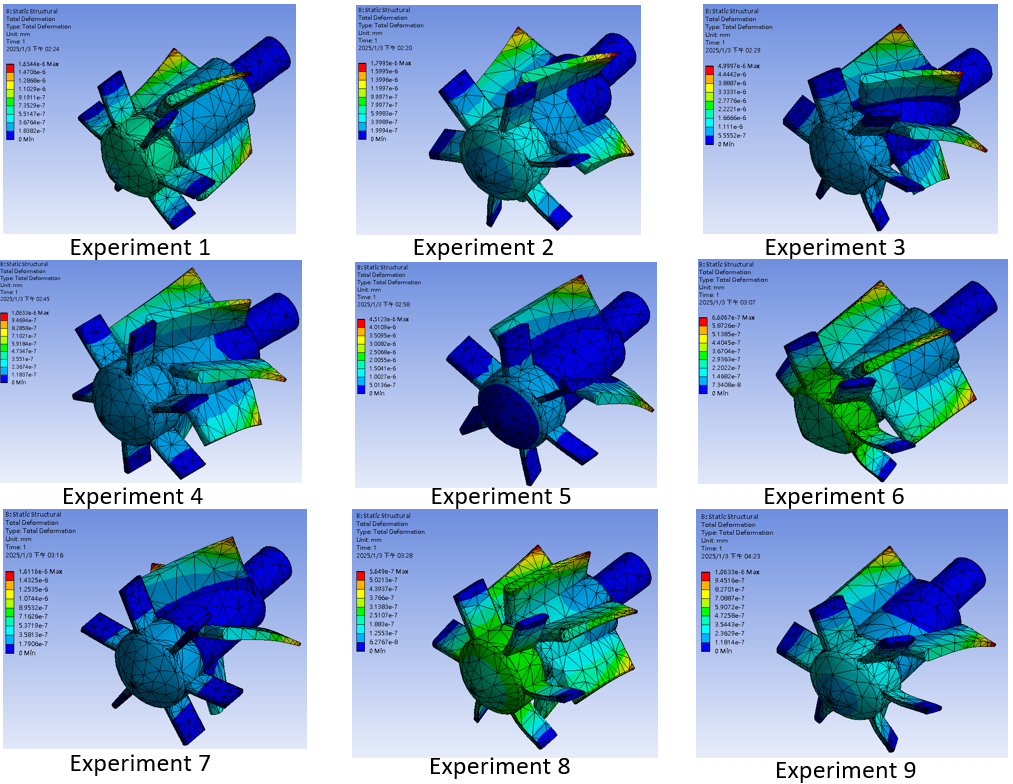
As shown in Figure 10, structural deformation was primarily influenced by hydrodynamic loads, inlet angles, blade count, and geometric configurations. Designs with higher blade count and smaller inlet angles effectively dispersed pressure, thereby reducing structural deformation. Experiments 1 and 4 exhibited the least deformation, making them suitable for high-stability applications. Conversely, designs with larger inlet angles, such as Experiments 5, 9, and 3, experienced significant deformation due to concentrated pressure on fewer blades. Experiment 9 exhibited the highest deformation due to its 30° inlet angle and low blade count.
Overall, Experiment 4 demonstrated superior stability and efficiency, with Experiments 1 and 8 as secondary recommendations for high-stability applications. The detailed analyses in Figures 8, 9, and 10 provide comprehensive insights into the velocity field, pressure field, and structural deformation, supporting the selection of Experiment 4 as the optimal design configuration.
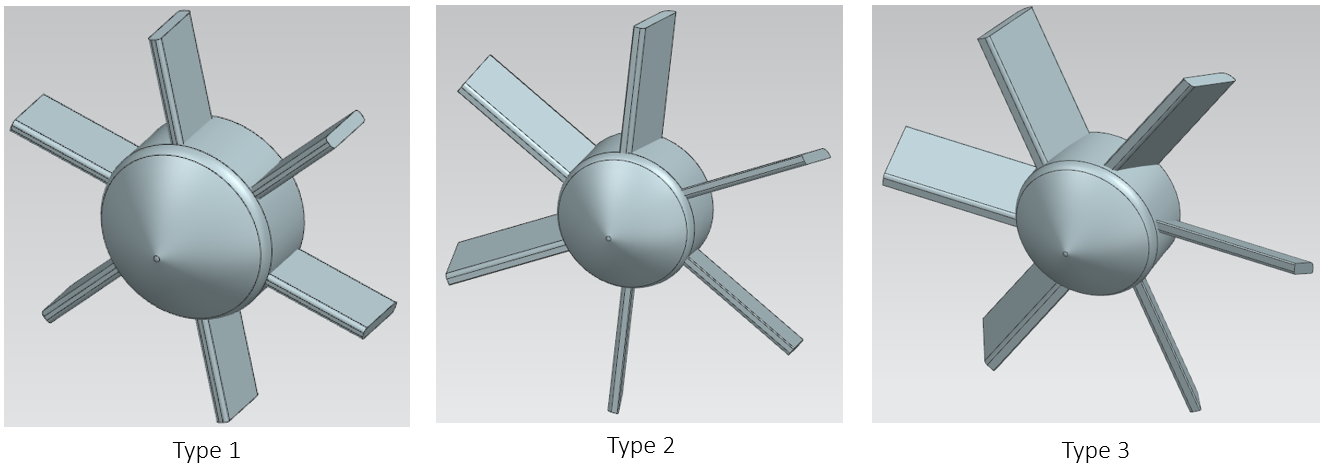
Table 5. Control Factors and Levels for Flow Field Simulation of the Miniature In-Pipe Turbine System
|
Factor |
Description |
Leve1 |
Leve2 |
Leve3 |
|
A |
Inner wall geometry of the diversion tube |
Type1 |
Type2 |
Type3 |
|
B |
Shroud configuration |
Type1 |
Type2 |
Type3 |
|
C |
Inlet angle of the diversion vane (°) |
20 |
30 |
45 |
|
D |
Number of rotor blades |
3 |
4 |
6 |
5. Experimental Methods
Based on the design plan outlined in Table 5, this study utilized 3D printing technology to fabricate physical prototypes, enhancing efficiency and reducing experimental cycles, as shown in Figures 11 to 13. Wind tunnel tests were conducted using high-velocity airflow as a substitute for cooling water simulations. The wind tunnel setup (Figure 14) was used to validate the accuracy of CFD simulation results and assess the feasibility of the newly designed structure, providing a technical foundation for future commercialization.
The miniature in-pipe turbine system was connected to an 80 W bullet-type exhaust fan on its right side to generate high-speed airflow, simulating the flow characteristics of cooling water pipelines in industrial facilities. During the experiment, a pressure gauge and anemometer were used to measure the inlet pressure and airflow velocity. The left side of the turbine system was connected to a generator and a data acquisition system to facilitate performance testing and data analysis. This testing methodology evaluated the dynamic performance and stability of the new system under practical operating conditions, providing a reliable basis for system optimization and engineering applications.
The experimental procedure was as follows: After activating the bullet-type exhaust fan, the inlet pressure and airflow velocity were gradually increased. Once the pressure gauge and anemometer readings stabilized, measurements were recorded at the 1st, 3rd, 5th, 7th, 9th, 11th, and 15th seconds. These values served as the basis for testing. Each experiment was repeated three times to ensure data reliability, and the average power generation at the specified time points was calculated. The experimental results, summarized in Table 6, demonstrate the system's stability and power generation performance over various time intervals, providing a reference for subsequent optimization and practical applications.
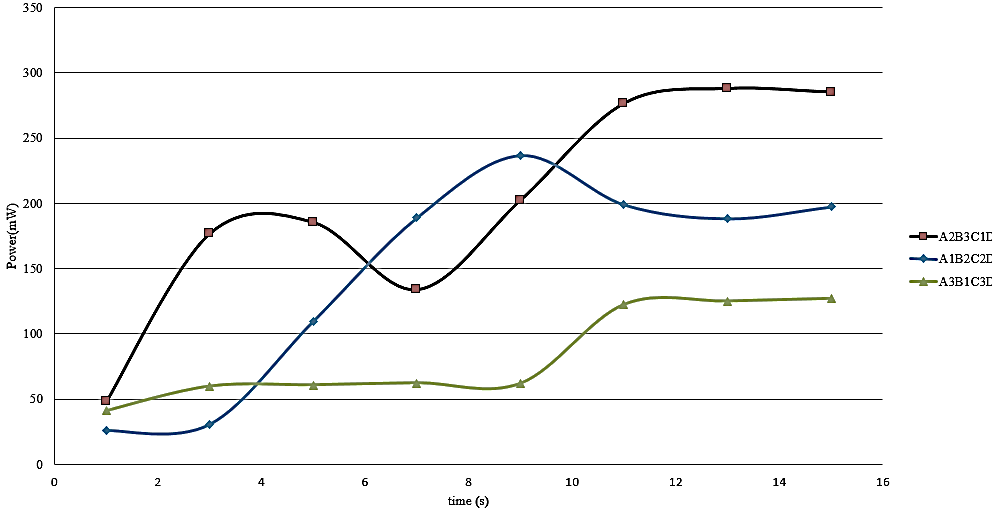
The Taguchi method [12] was employed to calculate the mean values, standard deviations, and signal-to-noise (S/N) ratios of the experimental data for each group. The results are compiled in Table 7. The factor response graph of the S/N ratio, derived from Table 7, is presented in Figure 15. The analysis identified the optimal parameter combination as A2B3C1D1, followed by A1B2C2D2 and A3B1C3D3.
To further verify the reliability and accuracy of these results, experimental tests were conducted for these three parameter combinations. The test results, as shown in Figure 16, revealed that the optimal parameter combination exhibited superior performance and stability compared to other configurations, confirming the effectiveness and applicability of the Taguchi method in parameter optimization.
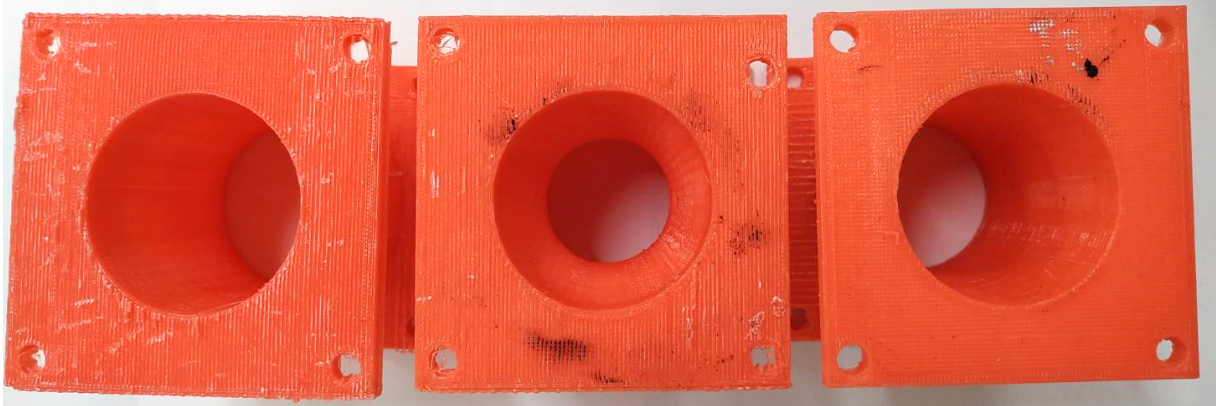
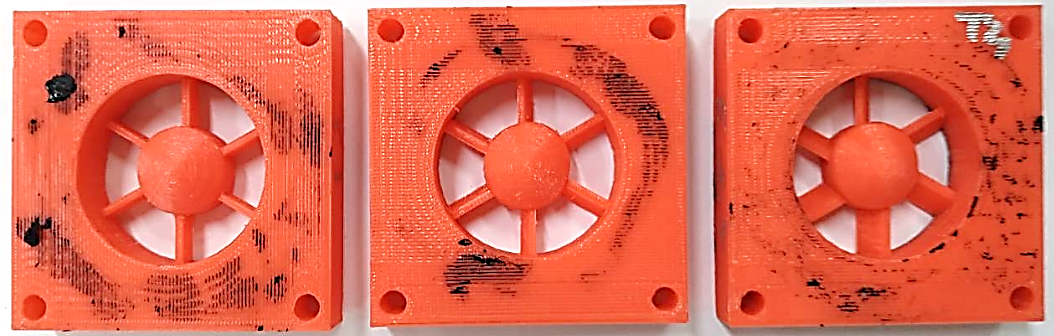
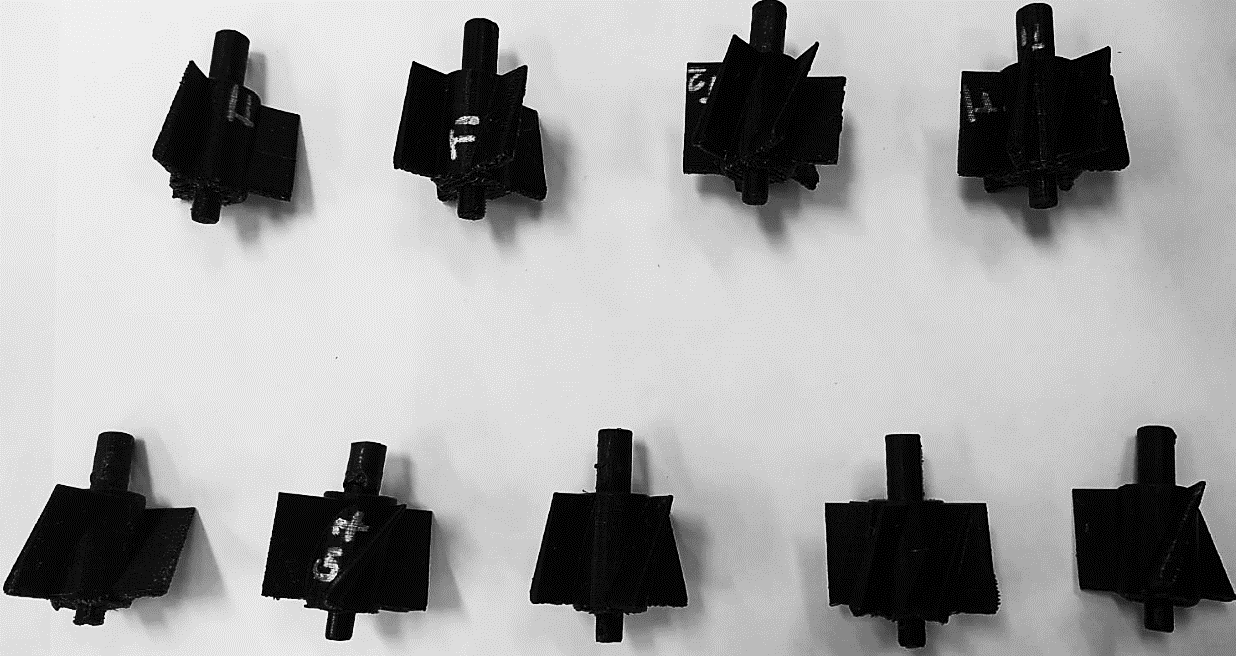
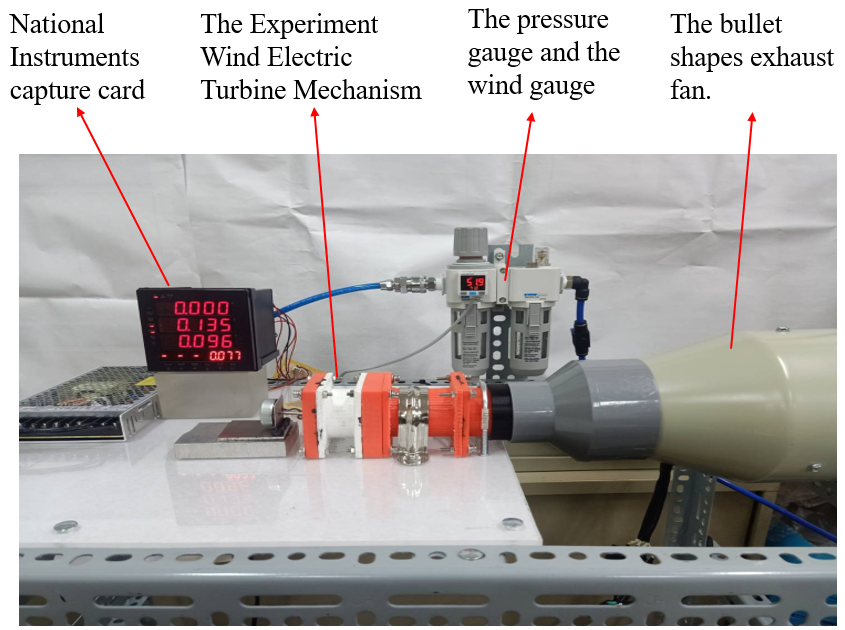
Table 6. Experimental Data for Power Generation Performance
|
EXP. |
T1 |
T3 |
T5 |
T7 |
T9 |
T11 |
T13 |
T15 |
|
1 |
3.26 |
3.79 |
4.53 |
4.69 |
4.89 |
5.38 |
5.49 |
4.86 |
|
2 |
15.76 |
31.52 |
38.90 |
40.16 |
42.64 |
45.17 |
45.87 |
46.28 |
|
3 |
48.00 |
58.91 |
61.72 |
66.82 |
67.47 |
69.16 |
71.98 |
71.26 |
|
4 |
40.88 |
59.71 |
60.69 |
62.21 |
61.88 |
61.20 |
62.46 |
63.48 |
|
5 |
6.88 |
7.22 |
7.36 |
7.57 |
7.00 |
5.91 |
4.27 |
3.51 |
|
6 |
8.17 |
10.67 |
12.50 |
12.14 |
12.55 |
14.80 |
13.99 |
11.69 |
|
7 |
25.80 |
30.67 |
54.90 |
63.03 |
59.20 |
66.30 |
62.75 |
65.77 |
|
8 |
18.95 |
25.78 |
42.89 |
54.90 |
57.66 |
55.19 |
52.63 |
52.15 |
|
9 |
2.16 |
2.67 |
3.53 |
3.96 |
4.33 |
5.38 |
4.99 |
4.86 |
Remarks: T1 in the Table means the first second, T3 means the third second, T5 means the fifth second, and so on.
Table 7. Analysis of Experimental Data (S/N Ratios).
|
Experiment Group |
T1 |
|
T3 |
T5 |
T7 |
T9 |
T11 |
T13 |
T15 |
Average |
Standard Deviation |
S/N Ratio |
|
1 |
3.26 |
|
3.79 |
4.53 |
4.69 |
4.89 |
5.38 |
5.49 |
4.86 |
4.10 |
1.69 |
-12.94 |
|
2 |
15.76 |
|
31.52 |
38.90 |
40.16 |
42.64 |
45.17 |
45.87 |
46.28 |
34.03 |
16.00 |
-31.51 |
|
3 |
48.00 |
|
58.91 |
61.72 |
66.82 |
67.47 |
69.16 |
71.98 |
71.26 |
57.26 |
22.74 |
-35.79 |
|
4 |
40.88 |
|
59.71 |
60.69 |
62.21 |
61.88 |
61.20 |
62.46 |
63.48 |
52.50 |
20.88 |
-35.04 |
|
5 |
6.88 |
|
7.22 |
7.36 |
7.57 |
7.00 |
5.91 |
4.27 |
3.51 |
5.52 |
2.52 |
-15.66 |
|
6 |
8.17 |
|
10.67 |
12.50 |
12.14 |
12.55 |
14.80 |
13.99 |
11.69 |
10.72 |
4.45 |
-21.29 |
|
7 |
25.80 |
|
30.67 |
54.90 |
63.03 |
59.20 |
66.30 |
62.75 |
65.77 |
47.60 |
23.35 |
-34.49 |
|
8 |
18.95 |
|
25.78 |
42.89 |
54.90 |
57.66 |
55.19 |
52.63 |
52.15 |
40.02 |
20.39 |
-33.05 |
|
9 |
2.16 |
|
2.67 |
3.53 |
3.96 |
4.33 |
5.38 |
4.99 |
4.86 |
3.54 |
1.70 |
-11.89 |
6. Conclusion
This study developed a miniature in-pipe turbine system designed for energy recovery in constrained environments, particularly within industrial cooling water pipelines. The proposed design integrates a diversion tube, shroud, and optimized rotor blade geometry to enhance flow field stability and energy conversion efficiency.
Additionally, this study identifies key factors influencing performance, including flow field characteristics, material selection, and structural integrity, which are critical for achieving optimal efficiency and long-term durability in real-world applications.
- Discrepancy Between CFD Simulation and Experimental Results: As analyzed in Section 4.3, CFD simulations identified the optimal parameters as a shroud angle of 0°, a rotor blade angle of 20°, and six rotor blades, resulting in stable pressure distribution and high energy conversion efficiency. However, experimental results determined a different optimal configuration: a shroud angle of 30°, a rotor blade angle of 10°, and three rotor blades, indicating a stronger influence of turbulence on the flow field under real-world conditions. This discrepancy stems from idealized assumptions in CFD simulations, which do not fully account for turbulence effects and flow irregularities. Future design refinements should integrate these factors to improve predictive accuracy and practical feasibility.
- Flow Field Stability, Environmental Factors, and Geometric Optimization: While CFD simulations assume stable boundary conditions, experimental results demonstrated that increasing the shroud angle to 30° and reducing the blade count to three effectively mitigated tail flow turbulence, significantly improving real-world performance. Additionally, the diversion tube geometry plays a crucial role in controlling the flow field, influencing dynamic stability and energy dissipation. These findings underscore the necessity of incorporating environmental factors and geometric optimization to develop a turbine system that performs reliably across varying operating conditions.
- Material Selection and Structural Considerations: CFD simulations do not account for material surface roughness and micro-geometric deviations, both of which influence real-world performance. Experimental results obtained from 3D-printed plastic models provided valuable insights, but their limited structural rigidity highlights the need for higher-strength materials. Steel components can reduce deformation under fluid forces, minimize efficiency losses, and enhance system durability, making them more suitable for commercial applications. Additionally, the lower surface roughness of metallic materials improves flow distribution, further enhancing efficiency and operational stability.
- Impact on Future Turbine Design and System Integration: The findings of this study provide insights into future turbine design, demonstrating how compact and modular systems can be integrated into existing fluid transport infrastructures with minimal modifications. One potential application is in industrial cooling systems, where the turbine could be installed within bypass loops or heat exchanger return lines to recover residual pressure energy without disrupting primary operations. Additionally, integrating the turbine with smart control systems could enable real-time optimization based on flow rate variations, maximizing energy recovery efficiency.
By addressing the challenges of flow field instability, material durability, and space constraints, this study establishes a foundation for the further development of high-efficiency, miniature in-pipe turbines. Future research should focus on integrating CFD and experimental data for enhanced parameter optimization, advancing turbine material selection, and developing adaptive control strategies to further improve overall performance and commercial viability.
7.Future Applications and Comparative Analysis
The proposed miniature in-pipe turbine provides a cost-effective and adaptable alternative to traditional pressure recovery turbines (PRTs) and micro-hydro systems, offering a balance between efficiency, ease of installation, and maintenance. While regenerative pressure exchangers and large-scale PRTs can achieve higher energy conversion efficiencies, their adoption requires extensive system modifications and higher operational costs, making them less suitable for retrofitting into existing infrastructure. In contrast, the proposed miniature turbine is optimized for spatially constrained environments, where conventional energy recovery technologies may not be technically or economically viable.
Due to its compact structure and minimal installation requirements, the proposed turbine can be seamlessly integrated into various fluid transport systems, particularly in applications where space efficiency and operational flexibility are critical. Potential applications include:
- Industrial Cooling Systems – Implementation in return flow lines of cooling towers and condensers to recover residual pressure energy, thereby enhancing overall system efficiency and reducing pressure dissipation.
- HVAC and Building Systems – Integration into chilled water loops of large commercial and industrial buildings to improve energy efficiency and lower operational costs.
- Municipal and Agricultural Water Systems – Deployment in low-pressure irrigation pipelines and urban water distribution networks to facilitate localized energy recovery, reducing dependence on external power sources.
- Renewable Energy Hybridization – Potential coupling with solar or wind-powered water distribution systems to develop self-sustaining hybrid energy solutions, maximizing renewable energy utilization.
By addressing key challenges such as spatial constraints, ease of integration, and operational adaptability, this study establishes a foundation for future advancements in distributed energy recovery systems. Future research should focus on enhancing turbine materials for improved durability, conducting large-scale field testing under diverse operating conditions, and developing adaptive control strategies to optimize performance and facilitate commercialization.
References
[1] Manwell, J. F., McGowan, J. G., and Rogers, A. L., Wind Energy Explained: Theory, Design and Application, Wiley, 2002, pp. 133-134. . View Article
[2] Batchelor, G. K., An Introduction to Fluid Dynamics, Cambridge University Press, 1967.
[3] Batchelor, G. K., An Introduction to Fluid Dynamics, Cambridge University Press, 1967
[4] White, F. M., Fluid Mechanics, McGraw-Hill, 2011, pp. 101-104
[5] Launder, B.E., and Spalding, D.B., Lectures in Mathematical Models of Turbulence, Academic Press, 1972
[6] White, F. M., Fluid Mechanics, McGraw-Hill, 2011, pp. 145-149.
[7] Munson, B. R., Okiishi, T. H., Huebsch, W. W., and Rothmayer, A. P., Fundamentals of Fluid Mechanics, Wiley, 2013, pp. 227-230.
[8] Gere, J. M., and Timoshenko, S. P., Mechanics of Materials, Cengage Learning, 1999.
[9] White, F. M., Fluid Mechanics, McGraw-Hill, 2011.
[10] Munson, B. R., Okiishi, T. H., Huebsch, W. W., and Rothmayer, A. P., Fundamentals of Fluid Mechanics, Wiley, 2013, pp. 227-230.
[11] http://airfoiltools.com/search/
[12] Li, H.H., "Taguchi Methods: Principles and Practices of Quality Design," Gau Lih Book Co., Ltd, 2011.