Journal of Fluid Flow, Heat and Mass Transfer (JFFHMT)
ISSN: 2368-6111

Volume 12 - Year 2025 - Pages 39-53
DOI: 10.11159/jffhmt.2025.005
Effect of Heat Source Size and Orientation on the Thermal Performance of a Wire Mesh Vapor Chamber
Wee Jian Ng1,2, Jeff Punch1,2, Vanessa Egan1,2
1CONNECT, Stokes Laboratories, Bernal Institute, University of Limerick, Ireland
2School of Engineering, University of Limerick, Ireland
ng.weejian@ul.ie; jeff.punch@ul.ie; vanessa.egan@ul.ie
Abstract - In contemporary densified 5G base stations, different categories of electronic components (power devices, digital ICs) dissipate different levels of heat, inducing challenges in terms of thermal segregation and temperature differences between nominally identical transmission channels. In such cases, a vapor chamber that acts as a passive two-phase heat transfer device represents a potential solution by reducing the temperatures and formation of temperature gradients across the base station. This paper presents a method to accurately determine the thermal performance of a wire mesh-type vapor chamber (56 mm x 56 mm x 3 mm) for orientation angles ranging from 0° (horizontal) to 90° (vertical), and heat source sizes of 10 mm to 20 mm. In this method, an aluminium block is configured as a calorimeter that is in contact with the centre of the vapor chamber’s evaporator, providing input powers ranging from 3 W to 60 W. One-dimensional axial conduction is assumed to occur along the calorimeter, enabling the quantification of heat flow using local temperature measurements. The thermal performance of the vapor chamber is recorded in terms of thermal resistance, Rth, which is a standard metric to measure a material’s ability to resist heat flow. For this experiment, Rth is measured between the evaporator and condenser, as a function of the range of input power levels, for different vapor chamber orientation angles: 0°, 30°, 45° and 90°. Data are obtained for heat source sizes of 10 mm, 16 mm and 20 mm. In order to validate the performance of the vapor chamber, the same tests were carried out on a copper plate (56 mm x 56 mm x 3 mm). The results show that the vapor chamber is highly isothermal at all orientations, for all heat source-sizes. The overall Rth of the vapor chamber reaches its lowest and highest values at ~0.2 K/W and ~3.2 K/W, respectively, throughout the entire experiment. These results set a foundation for the deployment of vapor chambers in densified 5G base stations, providing a solution for effective thermal extraction and isothermalisation of the structures.
Keywords: Vapor chamber, thermal characterisation, heat spreading, isothermalisation, thermal segregation.
© Copyright 2025 Authors - This is an Open Access article published under the Creative Commons Attribution License terms Creative Commons Attribution License terms. Unrestricted use, distribution, and reproduction in any medium are permitted, provided the original work is properly cited.
Date Received: 2024-03-01
Date Revised: 2024-01-20
Date Accepted: 2024-01-30
Date Published: 2025-02-12
1. Introduction
Mobile internet usage has increased to 4.6 billion people (57% of the global population), with 32% of this population covered by fifth generation (5G) mobile networks at the end of 2022 [1]. However, the range of a 5G cell signal is ~100 times less than that of a fourth generation (4G) cell, leading to a demanding >50 MC/km2 (macro cells per kilometre squared) density for 5G infrastructure in comparison to ~4-8 MC/km2 for 4G. The upcoming sixth generation (6G) mobile networks are expected to have an even lower cell range relative to 5G. In this context, there is a clear need for more compact base stations for 5G and future networks [2-3]. Typically, a base station features electronic devices that comprise integrated circuits (ICs) with footprint areas of ~5-20 mm2. In particular, power amplifiers, which dissipate the highest heat flux, are typically of area ~10 mm x 10 mm [4]. A challenge that arises with these base station configurations is an uneven distribution of heat flux, which results in thermal segregation from local “hotspots” [5]. The thermal challenge is further escalated when circuit boards are placed in a vertical orientation to meet the form-factor and space-saving criteria of 5G base stations. As hot air rises, a bottom-to-top positive temperature gradient is introduced to the system, and devices located near the top of the base station are subjected to higher ambient temperatures.
To overcome this problem of non-isothermality, an integrated heat spreader (IHS) is commonly introduced to increase the effective surface area between the electronic devices and ambient. Although novel IHS materials are under development, copper (Cu) and aluminium (Al) are typically used as solid heat spreader materials due to their economical cost and high thermal conductivity, k. Prior work has shown that there is a threshold in the scale of heat spreaders above which solid materials such as Cu and Al (k ~102 W/m.K) should be replaced with Vapor Chambers (VCs), as shown in Figure 1, a planar two-phase heat transfer devices with very high effective thermal conductivity (keff > 103 W/m.K) [6-9]. For a heat source of area 10 mm x 10 mm, thermal network modelling [10] has shown that VCs progressively outperform Cu as spreader areas exceed 20 mm x 20 mm.
A VC is a two-phase heat transfer device that is typically square or rectangular in cross-section and consists of an internal chamber constructed with a porous medium (wick) along the internal top and bottom walls, as illustrated in Figure 1. The inner wall that is in contact with the heat source is referred to as the evaporator, whereas the wall in contact with the adjacent heat sink is the condenser [11]. The wick structure, being the key component, provides capillary pressure to drive the condensate back to the evaporator and an enhanced interface for liquid-vapor phase change [12]. At the evaporator, the working fluid evaporates and carries the heat away from the source surface in both the normal (y-axis) and in plane (x- and z-axis) directions of the VC. The vapor then condenses at the condenser, releasing latent heat that is ultimately dissipated by the heat sink. The circulation is completed when the condensed liquid is recycled back to the evaporator through the porous wick via capillary force. Note that the two-phase flow circulation in VCs depends on the capillary pressure and permeability of the wick. Although there are multiple types of wicks – sintered powder wicks, mesh wicks, grooved wicks, and composite wicks – it is important to select a VC with a suitable wick for the required application. Much of the recent VC literature, from year 2020 onwards, focuses on composite wick structures [13-15], wickless VCs [16-17], ultra thin VCs [18-20] and embedded heat source VCs [21] for aerospace applications.
However, most reported characterisations have been performed on either sintered copper powder wicked VCs, or composite wicked VCs that involve a wire mesh as part of their design [11-13], [19], [22-26], [28]. To the authors’ knowledge, there are very few published studies on VCs with coarse wire mesh wicks which are the most common type of wick used. In addition, for the characterisation process, the heat source is typically not at a similar size to that of the power amplifier (~100 mm2. Several studies on the characterisation of VCs have applied heat sources with contact areas in the range of 225 to 900 〖mm〗^2, but only three previous studies used heat sources of ~100 mm2 [11], [22-23]. Of these three, only one employed a calorimeter approach, and this was on a sintered copper powder wicked VC [11]. Hence, there is a requirement to understand the thermal performance of wire mesh wicked VCs with small-scale (~10 mm x 10 mm) heat sources. Moreover, in the context of base station applications, it is important to understand the influence of orientation. Several studies [11], [13], [25-26] have shown that a vertical (90°) placement resulted in higher thermal resistances compared to a horizontal (0°) placement, however most of these studies focused on sintered copper powder wicked VCs. There are studies [12], [13], [26-28] that addressed mesh wicks, but they were either in flat heat pipes or VCs with composite wicks, rather than a pure wire mesh wicked VC. Attia et al. [27] went to an extreme where no wick was included in their VC fabrication in order to investigate the performance of various working
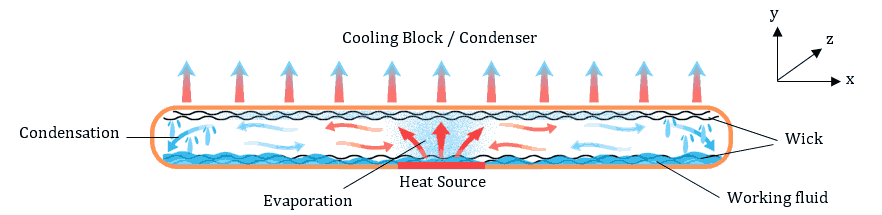
Table 1. Previously published thermal characterisation studies of VC performance. Note that only three of these studies applied calorimetry and all of the studies used custom-made VCs instead of an off-the-shelf device, as was used in this paper.
|
|
Type of VC |
Heating Technique |
Spreader-Source Ratio |
VC Orientation |
(K/W) |
|
Ji et al., 2012 [11] |
Cylindrical, copper foam, |
Copper rod calorimeter with cylindrical top surface of ∅10 mm (Qin=0-170 W) |
1:100 |
0°,30°,60° and 90° |
~ 0.09 – 0.38 |
|
Liu et al., 2022 [12] |
Square, copper screen mesh wick with copper sheet, |
Copper block with square top surface of 4 cm2 (Qin= 5 – 240 W) |
1:12.25 |
0° |
~ 0.11 – 0.41 |
|
Tang et al., 2013 [13] |
Square, sintered copper powdered wick, |
Copper block with square top surface of 1 cm2 and 4 cm2 (Qin= 60 – 300 W) |
1:81 and 1:5.06 |
0° |
~ 0.35 – 0.95 |
|
Xia et al., 2019 [15] |
Cylindrical, gradient sintered aluminium powdered wick, |
Copper rod with top surface of ∅20 mm (Qin=~6-62 W) |
1:30.25 |
0° |
~ 0.15 – 0.20 |
|
Ma et al., 2014 [17] |
Square, sintered copper powdered wick, |
Copper rod calorimeter with cylindrical top surface |
- |
0°,10°,20° and 30° |
~ 0.45 – 0.55 |
|
Zhao et al., 2023 [19] |
Rectangular, copper mesh and copper foam wick, |
Heating block |
- |
0°,30°,60° and 90° |
~ 0.33 – 1.15 |
|
Attia et al., 2012 [20] |
Cylindrical, no wick, varying working fluid |
Nickel chromium wire film heater (Qin= 2 – 65 W) |
- |
0° |
~ 1.2 – 11.5 |
|
Li et al., 2019 [21] |
Square, composite wick (sintered copper powder and wire mesh) |
Copper block calorimeter with square top surface of 1 cm2 (Qin= 30 – 180 W) |
1:81 |
0° |
~ 0.15 – 0.47 |
Robinson et al. [10] compared the performance of solid IHSs (copper) and VCs (sintered copper powder wick) of the same size in terms of thermal resistance, Rth, where one of the comparisons focused on the base size of the heat spreader under a fixed heat load (80 W). A mathematical model was developed for a ‘stacked’ arrangement, beginning at the heat source, followed by thermal interface material (TIM) TIM1, IHS (or VC), TIM2 and a convective heat sink. In their paper, the thermal resistance was viewed from two perspectives: the overall thermal resistance of the stack, Rthstack, and the thermal resistance of the IHS and VC themselves, Rth. The area of the heat source was fixed at 10 mm x 10 mm and the base size of both IHS and VC were increased from 10 mm x 10 mm to 20 mm x 20 mm and so on up to 100 mm x 100 mm for a 2 mm thickness. For both solid IHS and VC, the Rthstack decreases with increasing “base size-to-heat source size” (spreader-source) ratio in terms of planar area. Based on Robinson’s result, the Rthstack of both solid IHS and VC remains the same until the spreader-source ratio reached 1:4, after that the VC outperformed the solid IHS. When the thermal resistance, Rth of a solid IHS and VC were observed independently from the stack, the Rthof the solid IHS increased with increasing spreader-source ratio, whereas for VC, its Rth decreased with increasing spreader-source ratio. The result showed that a solid IHS could outperform a VC for spreader-source ratios of less than 1:16, but that VCs were progressively superior for greater ratios. This is because the solid heat spreader resistance increases with base size due to the increased lateral conduction resistance, whereas the reduction of VC spreader resistance remains quite constant with increasing base size.
In this paper, an off-the-shelf wire mesh wicked VC with an estimated charge ratio of 30% is thermally characterised using a calorimeter, where the tip dimensions of the heat sources tested are 10 mm, 16 mm and 20 mm square in order to represent the typical sizes of power amplifiers in a base station. Thermal characteristics are obtained for a range of tilt angles of the VC, from horizontal (0°) to vertical (90°), between 3 to 60 W to quantify how performance may be affected in tilted base stations. The characterisation processes are repeated by replacing the VC with a copper plate of the same dimensions in order to provide a baseline and to investigate the effect of contact resistance on the performance of the heat spreaders.
2. Experimental Method
This section describes the experimental setup including the frustum-tipped calorimeter and the location of the surface temperature measurements on the VC. The thermal characterisation technique and an uncertainty analysis are also presented.
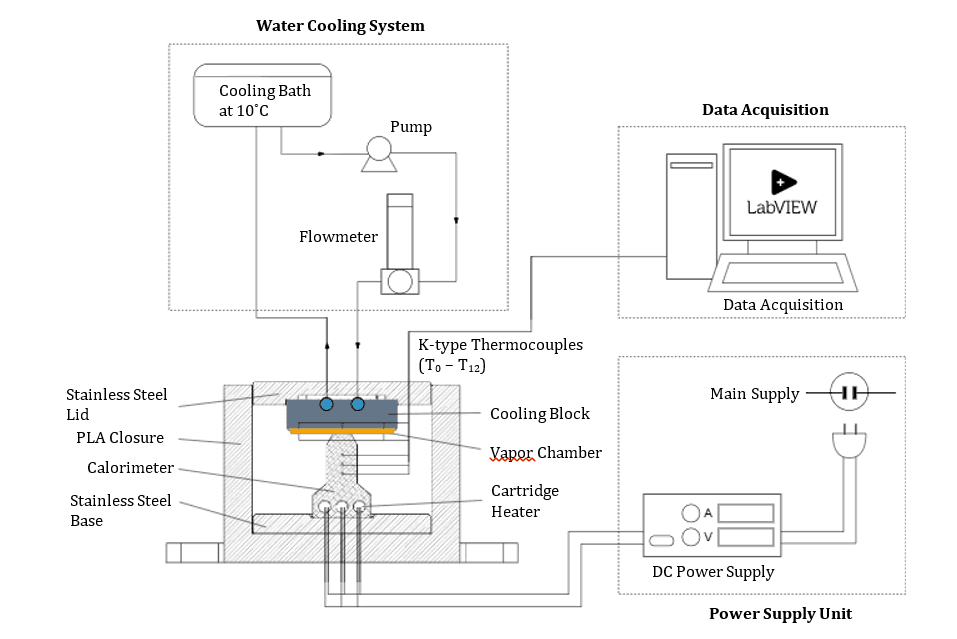
2. 1. Experimental systems
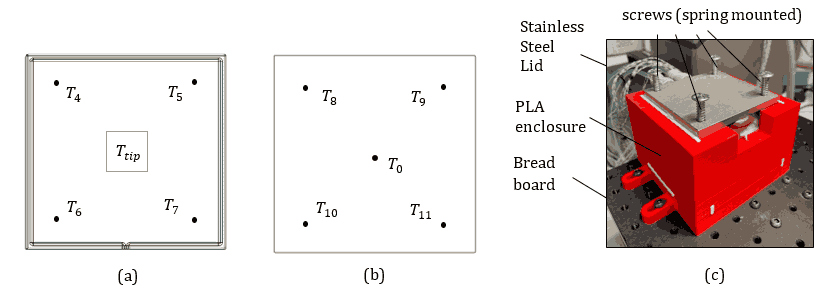
The experimental setup is illustrated in Figure 2. Twelve type-K thermocouples (RS PRO, 0.2 mm tip diameter) were attached to the surface of the VC (T4 - T11 and T0), as shown in Figure 3(a) and (b), and embedded into the calorimeter (T1 - T3), as shown in Figure 4. All temperature outputs were recorded by the Laboratory Virtual Instrument Engineering Workbench (LabVIEW) software, with measurement uncertainty of ±0.1 K. A wire mesh wicked VC (56 mm x 56 mm x 3 mm, T-Global Technology) with an estimated 30% charge ratio (given by manufacturer) of water as working fluid and maximum operating power, Qmax of ~110 W, was characterised in this experiment. The VC was initially tested in a horizontal orientation (0°) where the plane of the VC was perpendicular to gravity. The orientation of the setup was subsequently set via an adjustable angle mounting plate (AP180/M, Thorlabs GmbH) for 30°, 45° and 90° testing. Figure 3(a) shows the heating surface located at the evaporator centre of the VC and labelled as Ttip, with four thermocouples (T4 - T7) attached to the corners equidistant from the heat source. A set of thermocouple attachment pads were used to attach the thermocouples to the surface. Five thermocouples (T0, T8 - T11), as shown in Figure 3(b), were attached to the condenser surface of the VC. To ensure good surface contact between the VC and the cooling block, narrow trenches were machined into the cooling block surface to allow for a snug fit for thermocouple attachment. Between all surface contacts, a layer of non-silicone thermal grease (nominal thermal impedance of 0.012 K- mm 2/W, RS PRO) was applied to ensure low contact resistance. Three ceramic cartridge heaters (ED3 24V) were inserted into the bottom section of the calorimeter, allowing a maximum thermal loading of 120 W. The testing power was limited by the operating temperature of the insulating block (RS PRO-PLA PRO+) and the thermal grease at 150 °C. To enhance the structural stability of the calorimeter and to prevent direct contact between the hot aluminium and the PLA enclosure, 304 stainless steel plates were used as the base and the lid. Insulating wool was used to fill the empty space around the heating calorimeter to minimise heat loss. Heat removal was achieved through surface contact between the VC and a stainless-steel cooling block. A cooling bath (Huber with Pilot ONE – Ministat-230) was used to provide constant temperature liquid cooling, where the inlet of the cooling block was set to a constant value of 10 °C. The stainless-steel lid was fabricated with a space that could snugly fit the cooling block at the centre, helping to adjust the position between the attached VC and the calorimeter. A clamping mechanism was applied between the stainless-steel base and lid using screws at each corner, which were spring-mounted to ensure a consistent compression for surface contact between all the pieces, as shown in Figure 3(c). In order to ensure consistency of the data collected, the LabVIEW was programmed to increase heat input, Qin to its subsequent value (up to 60 W with an interval of 5 W) when steady state was achieved throughout the entire system: steady state was defined as a temperature change of no greater than 0.1 ℃ consistently for 5 minutes in Ttip and T0 - T11 for this characterisation.
2. 2. Design of frustum tip calorimeter
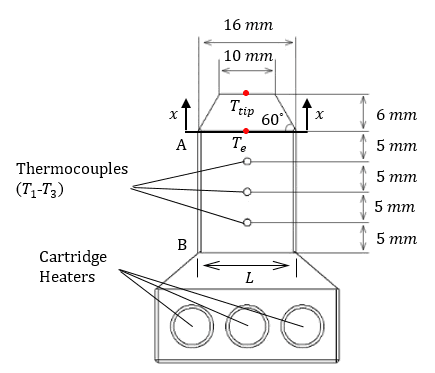
The characterisation process was carried out using a calorimeter manufactured from an aluminium alloy (6082T6) to ensure light weight and high thermal conductivity (k ~ 160 - 175 W/m.K). The size of the tip was designed to be 10 mm in a square cross section to replicate the size of a power amplifier. Because the tip is small, the conventional ASTM D5470-06 standard [22] characterisation that uses a uniform cross section up to the calorimeter tip was not suitable for this experiment, since a calorimeter with such a small cross section would make the experimental setup tall and complicated [17]. In order to address this structural challenge, the calorimeter for this paper was designed with a frustum tip, where the calorimeter body (A to B) was designed with a wider square cross section as shown in Figure 4 to allow the application of standardised calorimetry techniques while not compromising the structural stability of the setup. Temperature Tc in Equation 1 represents the temperature difference between T1 and T3 of the calorimeter. The temperature Te in Equation 2 was extrapolated based on the ASTM D5470-06 standard, and the temperature, Ttip was calculated through integration [10]:


In the above expressions, Qin is the thermal load across the calorimeter, x is the ordinate in the direction of the heat transfer, and L and θ are defined in Figure 4. Ttip was inferred as the temperature of the heat source in contact with the evaporator of the VC, Heat losses from the sides of the calorimeter were considered to be negligible. The application of Equation 2 does not apply to the calorimeter tip sizes of 16 mm and 20 mm since, in these cases, the calorimeters were fabricated with uniform cross sections up to the tip, and direct application of the conventional ASTM D5470-06 standard was used to extrapolate Ttip.
2. 3. Thermal characteristics
The performance of a heat spreader can be evaluated based on the total thermal resistance, which combines the one-dimensional and spreading resistances. One-dimensional resistance occurs from the evaporator face to the condenser face, where the size of the heat source is the same size as the heat spreader. Spreading resistance is the additional, multi-dimensional resistance associated with a concentrated heat source [10]. In this context, the total thermal resistance, Rth, in this experiment is recorded as:
where ![]() is the average temperature of the condenser surface of the VC, which can be defined as (refer to Figure 3(b)):
is the average temperature of the condenser surface of the VC, which can be defined as (refer to Figure 3(b)):
Contact resistance is an important factor that influences the characterisation of a VC, especially when spreader-source ratio is relatively small, as shown in Figure 3(a) and Figure 4. To evaluate the isothermality of the VC, the uniformity of the temperature distributions of the evaporator and the condenser surfaces of the VC is expressed as maximum temperature difference across the condenser surface, ∆Tcond and evaporator surface, ∆Tevap, based on five measured temperatures of each surface:


2. 4. Calibration and uncertainty analysis
The overall uncertainties in the heat input and thermal resistance of the VC were quantified as functions of the uncertainties in the primary measurands. Table 2 lists the uncertainties reported in previous studies for comparison.
Table 2. Uncertainties reported in relevant literature.
|
|
Uncertainties (%) |
|
|
|
Heat Input,Q |
Thermal Resistance,Rth |
|
Tang et al. [11] |
- |
< ±7.00 |
|
Ji et al. [13] |
- |
±6.10 |
|
Xia et al. [14] |
±4.85 |
±11.00 |
|
Ma et al. [16] |
- |
±5.00 |
|
Zhao et al. [18] |
±5.00 | ±7.80 |
|
Liu et al. [19] |
- |
< ±5.00 |
|
Attia et al. [20] |
- |
±6.80 |
|
Li et al. [21] |
±0.20 | ±4.36-13.72 |
All the uncertainties listed in Table 2 were analysed using the Kline and McClintock [24] method, and the uncertainties in each derived quantity for this paper were obtained using the Type B evaluation of uncertainty [25] that is equivalent to that of Kline and McClintock. In this paper, the heat transferred into the VC was quantified using the calorimeter, Qin. Although the heat delivered by the power supply, Qs, was not used, it is analysed here to provide a comparison with most reported techniques that utilised the direct application of Qs. The voltage, V and current, I were supplied by a Multicomp Pro-MP711057 programmable bench power supply with uncertainties of ±0.01 V and ±0.001 A respectively. Based on Equations 1 - 6, the main variables of interest are the dimensions of the calorimeter and vapor chamber (x and L), and the temperature measurements, T. In this regard, all relevant measured dimensions (L and x) had ±0.1 mm uncertainties. Additionally, the calorimeter block was machined with high precision and the uncertainty in the diameter of the drilled holes was within ±0.1 mm. The diameter of the holes was 1.10 mm to allow a snug fit of the thermocouples (∅ 1.00 mm), and each thermocouple was spaced 10 mm apart. The thermal conductivity, k, of the 6082T6 aluminium alloy can be represented using Woodcraft’s [23] temperature-dependent model. In the current study, the average temperature of T1 and T3, of the calorimeter, at each power input was used in the evaluation of the thermal conductivity, which can be ascribed with a ±2.0 % uncertainty. The calculated values of k range from (160.0-175.0 W)⁄(m.K) over a temperature range of 21.6 ℃-132.5 ℃. The thermocouples were calibrated against a Fluke 1504 temperature reference probe (uncertainty ±0.002 K at 298 K) in a Grant Instruments GD120 controlled water bath. A total of nine temperature points across 25 to 95 ℃ were measured and a fourth order polynomial curve was fitted, with root mean square error (RMSE) magnitude of 0.066. Each thermocouple was then ascribed ±0.1 K of uncertainty. The uncertainties in the measured variables and derived quantities are presented in Table 3. Note that the higher uncertainties in the derived quantities all apply in the low power input range of ~3 – 15 W. Aside from the low power input (< 15 W), the uncertainty for Rth is around ±3.3%, showing a more accurate characterisation result compared to the literature in Table 2. Since temperature difference is the function of all the derived terms, the total uncertainties decreased with increasing heat input into the system. .
Table 3. Uncertainty analysis for measured variables and derived quantities.
|
Measured Variable |
Uncertainty |
|
Temperature, T |
±0.1 K |
|
Length,L |
±0.1 mm |
|
Width,x |
±0.1 mm |
|
Diameter,d |
±0.1 mm |
|
Current,I |
±0.001 A |
|
Voltage,V |
±0.01 V |
|
Thermal Conductivity,k |
±2.0 % |
|
Derived Quantities |
Uncertainty (%) |
|
Power, Qs (W) |
±0.1-0.5 |
|
Heat input, Qin (W) |
±3.2-18.3 |
|
Thermal Resistance, Rth (K⁄W) |
±3.3-18.3 |
3. Results and Discussions
This section details the characterisation of the wire mesh wicked VC and the copper plate IHS for a range of heat inputs, orientations and heat source-sizes. Data for thermal resistance, Rth, and temperature differences, ∆Tevap and ∆Tcond are discussed to show the effect of gravity and thermal interface resistance on the thermal performance and isothermality of the VC.
3. 1. Effect of thermal interface resistance
Figure 5(a) and (d) show the thermal resistance, Rth, of the VC and copper plate (both are of dimensions 56 mm x 56 mm x 3 mm) respectively, for a range of orientations from 0° to 90° with an initial heat source size of 10 mm. In comparison, the overall Rth of the VC is lower than that of copper plate, reaching a minimum value of ~ 0.7 K⁄W at the maximum power level. This trend is similar to what is reported in the literature, where the Rth of a VC reduces with increasing Qin. The Rth of the VC increases with tilt angle, with the vertical (90°) orientation having the highest Rth due to the net effects of the motion of the liquid phase against gravity. Note that the VC’s resistances at 30°, 45° and 90° converge gradually as the heat input increases, showing that orientation has a larger impact on thermal performance at lower heat loads. Above 20 W, the difference in thermal resistance between the horizontal VC and the other orientations is ~0.4 K/W, around 32.3%. The data are, however, affected by thermal interface resistance associated with the small contact area of the 10 mm heat source. Although gravity influences the motion of the fluid within the wick, the thermal contact between the calorimeter and the VC is also likely to vary with orientation angle due to practical aspects of the test rig. All parts in the rig were clamped together in a top-down direction hence, when the rig was tilted (especially to 90°), the clamping force may have featured an offset, which would affect the interface resistance – an effect which would be exacerbated due to the size of the calorimeter tip (10 mm).
The variations in the Rth of the copper plate under different orientations, as shown in Figure 5(d), proves that the small contact area does affect the thermal interface resistance as for a solid copper plate there should be no influence of orientation on Rth. In order to investigate this further, the experiment was repeated using the same copper plate, but the size of heat source (calorimeter tip) was increased to 16 mm and 20 mm as shown in Fig. 5(e) and (f). According to the data, Rth is largely invariant with orientation for increasing Qin, which is the expected behaviour for a solid conductor. With this foundation, the characterisation of VC was further tested using the 16 mm and 20 mm heat sources.
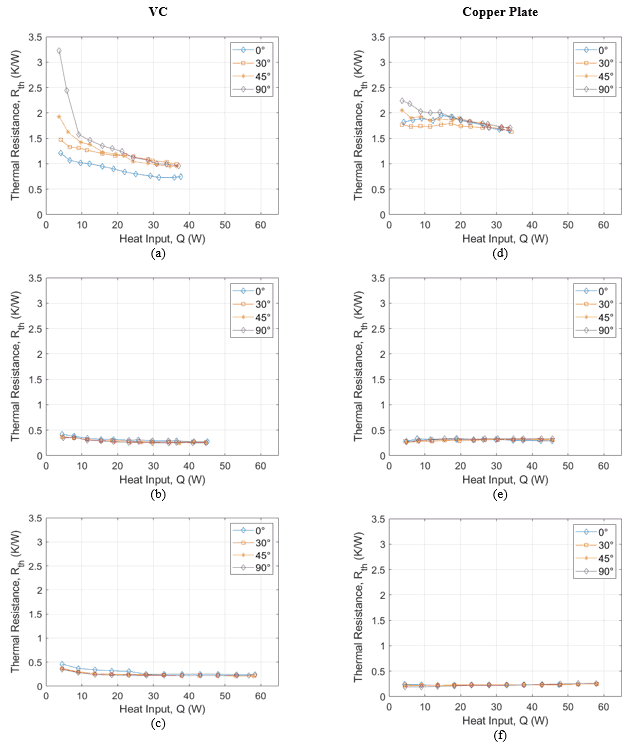
3. 2. Thermal resistance behaviour of the VC
Similar to the trend shown in Figure 5(a), decreasing Rth values with increasing Qin are observed in Figure 5(b) and (c). By comparison, the changes in Rth for the 16 mm and 20 mm heat sources are relatively small. The largest difference in Rth between the vertical (90°) and horizontal (0°) orientations for the 16 mm and 20 mm heat sources occurs at ~4.5W are ~0.075 K⁄W (16.7%) and ~0.115 K⁄W (23.4%) respectively. These differences are considered low for a heat spreader performance (~0.14 K⁄W (77.8%) recorded by Ji et al. [11] with a ∅10 mm heat source) – an advantage in the context of tilted 5G base station applications.
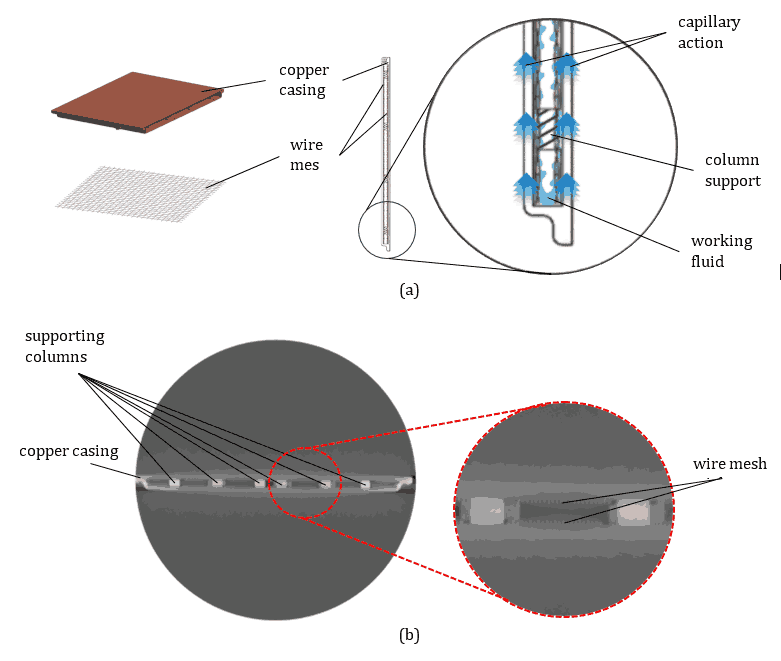
The relatively small differences in thermal resistance of the VC across all orientations, including the vertical, is consistent with the results of Ma et al. [17] and Zhao et al. [19]. It is postulated that this is due to the presence of working fluid in the wire mesh wick due to capillary action before heat is introduced into the system, as shown in Figure 6(a), which is consistent with the prediction of Zhao et al. [19]. Counterintuitively, the working fluid may not be ‘collected’ at the bottom of the VC for the vertical orientation; instead, it spreads across x-z plane (refer to Figure 1) of the VC and partially covers the inner wick of both evaporator and condenser of the VC. The level of the working fluid could also have reached the center of the evaporator where the 16 mm and 20 mm heat sources are placed, allowing heat to spread without the consequence of working against gravity (unlike in a vertical heat pipe). Zhao et al. [19] mentioned two points: (1) the effective distance (in the normal direction) from the evaporator to the condenser of the VC is short and (2) when inclination took place, it reduced the liquid film thickness in the evaporator region of the VC. This reduced the mass transport of fluid and enabled a more effective phase change, decreasing the overall thermal resistance of the VC. Additionally, the presence of columns (~∅2.5 mm each) in the VC, as shown in Figure 6(b), function as heat-conducting media normal to the plane of the VC, and also act as surfaces for the condensed liquid to return from the condenser to the evaporator. By taking these into consideration, it is postulated that the combination of these factors – the relatively small spreader-source ratio (1 : 12.3 for the 16 mm heat source and 1 : 7.8 for the 20 mm heat source), the reduced working fluid mass at the evaporator, and the conduction and liquid transport associated with the columns – provide an explanation for the largely invariant Rth of the VC.
However, if Rth is the sole factor that is considered, a copper plate is a better heat spreader for Qin values below 20 W, for both the 16 mm and 20 mm heat sources. For the 16 mm heat source, the copper plate outperforms the VC at Qin < 20 W (comparing Figure 5(b) and (e)). Robinson et al. [10] explains that this phenomenon is due to the VC that is operating under conduction mode, which is before phase change occurs. Considering that heat conduction is via the copper casing, mesh wick and the working fluid, across the void of the VC, the effective thermal conductivity could be lower than that of copper plate at low power input. The VC begins to outperform the copper at power levels greater than 20 W due to phase change that should occur in the wick structure of the evaporator. Considering that the mass transport of fluid (and associated heat transfer) of the VC at low Qin is driven by the temperature difference, the low magnitude of difference (< 2℃ between the top and bottom surface of the VC) contributes to its inferiority in comparison to the bulk conduction through the copper plate IHS. For the 20 mm heat source, even though a similar pattern can be seen, the overall Rth of both the VC and the copper plate are nearly the same (comparing Figure 5(c) and (f)). This could be because 1D-conduction normal to the plane of the VC is predominant, significantly reducing the influence of the superior heat spreading ability of the VC. This is consistent with the prediction of Robinson et al. [10] that a copper plate IHS will outperform a VC when the spreader-source ratio is below 1: 20.3. In this paper, the ratios for the 10 mm, 16 mm and 20 mm heat source are 1 : 31.4, 1 : 12.3 and 1 : 7.8 respectively. Hence, for low power applications and larger heat source-sizes (relative to the base size of an IHS), a copper plate could be a better and cheaper option for heat spreading applications.
3. 3. Isothermal properties of the VC
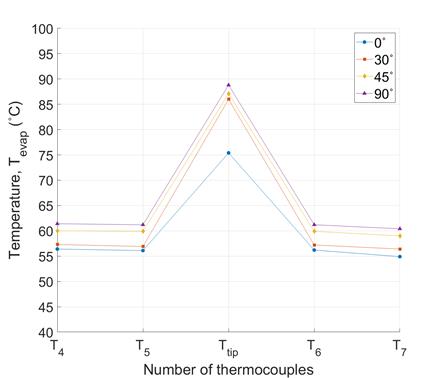
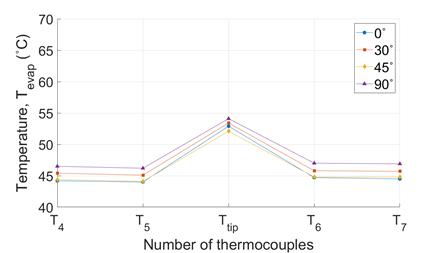
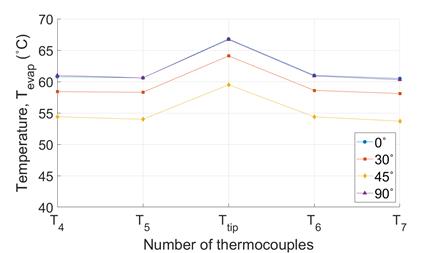
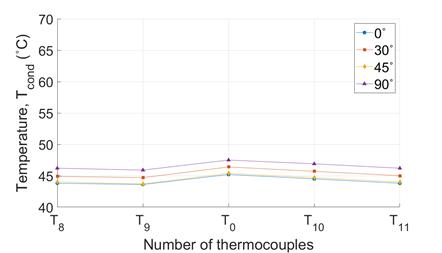
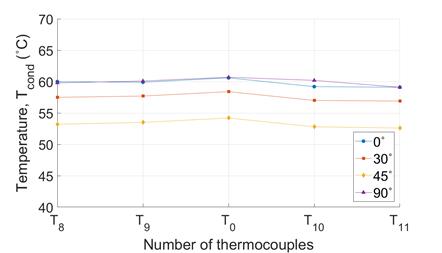
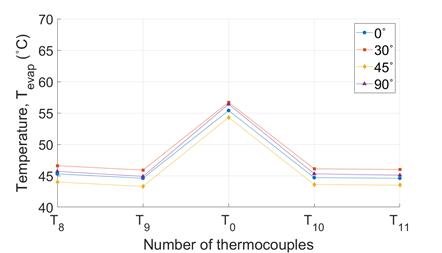
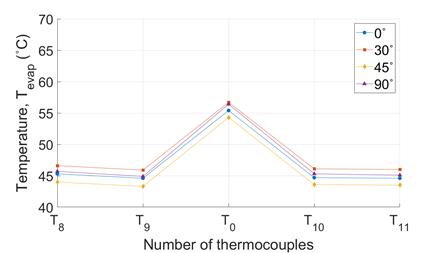
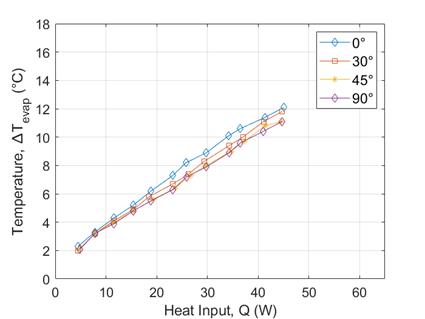
Figure 7 and Figure 8 present the temperature distributions on the evaporator and condenser surfaces of the VC respectively, for all heat source-sizes, under different orientations (at Q = ~30 W). For all sizes of heat source and orientation, the condenser side of the VC is highly isothermal. For the 90° orientation, all plots show slightly higher temperatures at all data points, demonstrating the effect of gravity. At the evaporator, temperatures peak at Ttip for all orientations and heat source-sizes (maximum of 88.8 ℃, 54.1 ℃ and 66.7 ℃ for 10 mm, 16 mm and 20 mm heat sources respectively) in Figure 7(a), (b) and (c) and with corresponding maximum ∆Tevap temperatures of ~30 ℃, ~9 ℃ and ~6 ℃ respectively.
 (a)
(a)
 (b)
(b)
 (c)
(c)
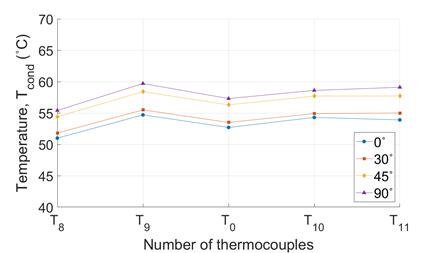
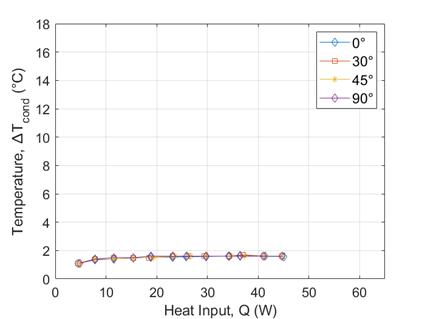
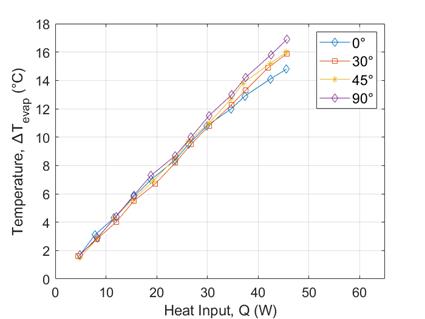
However, the value of ∆Tcond for all heat source-sizes is no greater than 4 ℃ , demonstrating the VC’s isothermality (Figure 8(a) to (c)). In order to compare the isothermality of the VC with that of the copper plate, the temperature profiles for the 16 mm heat source are shown in Figure 9(a) and (b). The ∆Tevap to ∆Tcond values of copper plate are ~11℃ and ~5℃ respectively, which shows a significant weaker isothermality than the VC (Figure 7(b) and Figure 8(b)).However, the value of ∆Tcond for all heat source-sizes is no greater than 4 ℃ , demonstrating the VC’s isothermality (Figure 8(a) to (c)). In order to compare the isothermality of the VC with that of the copper plate, the temperature profiles for the 16 mm heat source are shown in Figure 9(a) and (b). The ∆Tevap to ∆Tcond values of copper plate are ~11℃ and ~5℃ respectively, which shows a significant weaker isothermality than the VC (Figure 7(b) and Figure 8(b)).
 (a)
(a)
 (b)
(b)
 (c)
(c)
 (a)
(a)
 (b)
(b)
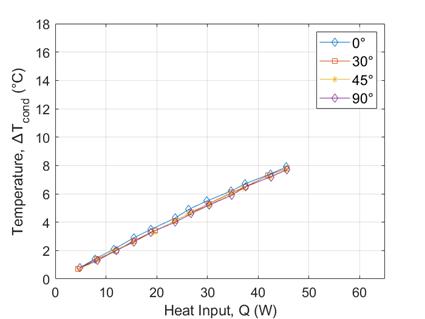
Furthermore, the evaporator of the copper plate shows the presence of a ‘hotspot’ at T0 relative to T8 to T11, unlike that of VC. The isothermal characteristics of both the copper plate and the VC are further revealed in a comparison of Figure 10(a) and (c) and Figure 10(b) and (d): ∆Tevap of both the copper plate and the VC increase with increasing Qin (Figure 10(a) and (c)), demonstrating the influence of the ‘hotspot’, which is Ttip. However, ∆Tcond of VC shows very little change with increasing heat input whereas ∆Tcond for the copper plate increases (mainly due to difference between T0 and T9) (Figure 10(b) and (d)), highlighting that VCs could be a solution to ‘hotspot’ formation.
 (a)
(a)
 (b)
(b)
 (c)
(c)
 (d)
(d)
4. Conclusion
The thermal performance of a wire mesh wick VC was studied under different orientations (0°, 30°, 45° and 90°) and heat source-sizes (10 mm, 16 mm and 20 mm). By taking a copper plate as a reference, the thermal resistance, Rth, temperature difference at the condenser, ∆Tcond, temperature difference at the evaporator, ∆Tevap, and the spatial temperature distributions, were analysed. The conclusions are as follows:
- Across all sets of parameters (input power, orientations and heat source), the wire mesh VC shows low Rth values (~0.2-3.2 K/W). At input powers of > 20 W, the Rth drops below 1.4 K/W, demonstrating a competitive thermal resistance compared with other heat spreading structures.
- For all orientations at all heat source sizes (10 mm, 16 mm and 20 mm), the Rth of the VC decreases by ~30 – 70% for increasing power inputs of 3 – 60 W. The values of Rth for the 16 mm and 20 mm heat sources remain in the range of 0.25 – 0.42 K/W and 0.21 – 0.46 K/W respectively, which demonstrates excellent heat spreading capabilities.
- For the 10 mm heat source, thermal resistance increases with increasing tilting angle and peaks for the vertical (90°) orientation, showing the impact of thermal interface resistance for small heat sources (a universal challenge for small components). However, the temperature differences across the evaporator (∆Tevap) and condenser (∆Tcond) surfaces suggest that the VC itself is highly isothermal, regardless of orientation. This result shows that VCs can provide a solution to the formation of ‘hotspots’, and can be practically applied in vertically-oriented 5G base stations.
- The VC performance is at its best at power inputs > 20 W, making it a suitable heat spreader for ICs in 5G base stations, especially for power amplifiers that dissipate high thermal loads. For a low power application (< 20W), a copper plate IHS could be sufficient to dissipate heat instead of investing in a VC of higher cost. This is valid only if isothermal performance is not a significant factor in the application.
Acknowledgments
This research is conducted with the financial support of Taighde Eireann – Research Ireland under Grant Number. 13/RC/2077_P2 at CONNECT: the Research Ireland Centre for Future Networks.
References
[1] GSMA (2023). The State of Mobile Internet Connectivity 2023 [Online]. Available: View Article
[2] X. Ge, S. Tu, G. Mao, C. X. Wang and T. Han, "5G Ultra-Dense Cellular Networks," IEEE Wireless Communications, vol. 23, no. 1, pp. 72-79, February 2016. View Article
[3] M., Dileep & Jena, Mr. Soumya, "Challenges and Future Research Directions in 6G"6G Technology and It's Applications, Dwalior, MP: Xoffencer, 2023, pp. 119-136.
[4] T. Cappello, P. H. Pednekar, C. F. Steve, C. Cripps, Z. P. Taylor and W. Barton, "Supply and Load Modulated Balanced Amplifier for Efficient Broadband 5G Base Stations," IEEE Transactions on Microwave Theory and Techniques, vol. 67, no. 7, pp. 3122-3133, July 2019. View Article
[5] R. Prasher and J.Y. Chang, "Cooling of electronic chips using microchannel and micro-pin fin heat exchangers," in ASME 2008 6th International Conference on Nanochannels, Microchannels, and Minichannels, Darmstadt, Germany, 2008, pp. 1881-1887. View Article
[6] N. Lakhkar, A. Banerjee, G. Refai-Ahmed, and D. Agonafer, "Multiobjective optimization of graphite heat spreader for portable systems applications," in Proceedings of the ASME 2009 InterPACK Conference, San Francisco, California, 2009, pp. 571-578. View Article
[7] D. Sabatino and K. Yoder, "Pyrolytic graphite heat sinks: A study of circuit board applications," IEEE Trans. Compon., Packag., Manuf. Technol., vol. 4, no. 6, pp. 999-1009, June 2014. View Article
[8] J. Zhang, G. Shi, C. Jiang, S. Ju, and D. Jiang, "3D bridged carbon nanoring/graphene hybrid paper as a high-performance lateral heat spreader," Small, vol. 46, pp. 6197-6204, 2015. View Article
[9] Y. Zhang, H. Han, N. Wang, P. Zhang, Y. Fu, M. Murugesan, M. Edwards, K. Jeppson, S. Volz and J. Liu, "Improved heat spreading performance of functionalized graphene in microelectronic device application," Advanced Functional Materials, vol. 25, no. 28, pp. 4430-4435, 2015. View Article
[10] A. J. Robinson, J. Colenbrander, R. Kempers and R. Chen, "Solid and Vapor Chamber Integrated Heat Spreaders: Which to Choose and Why," IEEE Transactions on Components, Packaging and Manufacturing Technology, vol. 8, 2018. View Article
[11] X. Ji, J. Xu, A. M. Abanda, "Copper foam based vapor chamber for high heat flux dissipation," Experimental Thermal and Fluid Science, vol. 40, pp. 93-102, 2012. View Article
[12] T. Liu, W. Yan, X. Yang, and S. Wang, "Improving the thermal performance of thin vapor chamber by optimizing screen mesh wick structure," Thermal Science and Engineering Progress, vol. 36, p. 101535, 2022. doi: 10.1016/j.tsep.2022.101535. View Article
[13] Y. Tang, D. Yuan, L. Lu and Z.Wang, "A multi-artery vapor chamber and its performance," Applied Thermal Engineering, vol. 60, no. 1-2, pp. 15-23, 2013. View Article
[14] M. Tsai, S. Kang, K. V. Paiva, "Experimental studies of thermal resistance in a vapor chamber heat spreader," Applied Thermal Engineering, vol. 56, pp. 38-44, 2013. View Article
[15] Y. Xia, F. Yao, F and M. Wang, "Experimental Investigation on Thermal Performance of Vapor Chambers with Different Wick Structures," Energies, vol. 16, no. 6464, 2019. View Article
[16] Z. Chen, Y. Li, J. Yu, L. Deng, H. Chen and X. Tang, "Fabrication and characterization of ultra-thin vapour chambers with printed copper powder wick," Applied Thermal Engineering, vol. 201, 2022. View Article
[17] J. Ma, X. Luo and R. Hu, "Effect of inclination angle on the performance of a kind of vapor chamber," Journal of Solid State Lighting, vol. 1, 2014. View Article
[18] G. Huang, W. Liu, Y. Luo, Y. Li, H. Chen, "Fabrication and thermal performance of mesh-type ultra-thin vapor chambers," Applied Thermal Engineering, vol. 162, 2019. View Article
[19] Z. Zhao, L. Li, Y. Wang, Y. Wang, and Y. Hui, "Heat transfer of copper mesh-powder composite-based sintered-wick vapor chamber," AIP Advances, vol. 13, no. 1, p. 015027, Jan. 2023. doi: 10.1063/5.0134402. View Article
[20] A. A. A. Attia and B. T. A. El-Assal, "Experimental investigation of vapor chamber with different working fluids at different charge ratios," Ain Shams Engineering Journal, vol. 3, pp. 289-297, 2012. doi: 10.1016/j.asej.2012.02.004. View Article
[21] Y. Li, W. Zhou, Z. Li, Z. Chen, and Y. Gan, "Experimental analysis of thin vapor chamber with composite wick structure under different cooling conditions," Applied Thermal Engineering, vol. 156, pp. 471-484, 2019. doi: 10.1016/j.applthermaleng.2019.04.084. View Article
[22] R. Kempers, P. Kolodner, A. Lyons and A. J. Robinson, "A high-precision apparatus for the characterization of thermal interface materials," Review of Scientific Instruments, vol. 80, no. 9, 2009. View Article
[23] A. L. Woodcraft, "Predicting the thermal conductivity of aluminium alloys in the cryogenic to room temperature range," Cryogenics, vol. 45, no. 6, pp. 421-431, 2005. Available: http://www.sciencedirect.com/science/journal/00112275. View Article
[24] S. J. Kline and F. A. McClintock, "Describing uncertainties in single-sample experiments," Am. Soc. Mech. Eng., vol. 75, no. 3, pp. 3-8, 1953. View Article
[25] JCGM, "Evaluation of measurement data-Guide to the expression of uncertainty in measurement," Évaluation des données de mesure-Guide pour l'expression de l'incertitude de mesure, 2008. www.bipm.org.