Journal of Fluid Flow, Heat and Mass Transfer (JFFHMT)
ISSN: 2368-6111

Volume 11 - Year 2024 - Pages 264-271
DOI: 10.11159/jffhmt.2024.027
Numerical Analysis of Control Valve with Perforated Cage under Different Inlet Pressure Conditions
Yuki Kurosawa1, Chongho Youn1
1Azbil Corporation
1-12-2, Kawana, Fujisawa, Kanagawa, Japan 251-8522
y.kurosawa.a7@azbil.com; c.youn.9i@azbil.com
Abstract - This study is performed to confirm the flow characteristics under varying inlet pressures in a control valve using a single-stage resistance perforated cage via experiments and computational fluid dynamics (CFD) simulation and to evaluate the flow state based on CFD visualization results. The target control valve is a 2-inch perforated cage valve, and the hole shape is cylindrical with a diameter of 2.5 mm. The flow coefficient (Cv) is calculated based on three differential pressures, and the liquid pressure recovery factor (FL) is calculated using the maximum differential pressure. We calculate and compare the Cv and FL, which are flow characteristics, from the experimental and CFD results to confirm the validity of the CFD analysis model. Subsequently, the pressure distribution, velocity distribution, void fraction, and erosion are visualized based on the CFD analysis results. The results show that a region with a high void fraction is generated owing to cavitation caused by flow separation at the inlet of the perforation, and that an increase in the inlet pressure results in a region with a high void fraction expanding to the outlet of the perforation.
Keywords: Control valve, Cavitation, CFD, Visualization.
© Copyright 2024 Authors - This is an Open Access article published under the Creative Commons Attribution License terms. Unrestricted use, distribution, and reproduction in any medium are permitted, provided the original work is properly cited.
Date Received: 2024-03-21
Date Revised: 2024-07-25
Date Accepted: 2024-08-12
Date Published: 2024-xx-xx
1. Introduction
Control valves are a component used to control the flow rate of fluid flowing through pipes in chemical plants and factories. They are characterized by their flow coefficient (CV) and liquid pressure recovery factor (FL). CV indicates the ease of fluid flow, whereas FL indicates the ease with which choke flow occurs due to cavitation. Control valves are typically used under high differential pressures; therefore, their structure must facilitate cavitation suppression, which is a topic under active investigation. Investigations pertaining to cavitation related to control valves are briefly introduced below.
Gao et al. [1] investigated cavitating flows in the orifice of a poppet valve and ball valve using a k–epsilon turbulence model and multiphase-flow cavitation model. Yaghoubi et al. [2] investigated intensity and formation regions of cavitation for four different cases via numerical analysis. Qiu et al. [3] numerically investigated the cavitation in a sleeve regulating valve under different pressure differences and valve core displacements. Liu et al. [4] experimentally and numerically investigated the cavitation in a regulating valve under different inlet pressures. Liu et al. [5] conducted a numerical analysis of the unsteady cavitation flow and pressure pulsation characteristics of a control valve. Most of the research has been done using CFD and experiments. The mechanism of cavitation flow in control valves is not yet clear, but there is a risk of erosion, so research and evaluation are important.
Therefore, in a previous study, the authors investigated the occurrence of cavitation erosion in an angle valve using experiments and CFD [6]. In this study, we use a perforated cage with a cylindrical orifice shape as a single-stage resistance element and perform CFD simulation to evaluate the flow inside a control valve and to determine the location of erosion when the inlet pressure is changed. We first compare the experimental results of flow characteristics and choke flow with the CFD results to validate the CFD results. Subsequently, we visualize the pressure distribution, velocity distribution, and void fraction based on the CFD results to examine them as well as to determine the locations where cavitation occurs and erosion effects are strong.
2. Material and Method
2. 1. Control Valve
Figure. 1(a) shows the cross-sectional view of a three-dimensional (3D) model of a perforated cage with a 2-inch control valve and the details of the perforated cage. Figure. 1(b) shows a photograph of the perforated cage used in the experiment. The flow direction, as indicated by the arrow in the figure, is the flow-to-close direction. The perforated cage is cylindrical and features a hole diameter of 2.5 mm, with two holes and one hole arranged in an alternating manner in the circumferential direction. The distance between the centers of the holes in the vertical direction is 6 mm, and the distance (angle) between the centers of the holes in the horizontal direction is 15°. The aperture of the valve in the experiment and CFD simulation was set to 100%.
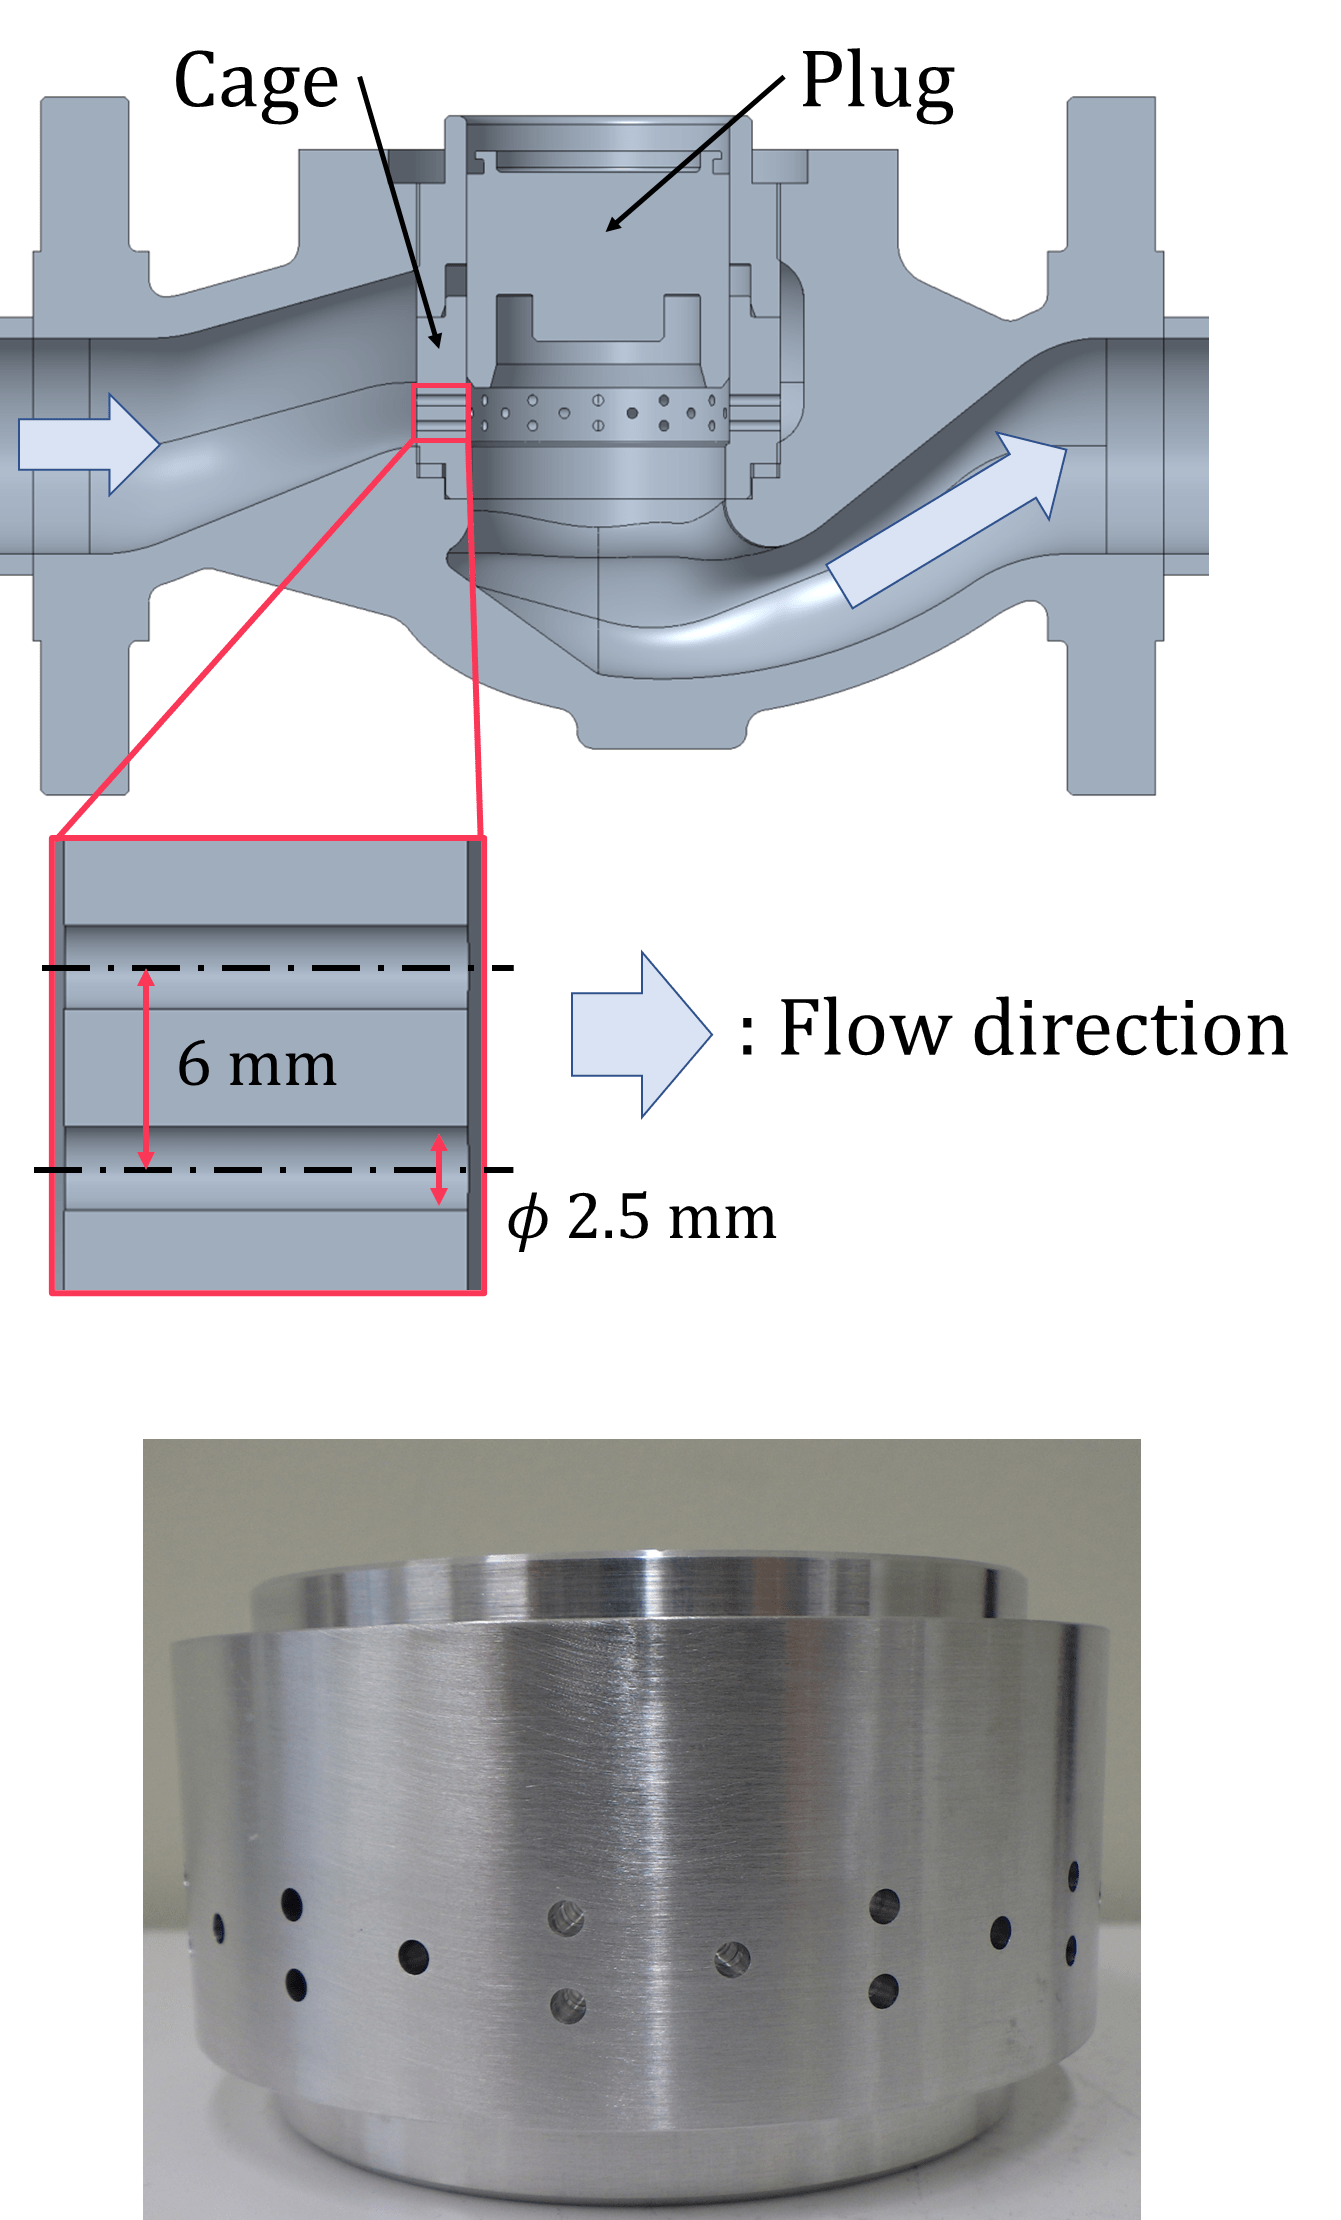
(b) Perforated cage.
Figure 1. Control valve.
2. 2. Experimental Setup
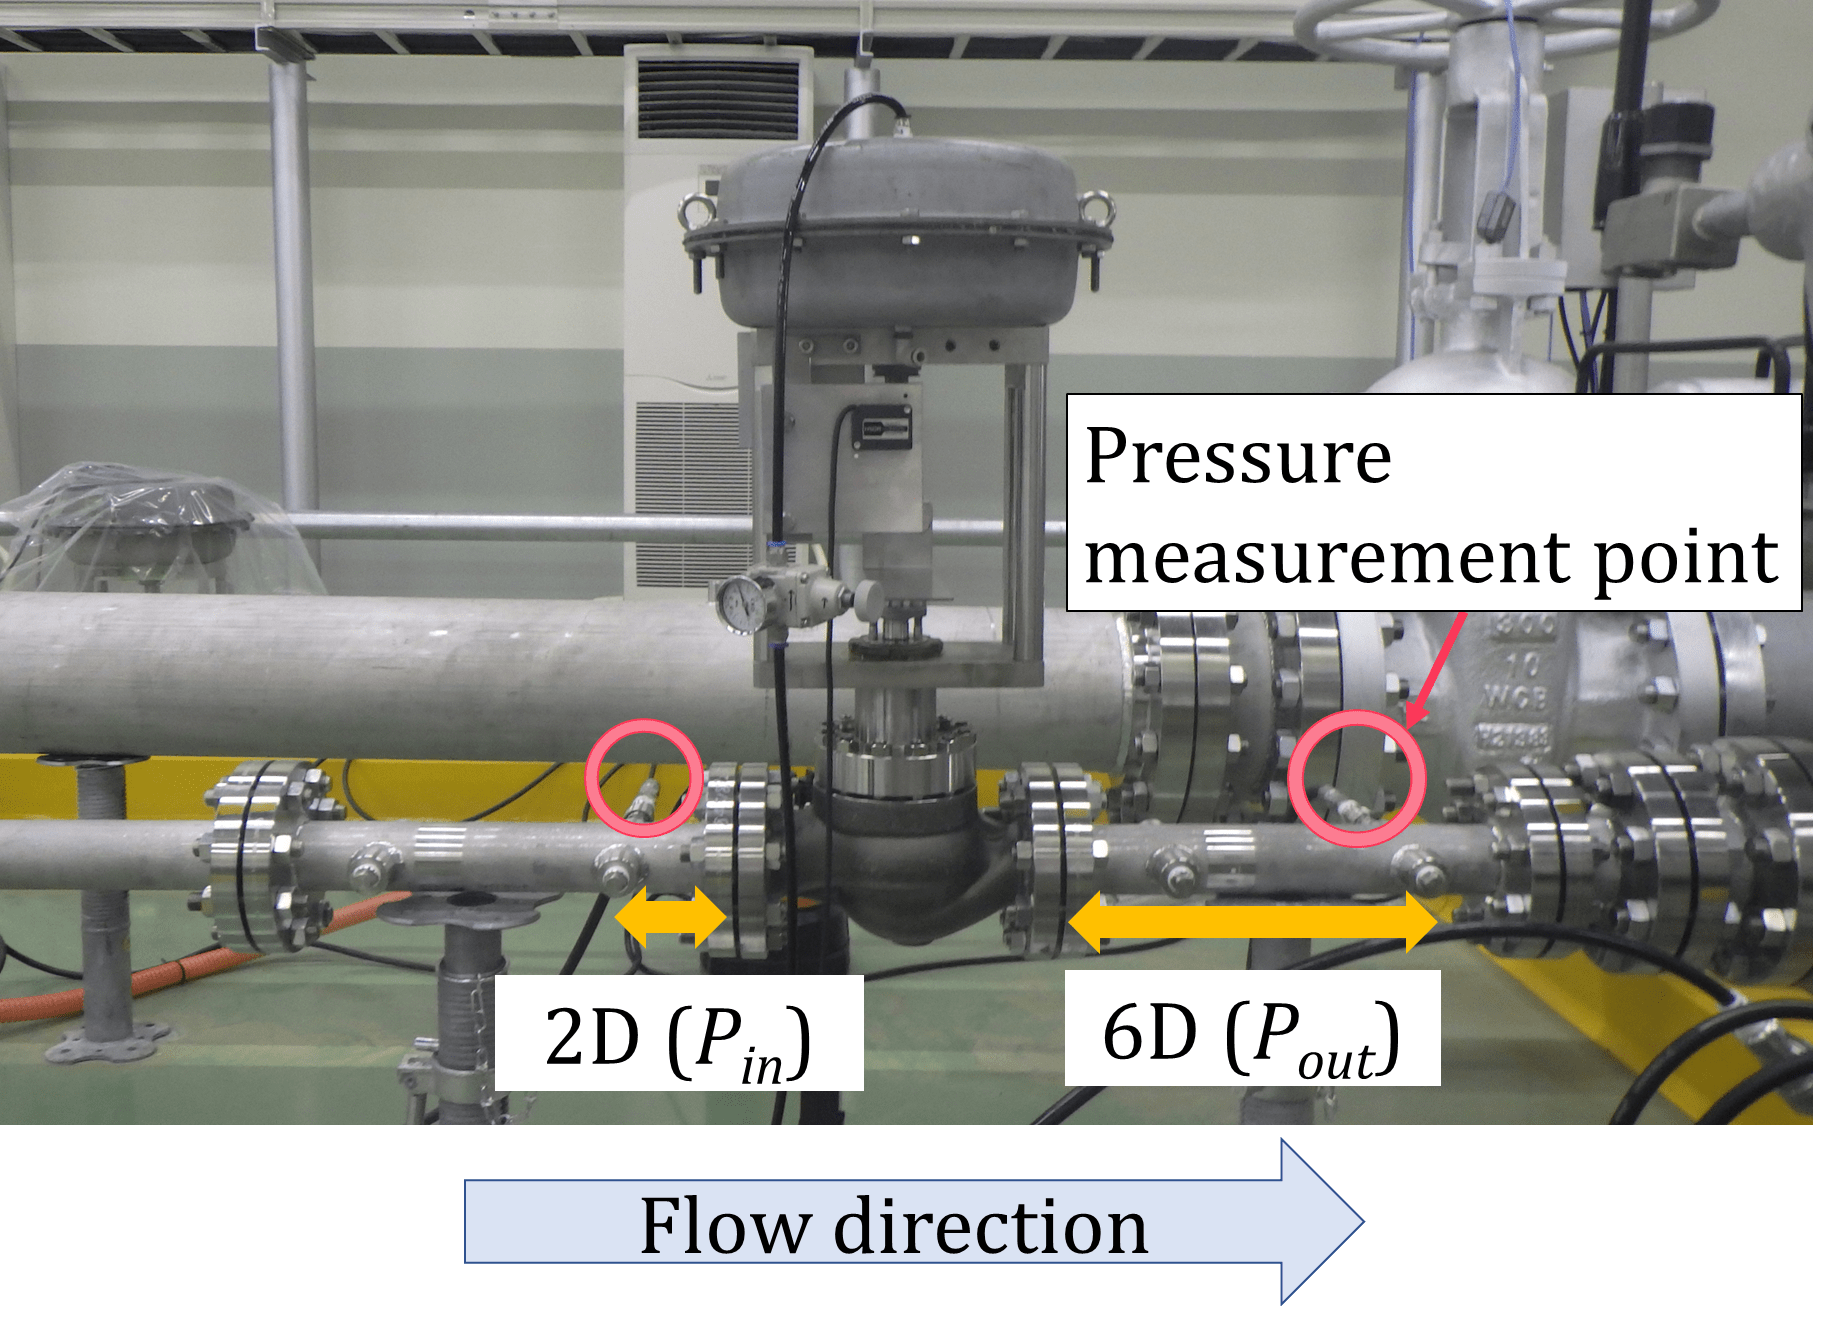
Figure. 2 shows a photograph of the test valve used in the experiment. The pressure measurement points were 2D in the inlet side and 6D in the outlet side, with D being the pipe diameter, which is in accordance with the control-valve test pressure-measurement positions stipulated in International Electrotechnical Commission 60534-2-3.
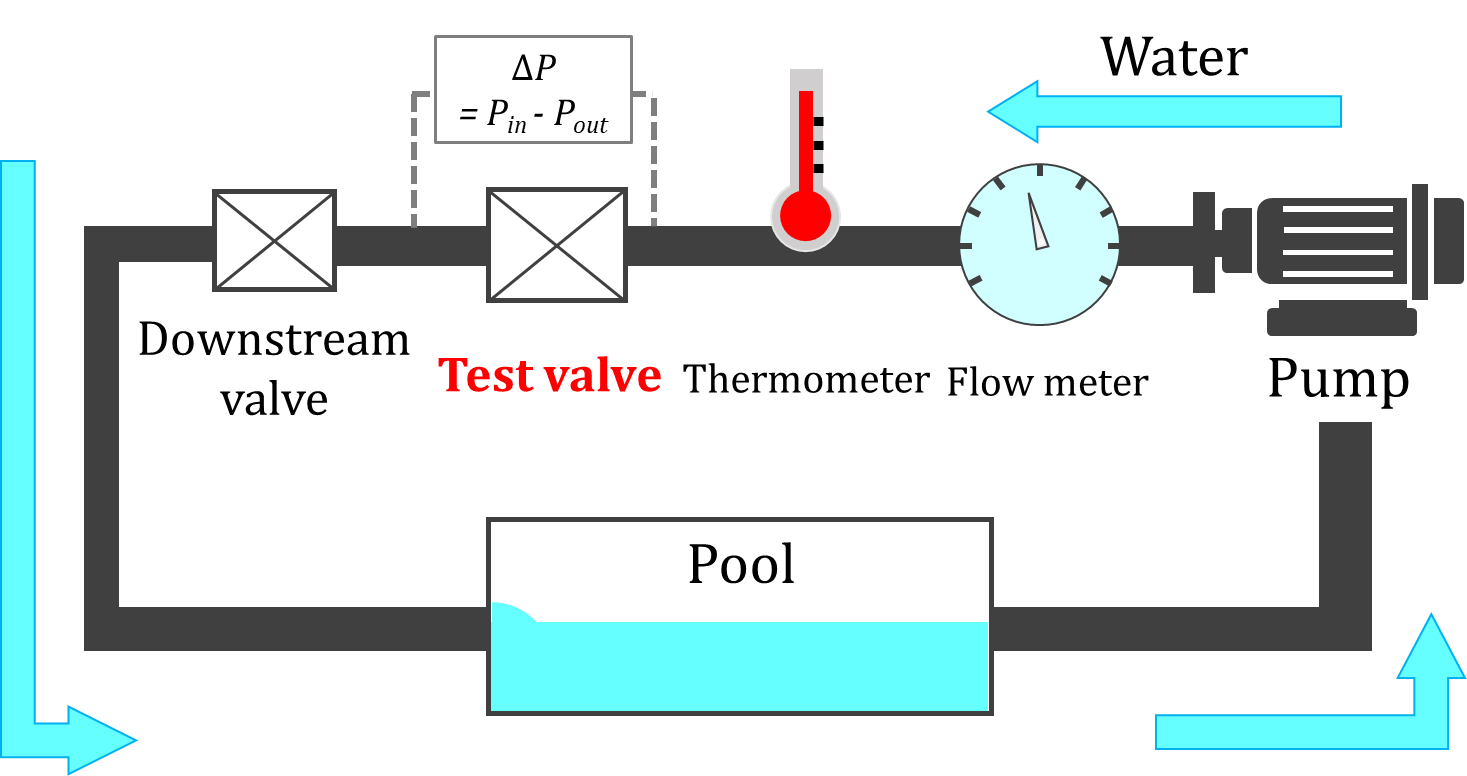
Figure. 3 shows a schematic diagram of the experimental equipment. Water is supplied from the pump, and the flow rate is measured using a flow meter installed at the inlet side of the test valve. The aperture of the downstream valve is changed to adjust the differential pressure applied to the test valve, and the flow rate, inlet pressure, differential pressure, and water temperature of the control valve are recorded. Water is supplied to the pool from the downstream valve and circulated.
CV can be determined from the non-choked flow state, whereas FL can be determined from the choked flow state. In this experiment, the inlet pressure Pin was set as 0.5, 1.7, and 3.5 MPa (abs). CV was measured under three differential pressures, whereas FL was measured at the maximum differential pressure achievable by the measurement equipment and at a differential pressure of 90% of the maximum differential pressure.
2. 3. CFD Simulation
In the CFD simulation, the piping lengths on the inlet and outlet sides of the control valve were set to 2D and 6D, respectively, as in the experiment. Figure. 4 shows the CFD mesh. The mesh size was specified that the element resolution around the cylindrical diaphragm, which is the focus of this study, would be the highest. The 1D inlet piping and the 3D outlet piping were created using a hexa mesh, whereas the other components were created using a tetra mesh. The flow rate Q at the control valve was calculated by applying the experimentally measured pressures at the pipe inlet and outlet boundaries. CFD simulation was conducted by setting the intermediate differential pressure among the three differential pressures as the boundary condition for CV calculations and the maximum differential pressure for FL calculations. CV and FL can be determined using in Eqs. (1) and (2) using the pressure P, flow rate Q, and saturated vapor pressure pv.
Table 1 shows the details pertaining to the CFD simulation. The CFD solver used was Advance/FrontFlow/red ver. 5.4, which is a general-purpose fluid analysis code. Advance/FrontFlow/red is a commercial software developed by AdvanceSoft Corporation that supports parallel calculations using supercomputers. The cavitation model used the homogeneous flow model proposed by Saito [7] with the following equations.

where 𝑇𝑠 is the saturation temperature and C1*=CeCa and C2*=CcCa are the empirical model constants.
For the advection term, stable solutions were obtained using the second-order central difference method for CV analysis and the second-order upwind difference method for FL analysis. was set to 1×10⁻⁵, and in some CFD analyses of FL, calculations were conducted at 5×10⁻⁶ and 2.5×10⁻⁶ to suppress calculation divergence. Additionally, the number of mesh elements was set to greater than 500,000, and 200 parallel calculations were conducted using the Fugaku supercomputer. We have confirmed that this calculation was performed within a range of mesh elements where the results are independent of the mesh size.
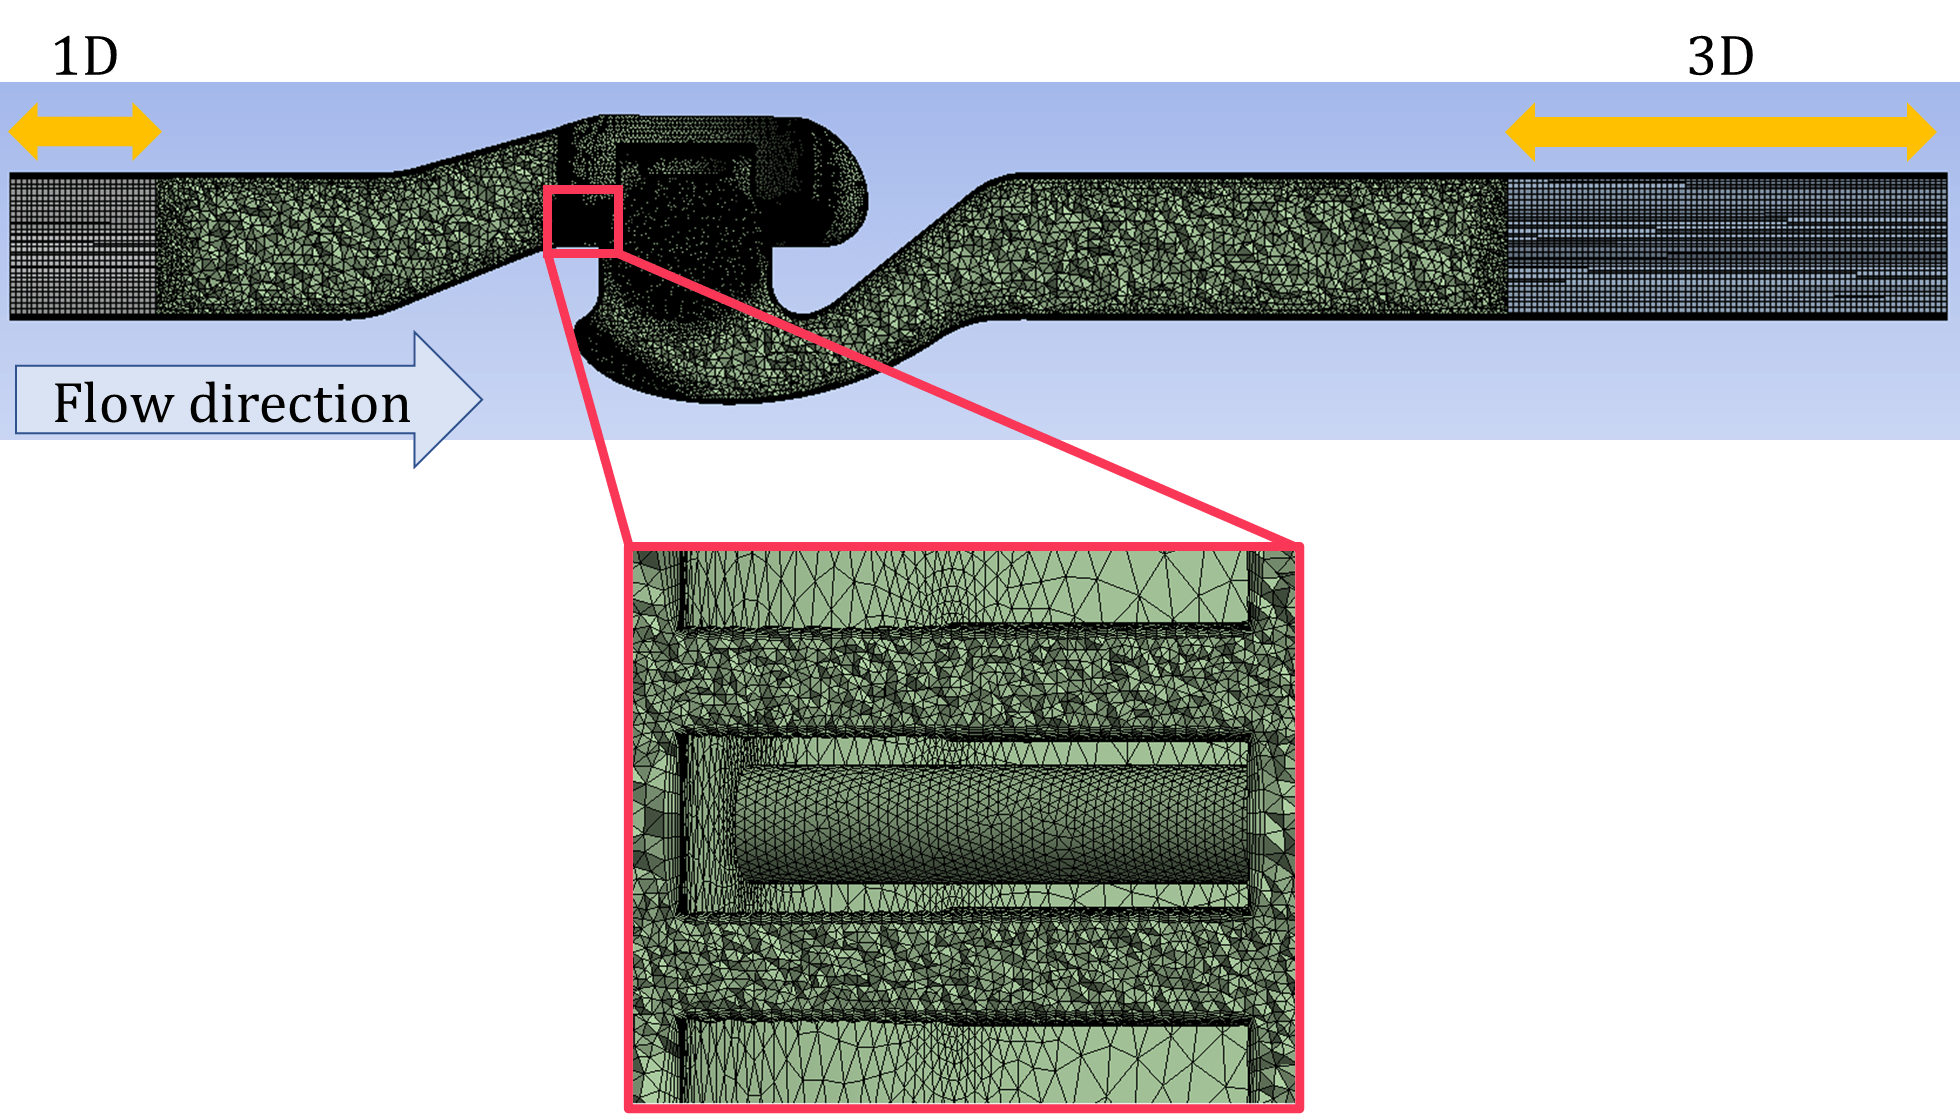
Table 1. Details of CFD simulation.
|
Software |
Advance/FrontFlow/red Ver.5.4 |
|
Turbulent model |
K-epsilon turbulence model |
|
Fluid |
Water (25℃, Compressible) |
|
Number of cells |
5,375,372 |
|
Advection term discrete scheme Momentum |
In case of CV: 2nd order central difference In case of FL: 2nd order upwind difference |
|
Law of the wall |
Spalding’s law |
| ∆t |
1×10⁻⁵, 5×10⁻⁶, 2.5×10⁻⁶ |
3. Results and Discussion
3. 1. Experimental and CFD results
Figure. 5 shows the experimental and CFD results at each inlet pressure. The vertical axis represents the flow rate, and the horizontal axis represents the 1/2 power of the differential pressure, with the region where the flow rate increases linearly being a non-choked flow region, and the region where the flow rate remains unchanged being a choked flow region. As shown, an increase in the inlet pressure increased the pressure difference until choked flow, and the flow rate of the choked flow increased.
Table 2 shows the experimental and CFD results for CV and FL. The errors remained within 3.4% and 5.8% for CV and FL, respectively; thus, the CFD model used in this study was considered valid.
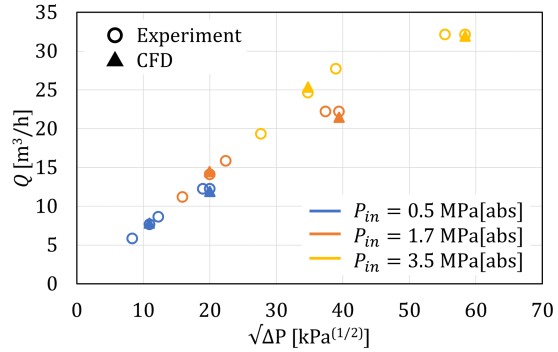
Table 2. Experimental and CFD results.
|
Inlet pressure |
|
CFD |
Experiment |
Error % |
|
0.5 MPa[abs] |
CV |
8.24 |
8.11 |
1.7 |
|
FL |
0.75 |
0.78 |
-3.8 |
|
|
1.7 MPa[abs] |
CV |
8.37 |
8.15 |
2.7 |
|
FL |
0.73 |
0.78 |
-5.8 |
|
|
3.5 MPa[abs] |
CV |
8.44 |
8.17 |
3.4 |
|
FL |
0.74 |
0.77 |
-3.9 |
3. 2. Visualization
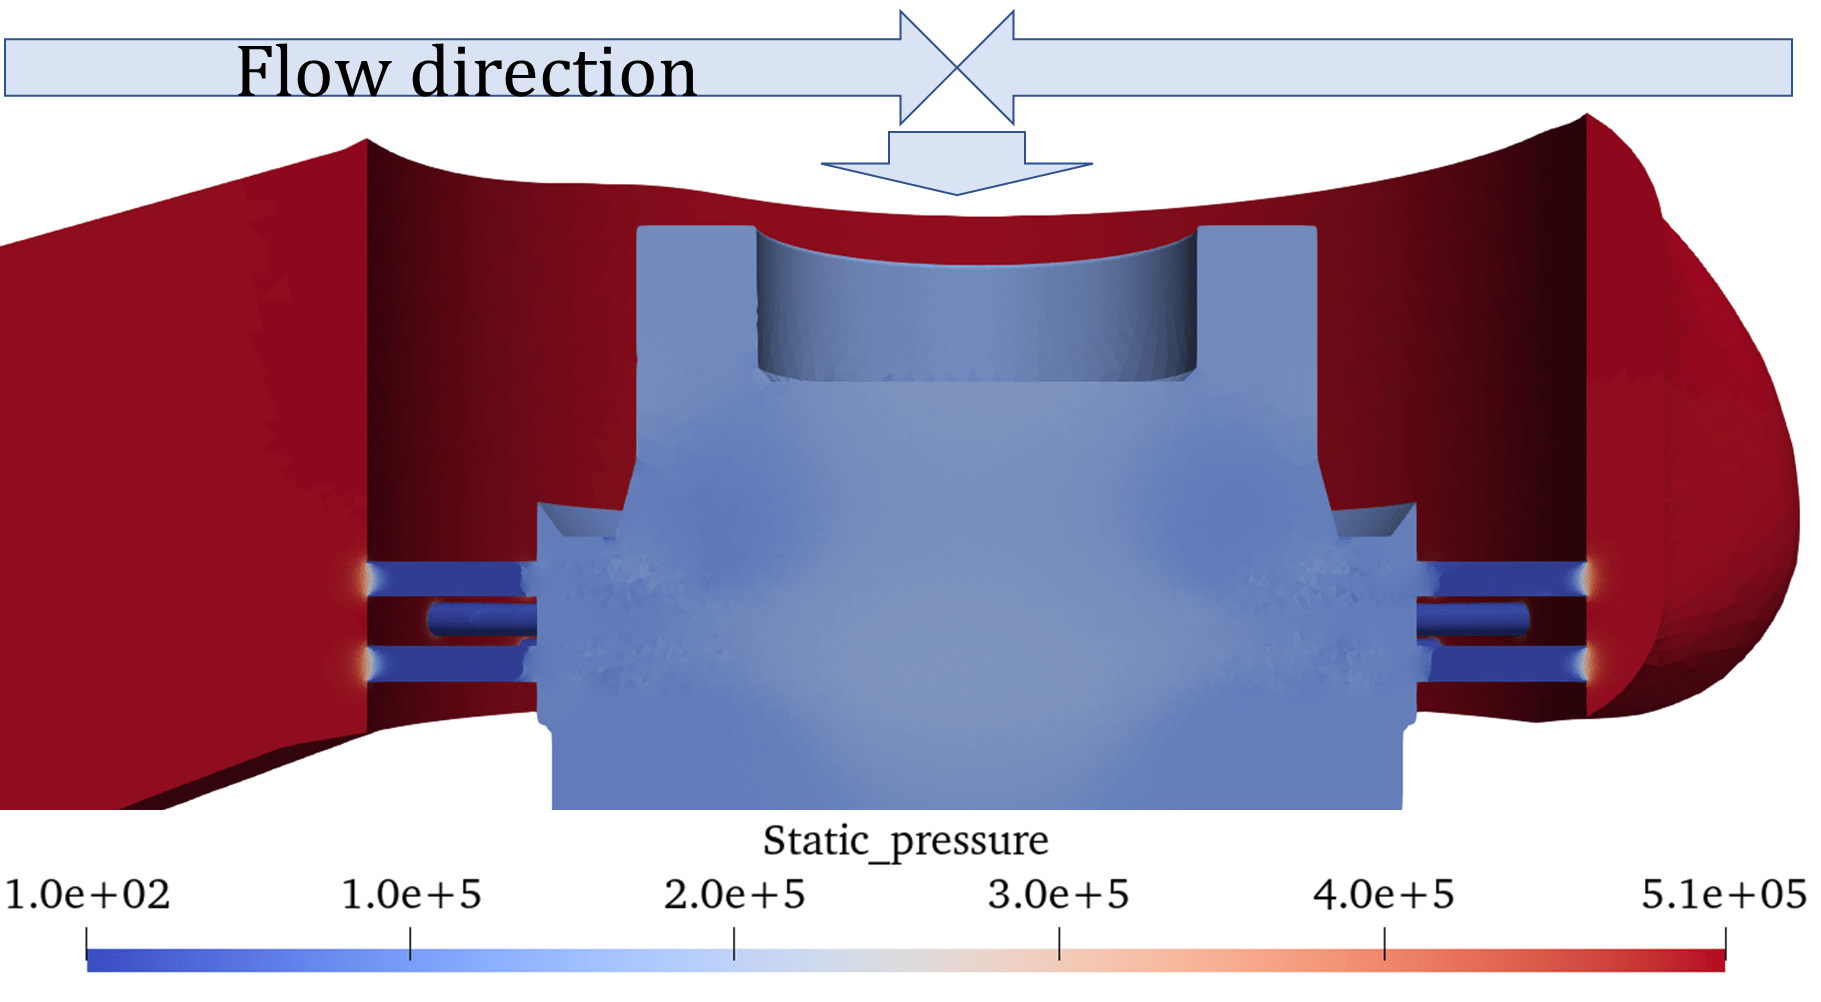
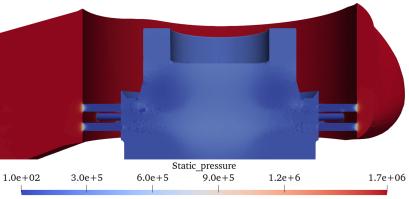
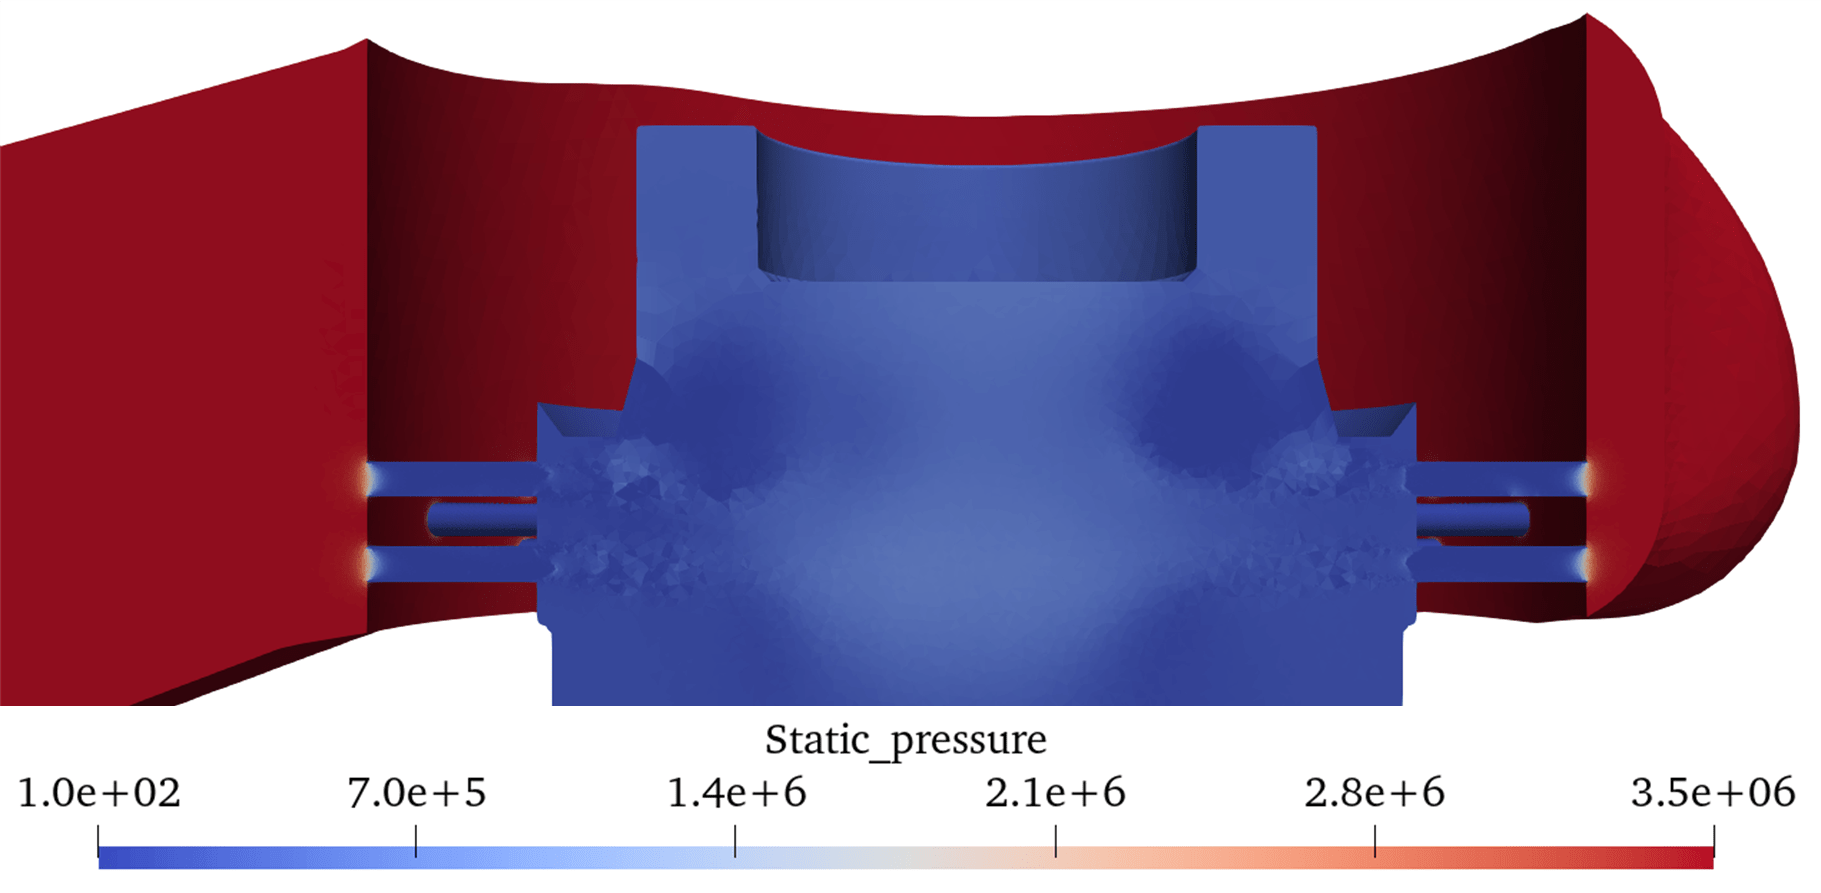
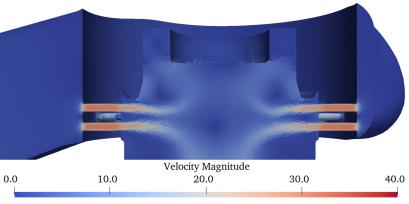
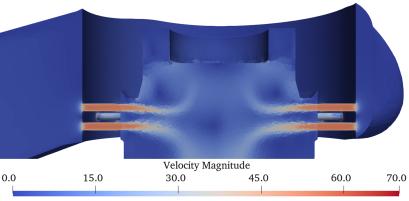
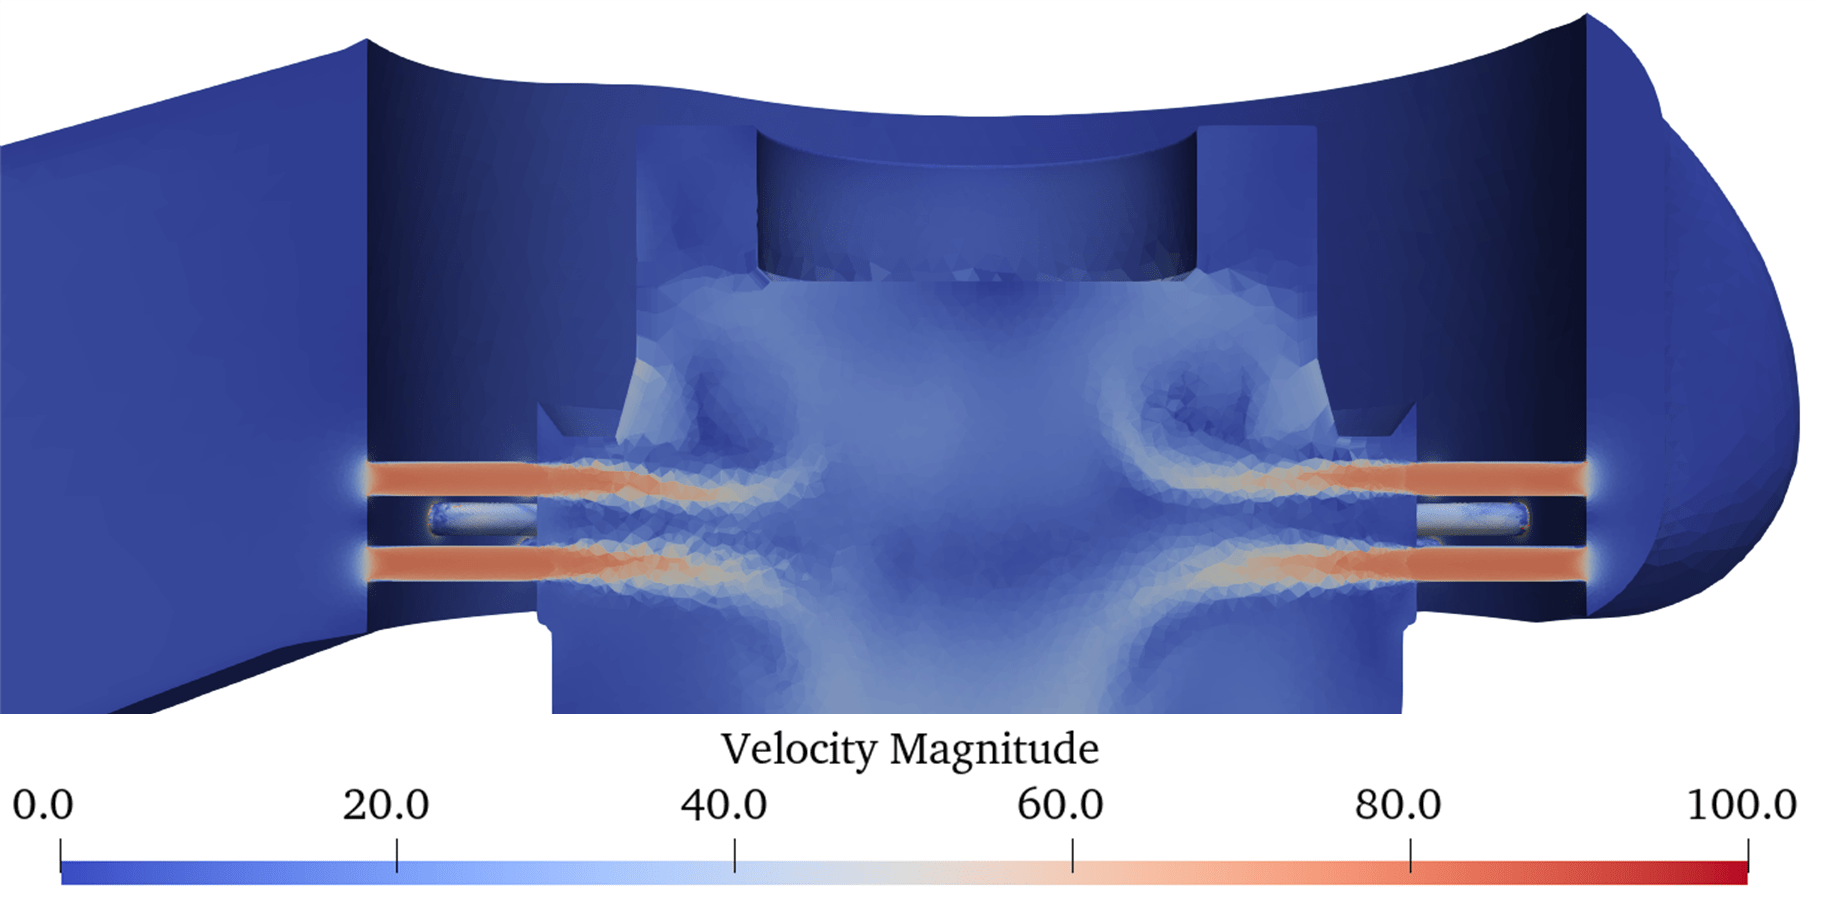
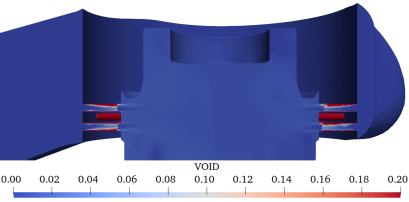
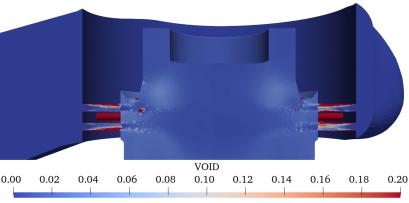
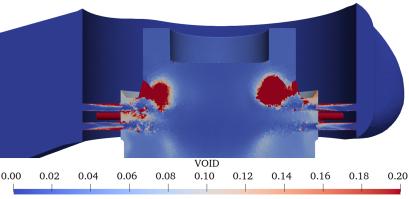
Figure. 6 shows the visualization results based on the vertical cross-sectional view of the control valve; specifically, it shows the CFD results for the three inlet pressures shown in Table 2. The outlet pressure was set to atmospheric pressure to achieve the maximum differential pressure. The pressure, velocity, void fraction, and void fraction in the enlarged view of Figure. 4 are shown for each inlet pressure. The pressure is reduced by the perforations. Regarding the velocity, it was observed that as the inlet pressure increased, the flow velocity both through the perforation and in its downstream region also increased. Areas with high void fractions were indicated on the perforated wall surface at an inlet pressure of 0.5 MPa [abs]. At an inlet pressure of 1.7 MPa [abs], the void fraction increased in the region beyond the perforations, and at 3.5 MPa [abs], a region with a higher void fraction was generated beyond the perforations, with high-void fraction regions clearly observed toward the valve-outlet side.
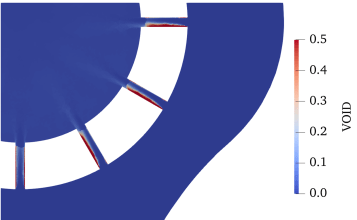
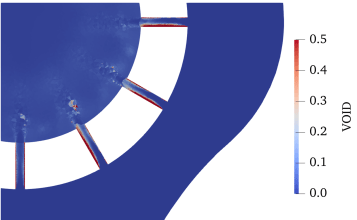
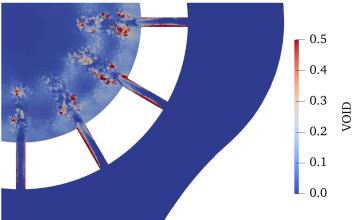
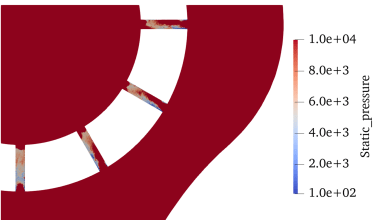
Figures. 7(a) and 7(b) show the side and top views of the control valve, respectively, whereas Figure. 7(c) shows the top view of the horizontal cross-section on the straight red line indicated in 7(a).
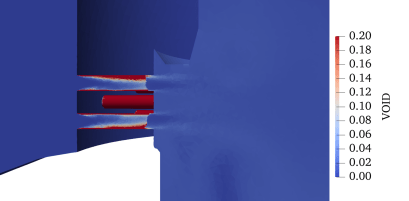
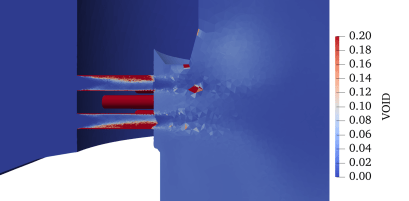
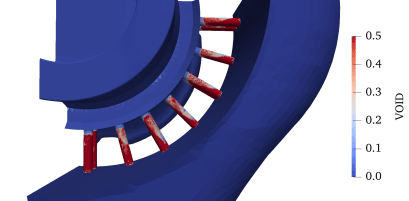
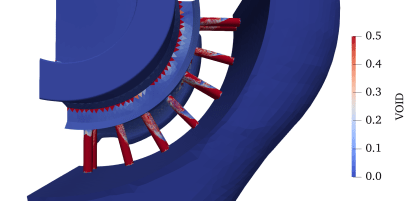
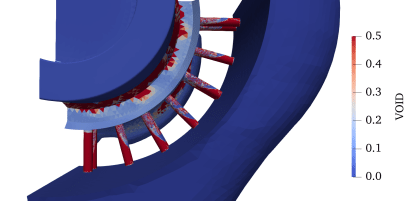
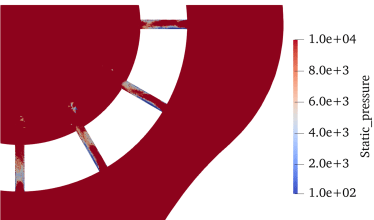
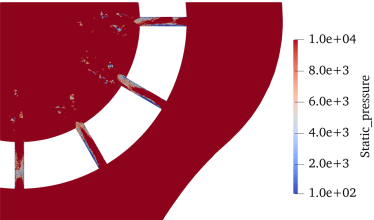
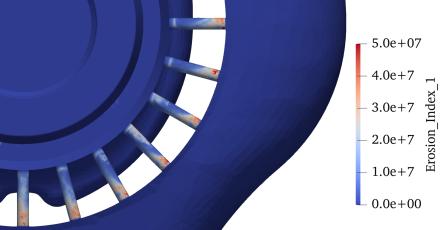
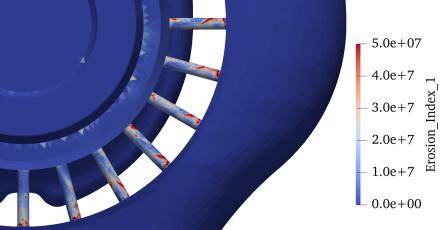
Figure. 8 shows the visualization results of the control valve from the top; specifically, it shows the CFD results for the three inlet pressures listed in Table 2. The outlet pressure was set to atmospheric pressure to achieve the maximum differential pressure, and the visualization results are shown in the area shown by a red square in Figures. 7(b) and (c). The top view of the void fraction shows that the void fraction on the wall inside the perforations was high under all three inlet pressures, and that an increase in the inlet pressure increased the void fraction on the cage wall on the outlet side of the perforation. Based on the horizontal cross-sectional diagrams of the void fraction and pressure, we speculated that separation occurred near the inlet side wall of the perforation, cavitation occurred owing to the pressure drop at the separation location, and the void fraction of the perforated wall increased. The results indicate that when the perforation angle was not parallel to the flow and the flow curved along the shape of the control valve body before entering the perforation, separation occurred primarily on one side of the wall surface.
Additionally, we used the erosion equation (as shown in Eq. (7)) proposed by Hasuike et al. to evaluate the occurrence of erosion [8]. In Eq. (7), , α, and P denote the cavitation generation period, void fraction, and pressure, respectively. Based on the visualization results, the erosion index in the perforations increased. Moreover, increasing the inlet pressure further increased the perforation erosion index as well as expanded regions with a high erosion index.
|
Inlet |
Pressure |
|
0.5 MPa |
 |
|
1.7 MPa |
 |
|
3.5 MPa |
 |
|
Inlet |
Velocity |
|
0.5 MPa |
 |
|
1.7 MPa |
 |
|
3.5 MPa |
 |
|
Inlet |
Void fraction |
|
0.5 MPa |
 |
|
1.7 MPa |
 |
|
3.5 MPa |
 |
|
Inlet |
Void fraction (Enlarged view) |
|
0.5 MPa |
 |
|
1.7 MPa |
 |
|
3.5 MPa |
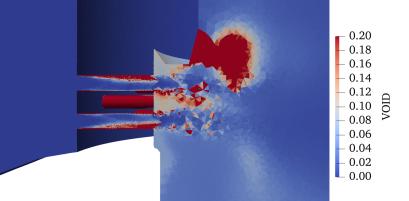 |
Figure 6. Vertical cross-section view for each inlet pressure.
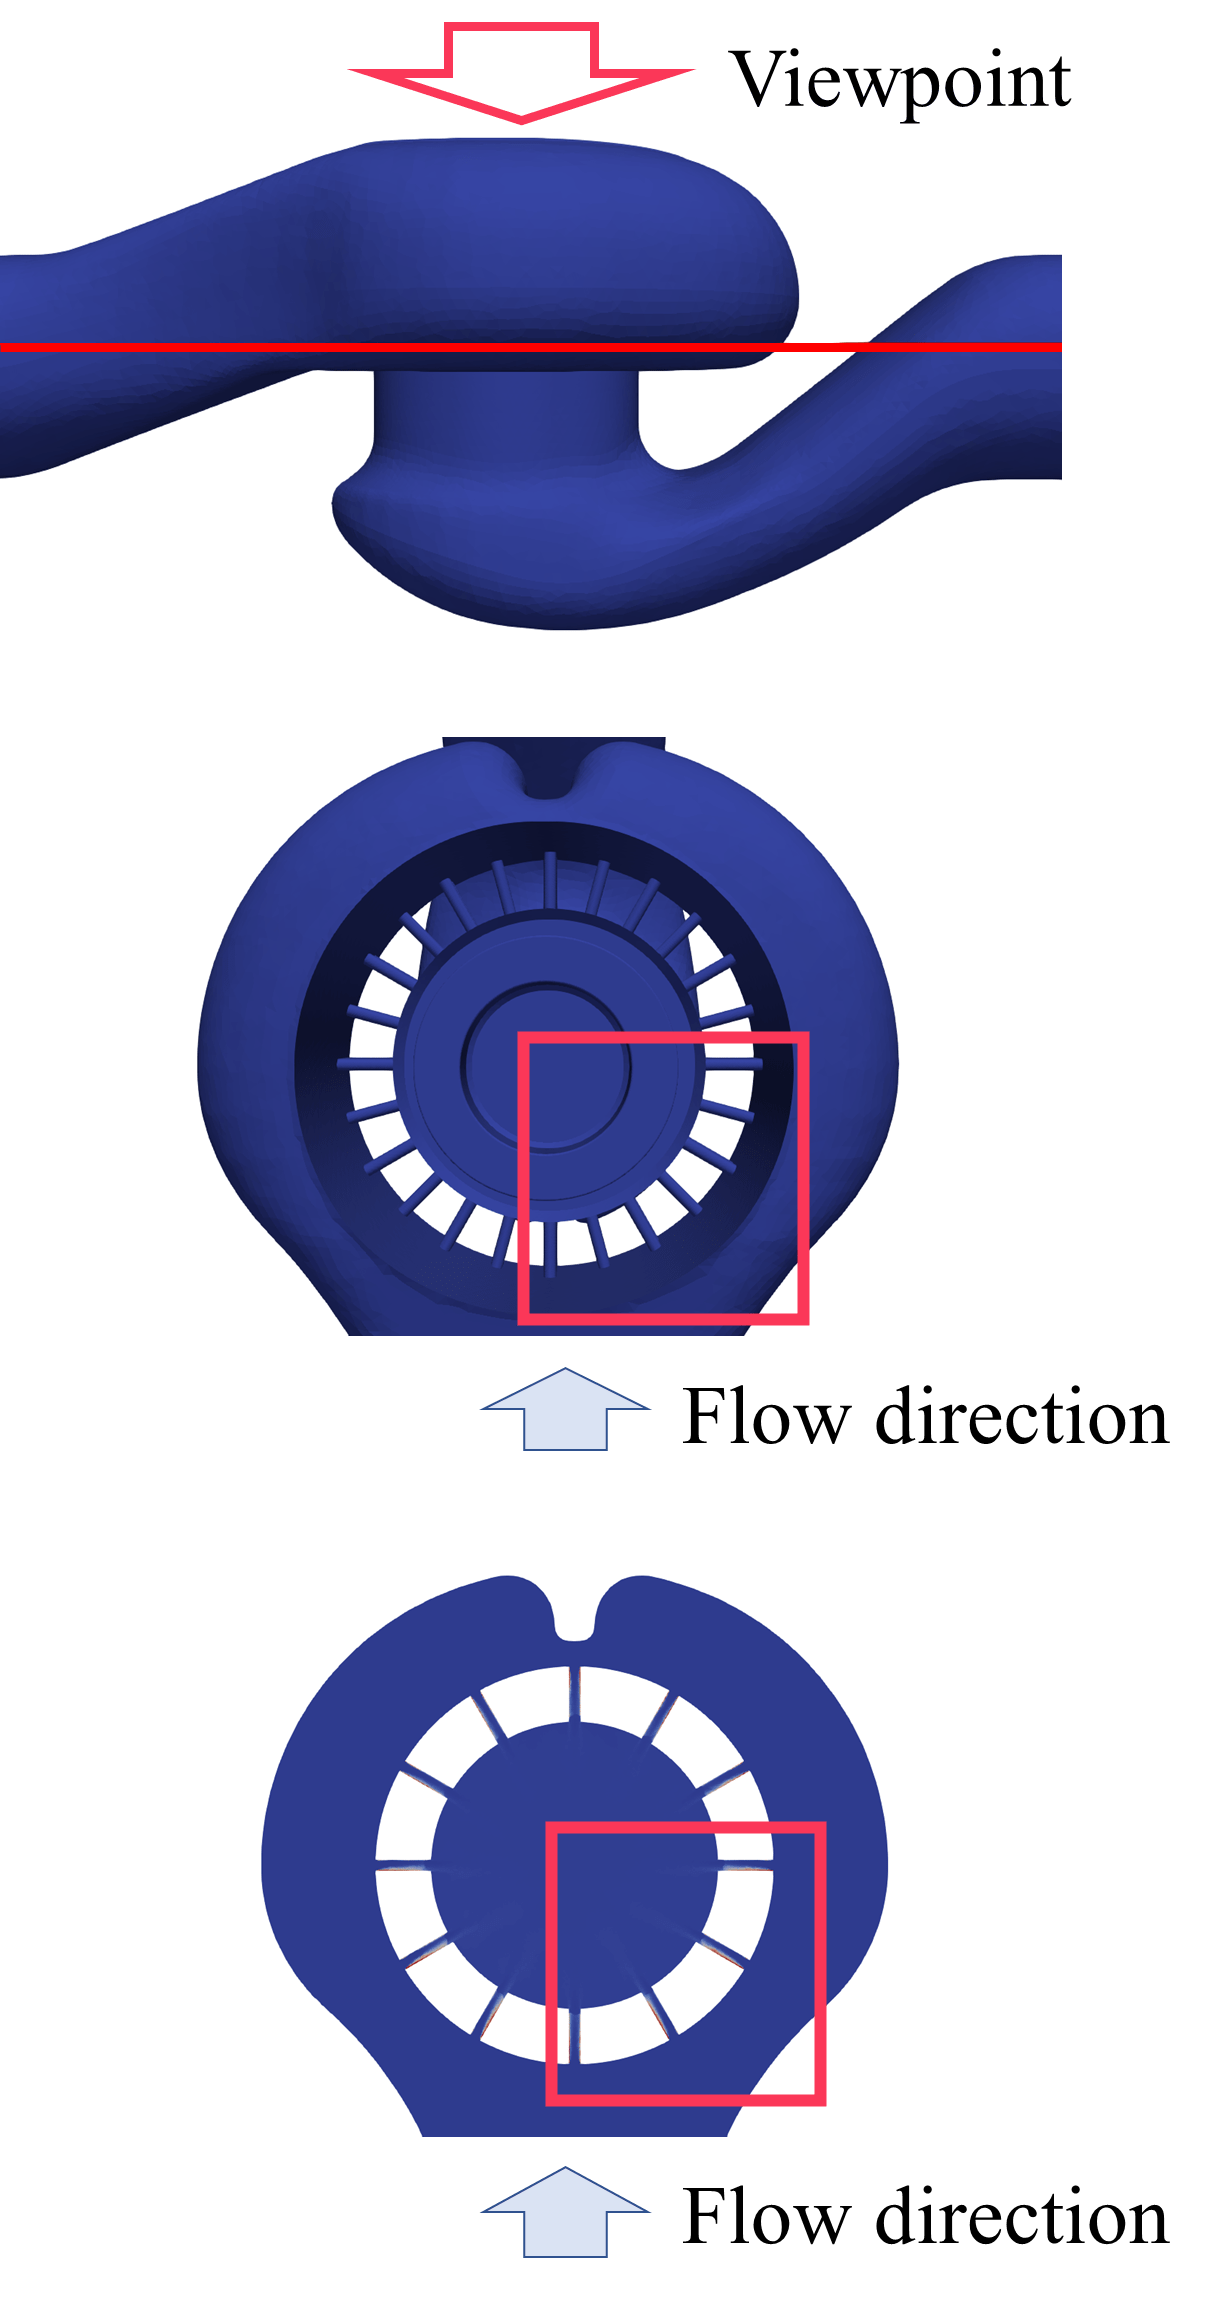
(c) Horizontal section at red line of Figure. 7(a).
Figure 7. Schematic illustration of cross-section.
|
Inlet |
Void fraction |
|
0.5 MPa |
 |
|
1.7 MPa |
 |
|
3.5 MPa |
 |
|
Inlet |
Void fraction (Horizontal cross section) |
|
0.5 MPa |
 |
|
1.7 MPa |
 |
|
3.5 MPa |
 |
|
Inlet |
Pressure (Horizontal cross section) |
||
|
0.5 MPa |
 |
||
|
1.7 MPa |
 |
||
|
3.5 MPa |
 |
||
|
Inlet |
Erosion index |
|
0.5 MPa |
 |
|
1.7 MPa |
 |
|
3.5 MPa |
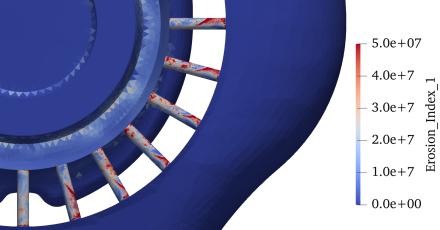 |
Figure 8. Comparison of erosion index results for each inlet pressure.
4. Conclusion
In this study, the flow characteristics of a control valve using a single-stage resistance perforated cage were evaluated via CFD simulation under varying inlet pressures. The results obtained were as follows:
- When the outlet pressure was set to atmospheric pressure, increases in the inlet pressure resulted in the void fraction increasing up to the outlet area of the perforation.
- In perforations where the angle was not parallel to the flow and the flow curved along the shape of the control valve body before entering, the void fraction on one side of the perforation wall surface was high.
- Increases in the inlet pressure resulted in regions with a high erosion index expanding from the inlet side to the entire perforation.
Acknowledgements
A This work used computational resources of the Supercomputer Fugaku provided by RIKEN through the HPCI System Research Project. (Project ID: hp210111)
References
[1] H. Gao, W. Lin and T. Tsukiji, "Investigation of cavitation near the orifice of hydraulic valves Proceedings of the Institution of Mechanical Engineers," Part G: Journal of Aerospace Engineering, vol. 220, no.4, pp.253-265, 2006.
View Article
[2] H. Yaghoubi, S. A. H. Madani, M. Alizadeh, "Numerical study on cavitation in a globe control valve with different numbers of anti-cavitation trims," Journal of Central South University, vol.25, no.11, pp.2677-2687, 2018.
View Article
[3] C. Qiu, C. H. Jiang, H. Zhang, J. Y. Wu and Z. J. Jin, "Pressure Drop and Cavitation Analysis on Sleeve Regulating Valve," J. Processes, 7(11), 829, 2019.
View Article
[4] X. Liu, Z. Wu, B. Li, J. Wu, J. Zhao, Z. He, W. Li, C. Zhang and F. Xie, "Influence of inlet pressure on cavitation characteristics in regulating valve," Engineering Applications of Computational Fluid Mechanics, vo.14, no.1, pp.299-310, 2020.
View Article
[5] X.M. Liu, J. He, B.B. Li, C. Zhang, H.W. Xu, W. Li, F.W. Xie, "Study on unsteady cavitation flow and pressure pulsation characteristics in the regulating valve," Shock Vib., 2021, 10.1155/2021/6620087
View Article
[6] K. Saito, C. Youn, "Prediction of cavitation erosion occurring in a control valve using computational fluid dynamics (CFD)," FLUCOME2019, 2019
[7] Y.Saito, "Numerical analysis of unsteady vaporous cavitating flow around a hydrofoil," Fifth International Symposium on Cavitation (CAV2003) , Osaka, Japan, 2003
[8] N.Hasuike, S.Yamasaki, J.Ando, A.Okazaki, "Numerical Study on Cavitation Erosion Risk of Marine Propellers Operating in Wake Flow," Journal of the JIME, Vol. 46, No.3, pp 79-87, 2011.
View Article
[1] H. Gao, W. Lin and T. Tsukiji, "Investigation of cavitation near the orifice of hydraulic valves Proceedings of the Institution of Mechanical Engineers," Part G: Journal of Aerospace Engineering, vol. 220, no.4, pp.253-265, 2006. View Article
[2] H. Yaghoubi, S. A. H. Madani, M. Alizadeh, "Numerical study on cavitation in a globe control valve with different numbers of anti-cavitation trims," Journal of Central South University, vol.25, no.11, pp.2677-2687, 2018. View Article
[3] C. Qiu, C. H. Jiang, H. Zhang, J. Y. Wu and Z. J. Jin, "Pressure Drop and Cavitation Analysis on Sleeve Regulating Valve," J. Processes, 7(11), 829, 2019. View Article
[4] X. Liu, Z. Wu, B. Li, J. Wu, J. Zhao, Z. He, W. Li, C. Zhang and F. Xie, "Influence of inlet pressure on cavitation characteristics in regulating valve," Engineering Applications of Computational Fluid Mechanics, vo.14, no.1, pp.299-310, 2020. View Article
[5] X.M. Liu, J. He, B.B. Li, C. Zhang, H.W. Xu, W. Li, F.W. Xie, "Study on unsteady cavitation flow and pressure pulsation characteristics in the regulating valve," Shock Vib., 2021, 10.1155/2021/6620087 View Article
[6] K. Saito, C. Youn, "Prediction of cavitation erosion occurring in a control valve using computational fluid dynamics (CFD)," FLUCOME2019, 2019
[7] Y.Saito, "Numerical analysis of unsteady vaporous cavitating flow around a hydrofoil," Fifth International Symposium on Cavitation (CAV2003) , Osaka, Japan, 2003
[8] N.Hasuike, S.Yamasaki, J.Ando, A.Okazaki, "Numerical Study on Cavitation Erosion Risk of Marine Propellers Operating in Wake Flow," Journal of the JIME, Vol. 46, No.3, pp 79-87, 2011. View Article