Journal of Fluid Flow, Heat and Mass Transfer (JFFHMT)
ISSN: 2368-6111

Volume 11 - Year 2024 - Pages 255-263
DOI: 10.11159/jffhmt.2024.026
Backward-facing Step Flow in a Narrow Open Channel: Effects of Expansion Ratio and Reynolds Number
James Arthur1, Ben Hong1, Cesar Spadea1
1Bucknell University, Department of Mechanical Engineering
1 Dent Drive, Lewisburg, Pennsylvania, United States 17837
james.arthur@bucknell.edu; yyh001@bucknell.edu; cs082@bucknell.edu
Abstract - Backward-facing step (BFS) flow phenomena is present in several engineering systems. While extensive research efforts have been invested in BFS flows, cases associated with narrow channels are relatively few. In this work, we examine the turbulent flow field of a narrow open-channel BFS to understand the effects of expansion ratio and Reynolds number variations. The physical system is modeled in an experimental facility consisting of a channel flume with a backward-facing step of height h installed in the upstream section of the flow. With an aspect ratio of 4, a narrow BFS flow configuration was achieved. By varying the flow depth for different test cases, BFS flows of expansion ratio (ER) of 1.25 and 1.50 were tested. Additionally, open-channel turbulent flow was conducted through the flume at various Reynolds number (Re) between 2900 and 11,000. A planar particle image velocimetry technique was used to capture the flow around the recirculation region. The results show that increasing Re by nearly two-fold leads to the evolution of a multi-centered primary recirculation bubble and a secondary corner bubble; while maintaining the reattachment length. Further increment of the Re and ER by 50% and 20% respectively, results in a 16% enhancement of the reattachment length. The turbulent flow, on the other hand, suggests turbulent intensities and turbulent kinetic energy are influenced primarily by Re. Overall, these results suggest important differences between closed-channel and open-channel BFS flows on the one hand, as well as narrow and wide open-channel BFS flows on the other hand.
Keywords: Turbulent flow, Backward-facing step, Particle image velocimetry.
© Copyright 2024 Authors - This is an Open Access article published under the Creative Commons Attribution License terms. Unrestricted use, distribution, and reproduction in any medium are permitted, provided the original work is properly cited.
Date Received: 2024-02-06
Date Revised: 2024-07-23
Date Accepted: 2024-07-25
Date Published: 2024-08-30
1. Introduction
Flow over steps is prevalent in many engineering systems. For instance, in aeronautics, telescopic airplane wings featuring stepped configurations along their chord enable necessary degrees of freedom for wing morphing. However, such steps render the wings susceptible to complex flow features. Similarly, many road vehicles incorporate step-like structures at their rear, subjecting the flow behind them to step flow phenomenon. Beyond external applications, internal flows in confined pathways, such as those in check valves and combustion chambers, also encounter step conditions. Due to such ubiquity of application of step flows, understanding their dynamics is crucial for effective control and prediction of flow behaviors. This study focuses specifically on backward-facing step (BFS) flows to contribute to this understanding.
The fundamental characteristics of flow past a backward facing step are well-documented in the literature [1]. Upon passing the step, the flow encounters a distinct separated zone where an adverse pressure gradient triggers a wake flow characterized by a slender and expanding separated shear layer. This creates a zone of flow reversal (or recirculation) situated between the shear layer and the walls. Typically, this recirculation region features one or more separation vortices, often identified as recirculation bubbles. The shear layer curves downwards due to the pressure gradient, leading to the eventual reattachment. It is important to note that the flow separation characteristics affect the differential pressure requirements as well as the overall heat transfer performance of the flow system. Consequently, considerable research efforts have been dedicated to understanding this phenomenon.
An important factor for the complex nature of a BFS flow lies in the numerous configurations and parameters influencing BFS flows. However, the research covered in the literature has been predominantly focused on wide channel systems [2]-[4]. Such channels have an aspect ratio (i.e. AR, which is that channel width-to-step-height ratio) greater than 10. Using such a configuration (channel of AR = 20), Darmawan [5], for example, investigated the reattachment length (i.e. distance along the flow from the step to where re-attachment occurs) of swirling flow passing a BFS using computational fluid dynamics (CFD). That study covered Reynolds numbers ranging from 4,000 to 10,000. Findings indicated a direct relationship between Reynolds number and reattachment length, where an increase in Reynolds number correlated with an increase in reattachment length. While these findings contribute significantly to understanding BFS flows, narrow channel configurations have received relatively less attention. This paper seeks to address these knowledge gaps by examining the recirculation characteristics of narrow channel flows.
Advancements in computing power have facilitated an increase in simulations and other modeling techniques [2]-[5]. Computational models play a crucial role in the study of physics of flow, but they have prominent limitations. For instance, in the previously described work by Darmawan [5], CFD was employed to investigate BFS flows. While the results provided valuable findings, their validity lacked rigorous confirmation without experimental comparison. In another case study, Hasan et al. [6] applied a zero-net-mass-flux system to implement active flow control downstream of a BFS. Simulations were conducted through the use of OpenFOAM (flow solver), incorporating three jets for flow manipulation. By comparing the results with a reference case (absence of jets), they demonstrated significant reduction in the recirculation area through effective flow control implementation. However, due to the novel nature of the experiment, neither the reference nor other cases were rigorously validated. Physical experiments therefore remain crucial for validating simulations and software tests effectively.
There exists a number of studies on BFS flows in narrow channels. However, many of these studies do not vary the expansion ratio (i.e. ER, the ratio between the depth of the channel before the step and after )[2], [4], [5], [7], [8] or Reynolds number [2], [4], [8]. In one noteworthy study, Uruba and Jonáš [8] analyzed three-dimensional BFS flows using test data obtained through particle image velocimetry. The analysis was conducted utilizing a single Reynolds number, expansion ratio, and aspect ratio. While informative, this study, and others, are limited to singular data points and do not establish trends. Moreover, very few papers simultaneously vary both expansion ratio and Reynolds number. Even for those few cases, research work appears to be focused on high Reynolds number flows [8]-[10]. In a relevant study, Nadge and Govardhan [10], conducted BFS flow studies using vastly different aspect ratios and Reynolds numbers. They investigated the structure of mean separation bubbles in BFS flows using PIV. They observed that both Reynolds number and expansion ratio significantly affect the bubble's structure, with higher Reynolds numbers leading to distinctive separation bubble structure that remains largely unaffected by these parameters. While these findings are significant, they are primarily applicable to scenarios involving high Reynolds numbers. Consequently, the relative effects of expansion ratio and Reynolds number for BFS flows in narrow channels are not well understood, particularly when the Reynolds numbers are low. More recently, Arthur [11] used particle image velocimetry to demonstrate that BFS flows in narrow channels exhibit significant effects on the sidewalls, along with asymmetrical characteristics in reattachment length, vorticity, and turbulence statistics across the spanwise plane. While such work has provided some insight into BFS flows in narrow channels, it does not cover cases where the flow is in an open channel.
In summary, there remains a gap in the literature for the study of Reynolds numbers and expansion ratio for low Reynolds number open narrow-channeled flows over a BFS. This is what this paper seeks to address. The hypothesis underlying this research is that compared to closed channels, recirculation flow characteristics would be more confined in open channels. The use of a two-dimensional, two-component PIV system is expected to yield significant information to map out the flow patterns and describe general flow features.
With the foregoing in view, the objective of this study is to investigate the influence of Reynolds number and expansion ratio on open, narrow-channeled flow over a BFS. To achieve the objectives of this research, the physical flow was modeled in an experimental setup comprising of a flume equipped with a BFS. The step was positioned in the upstream section of the flow, and configured in such a way that the expansion ratio could be modified from 1.25 to 1.50. Additionally, open channel turbulent flow was conducted through the flume at various flow rates, causing the Reynolds number, based on the step height and local maximum velocity to vary from ~3000 to 11,000. A planar PIV technique was employed to obtain detailed flow velocities around the recirculation region of the flow.
This paper is structured as follows. The following section, Section 2, outlines the experimental techniques used to measure the effects of Reynolds number and expansion ratio in a narrow channel and the methods of analysis used to interpret the experimental results. Section 3 presents the results of the experiment and provides some discussion of the implications of the results. Finally, Section 4 summarizes the key findings of the study, and highlights its contributions to the field.
2. Experimental System and Measurement Procedure
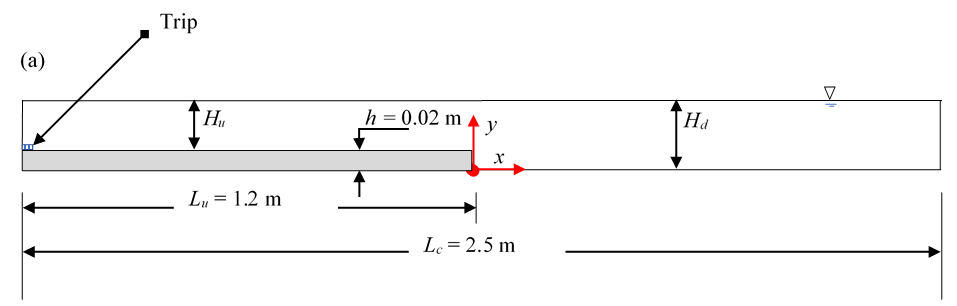
The flow system used in this work consisted of a TecQuipment open flow hydraulic transport flume, and a model step plate. The flume works by recirculating water pumped from a reservoir through a flow conditioner, a transparent walled test section, and then back into the reservoir. By using a valve at a location downstream of the pump, the flow rate could be precisely modulated. The test section of the flume is of length Lc = 2.5 m, and width W = 0.08 m. With the aid of a gate at the exit of the test section, the downstream depth Hd of the flow within the section could be varied from 0.06 m to 0.10 m. A smooth acrylic plate of height h = 20mm, was used to model the step. This plate was taped onto the bottom wall of the channel, and at the upstream section of the channel. With such an installation, geometric stepped conditions of expansion ratio ER of 1.25 and 1.50 could be set when required. For each condition, a channel aspect ratio AR of 4 was maintained so as to assure a narrow-channeled flow section [11]. A rapid development of turbulent flow was induced by the placement of a triad of rods at the entry into the test section. The coordinate system used in this test is shown in Figure 1. Relative to the flume, the directions x, y, and z represent the directions along the stream, wall-normal, and the span, respectively. The origins of each direction are respectively located at 1.2 m downstream off the flow entry, the bottom wall of the downstream section, and in the mid-span of the channel.
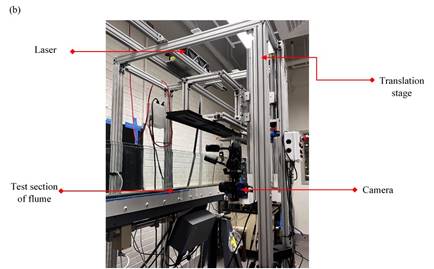
A two-dimensional two-component particle image velocimetry (PIV) system supplied by LaVision Inc. was employed to measure whole field velocity data. The system is identical to that used in ref. [11]. The arrangement of the PIV system in relation to the flume is shown in Figure 1(b). For a water flow seeded with silver-coated hollow glass spheres of mean diameter 10μm and specific gravity 1.4, illumination was achieved using laser of 532nm wavelength and 200 mJ/pulse generated by a Quantel Evergreen Nd:YAG Dual Cavity system. This light was then transformed into a 1.5-mm sheet via a system of cylindrical lenses. Snapshots of images were recorded using a 12-bit charged couple device camera (Imager SX 6M). This camera, equipped with a 2752 × 2200-pixel array and 7.4 μm pixel pitch, was coupled to a 50-mm focal length Nikon lens. The lens was in turn fitted with an orange filter of 532 nm ± 10 nm band-pass wavelength. For each test, a field of view of 90.2 mm × 72.1 mm was used in the streamwise and wall-normal directions respectively, yielding a scale factor of 30.52 pixels per mm. With the aid of a programmable timing unit, the triggering of the laser and the recording rates of the camera was synchronized. Using a PIV software (DaVis-10.2.1) installed on a dual processor computer with a 32-gigabyte random access memory, the PIV system was controlled, including the transfer of images to the hard drive.
In this work, four thousand instantaneous image pairs were captured. These images were processed using a multi-pass cross-correlation algorithm via DaVis-10.2.1. The processing involved an initially set interrogation area size of 64 pixels × 64 pixels. This culminated in vectors with each interrogation window subdivided into 32 pixels × 32 pixels with 75% overlap after several iterations and an outlier-removal validation step. After this processing, the resulting distances between neighboring vectors was 0.26 mm (= 0.01h) in physical units. This resolution is comparable with what was attained in ref [11], and thus sufficient to capture small scales of flow. The processed instantaneous velocity vectors were further analyzed using a MATLAB code to obtain time-averaged velocities, turbulence intensities, and Reynolds normal stresses in the streamwise and wall-normal directions. These are respectively indicated by (U, V), (u, v), and (u2, v2). Additionally, the Reynolds shear stress -uv was also computed through a similar means. The uncertainties of these velocity measurements were assessed following the work of Wieneke [12]. This error analysis is based on a statistical analysis of the correlation process associated with the differences in intensity pattern in PIV image pairs. Accordingly, errors of (U, V), (u, v), (u2, v2), and -uv are approximately ±1.8%, ±2.3%, ±2.5%, and ±3.5% of their respective peak values. These uncertainty limits are rated at 95% confidence level.
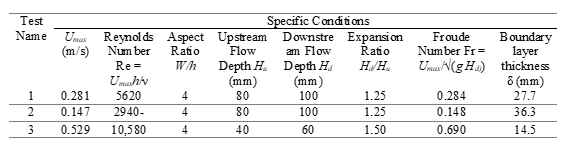
A summary of the test conditions is shown in Table 1. Overall, three series of tests were conducted for each of BFS flow configurations. For convenience, they are named Test 1, Test 2 and Test 3. For each test, the sections upstream of the step, at the recirculation region, and immediately beyond that, were captured in the midspan plane (i.e., z = 0). This was done by fixing the laser and camera on a translation stage, and moving both (simultaneously) along the stream with a least count of ±0.5 mm. By modifying geometric and flow conditions in Tests 1, 2, and 3, the narrow open-channeled flow behind a BFS could be tested for ER of 1.25 and 1.50, and AR of 4. The flow conditions were tested for a range of Reynolds number (based on local maximum mean streamwise velocity Umax at x/h = ‒1 and step height h) of 5620 < Re < 10580, Froude number (Fr = Umax/√(g Hd) where g is the acceleration due to gravity) of 0.148 < Fr < 0.690.
3. Results and Discussion
In this section, we present and discuss results by first focusing on the qualification of the entry flow and the extent of the recirculation zone. This is followed by an examination of the mean flow and turbulent field of the recirculation region as well as the downstream locations that follow immediately.
3. 1. Entry Flow
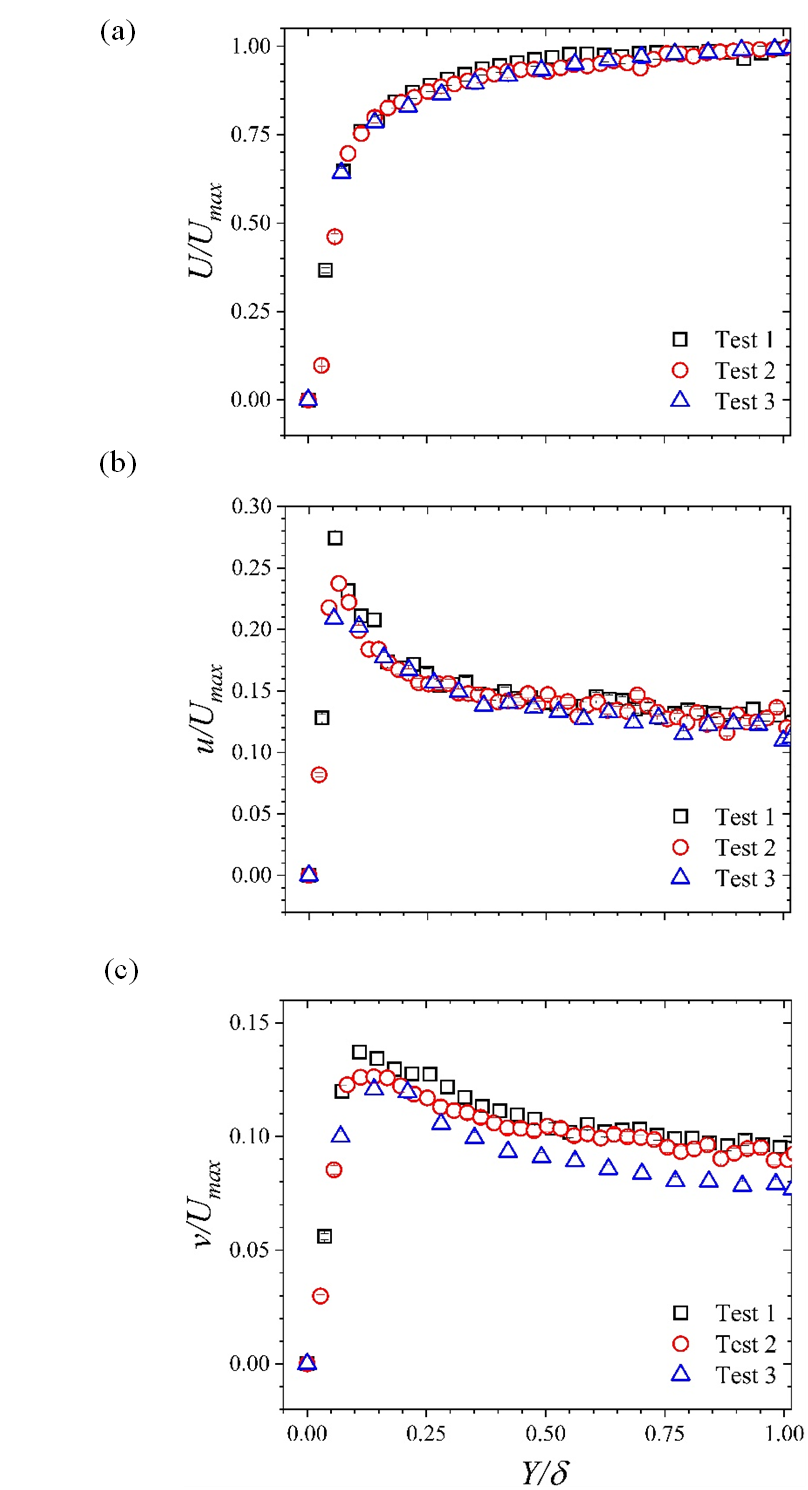
In Figure 2, we present the entry flow data in terms of the wall-normal variations of the mean streamwise velocity U, streamwise turbulence intensity u, and the wall-normal turbulence intensity v. These plots are normalized using the local maximum mean streamwise velocities (Umax) and the boundary layer thickness δ. They were extracted at x/h = ‒1, just upstream of the shoulder of the step. The mean streamwise velocities indicate a boundary layer with thickness that decreases with the Reynolds number Re. This is in accordance with what has been observed in other open-channel flows over smooth walls [12]. It is also instructive to note that the plots also collapse onto each other. The plots of turbulence intensities show that the relative background turbulence level is ~14% and 10% in the streamwise and wall-normal directions respectively.
3. 2. Recirculation Length
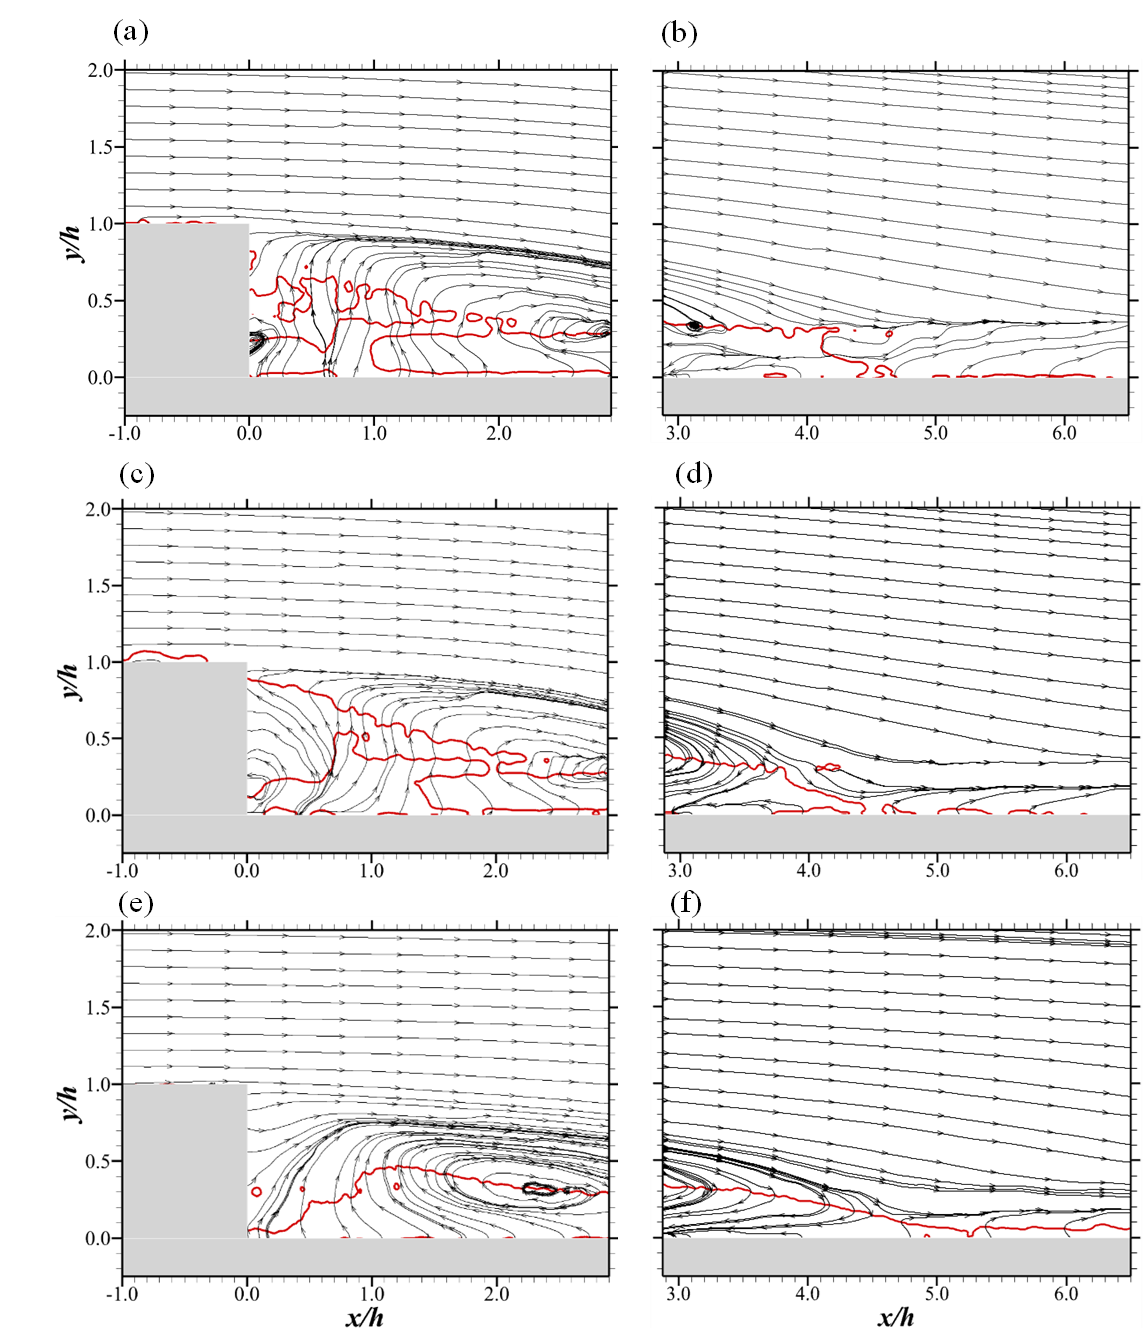
An important aspect of such a study as this, is to analyze the recirculation zone so as to measure its length and characteristic bubbles. This is demonstrated through the streamlines and isopleths shown in Figure 3. It is important to note that in this work, the reattachment length Lr was determined as an average linearly extrapolated location of the zero streamwise mean velocity contour line intersecting the primary recirculation bubble, and curving toward the wall [11]. The uncertainty limit of Lr is estimated to be ±0.15h.
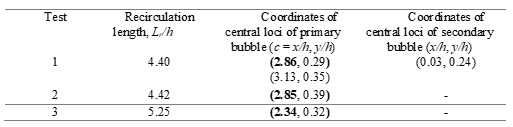
As expected, the streamlines of mean velocity in Figure 3 show the existence of a recirculation region just behind the step. However, increasing Re by nearly two-fold (i.e., from Test 2 to Test 1) leads to the clear development of a multi-centered primary recirculation bubble, and a secondary corner bubble. The summary results of Table 2 also indicate that regardless of these significant changes, the reattachment length is fairly constant at ~4. This apparent independence of the reattachment length with Re changes was also observed in the wide channel tests of Nakagawa and Nezu [13]. These observations indicate that low Re changes do not affect the recirculation length, insofar as the aspect ratio of the open-channel turbulent flow behind a BFS remains constant. However, this is not necessarily so with closed channel flows of comparable Re range. It is also important to note from Figure 2 and Table 2 that further increment of the Re (from Test 1 to Test 3) leads to an elimination of the corner bubble, such that the separated flow is marked by a single bubble with a clear center. By increasing both Re and ER by 50% and 20% respectively, the reattachment length is enhanced by 16%.
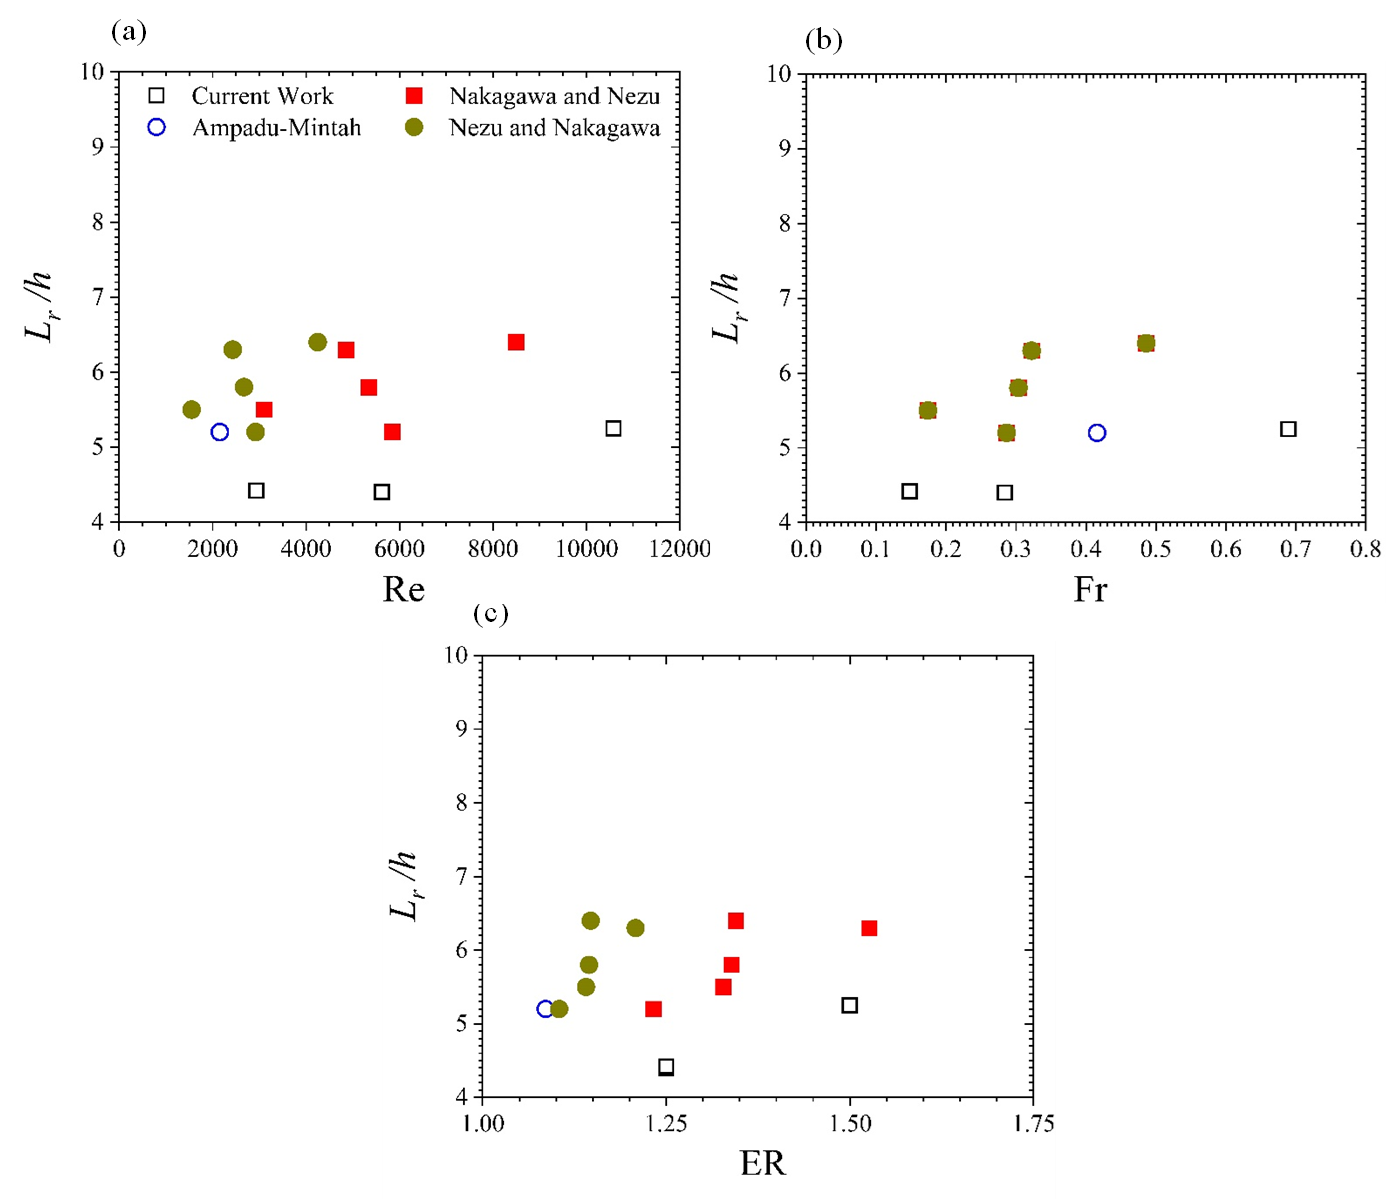
In order to measure the current recirculation length results relative to other open-channel flow results, we present one-dimensional plots in Figure 4. In that figure, we compare our narrow-channeled BFS data with those of wide channel BFS flow studies of Nakagawa and Nezu [13], Nezu and Nakagawa [14] and Ampadu-Mintah and Tachie [15]. Our data is not enough to provide any definite trends in terms of variations of Reynolds number Re, Froude number Fr, and expansion ratio ER. However, these results show that for open-channel flows, the recirculation region of narrow channel BFS flows is shorter than that of wide channels by over 20%.
3. 3. Mean Flow Data
Based on the streamline plots in Figure 3, we plotted the wall-normal variations of the mean streamwise, wall-normal and spanwise vorticity in Figure 5. These plots were extracted at the x/h =1 (i.e., a location within the recirculation region, at a distance full step downstream of the step), x/h = c (i.e., the streamwise component of the locus at the center of the primary recirculation bubble), and at x/h = 6 (i.e., a location outside of the recirculation bubble, and at six step heights downstream of the step).
The two streamwise mean velocity profiles within the recirculation region show a flow structure that may be stratified into three regions. There is: (1) a region of low (or near-zero) velocity at y/h < 0.5, which is expected immediately behind the step; (2) a region of steep velocity gradient (consistent with a separated shear layer) at 0.5 ≲ y/h ≲ 1.25; and (3) a high flow region (which may be interpreted as the outer region sufficiently far away from the effects of the step flow) at y/h > 1.25. For the three test cases, the plots collapse onto each other at y/h ≲ 1.25, but diverge in the outer region. The profiles extracted at x/h = 6, on the other hand, show all tests undergoing a process of boundary layer recovery. In summary, at each location of extraction (i.e. x/h =1, c, 6), the streamwise mean velocities for all the test cases do not show significant differences.
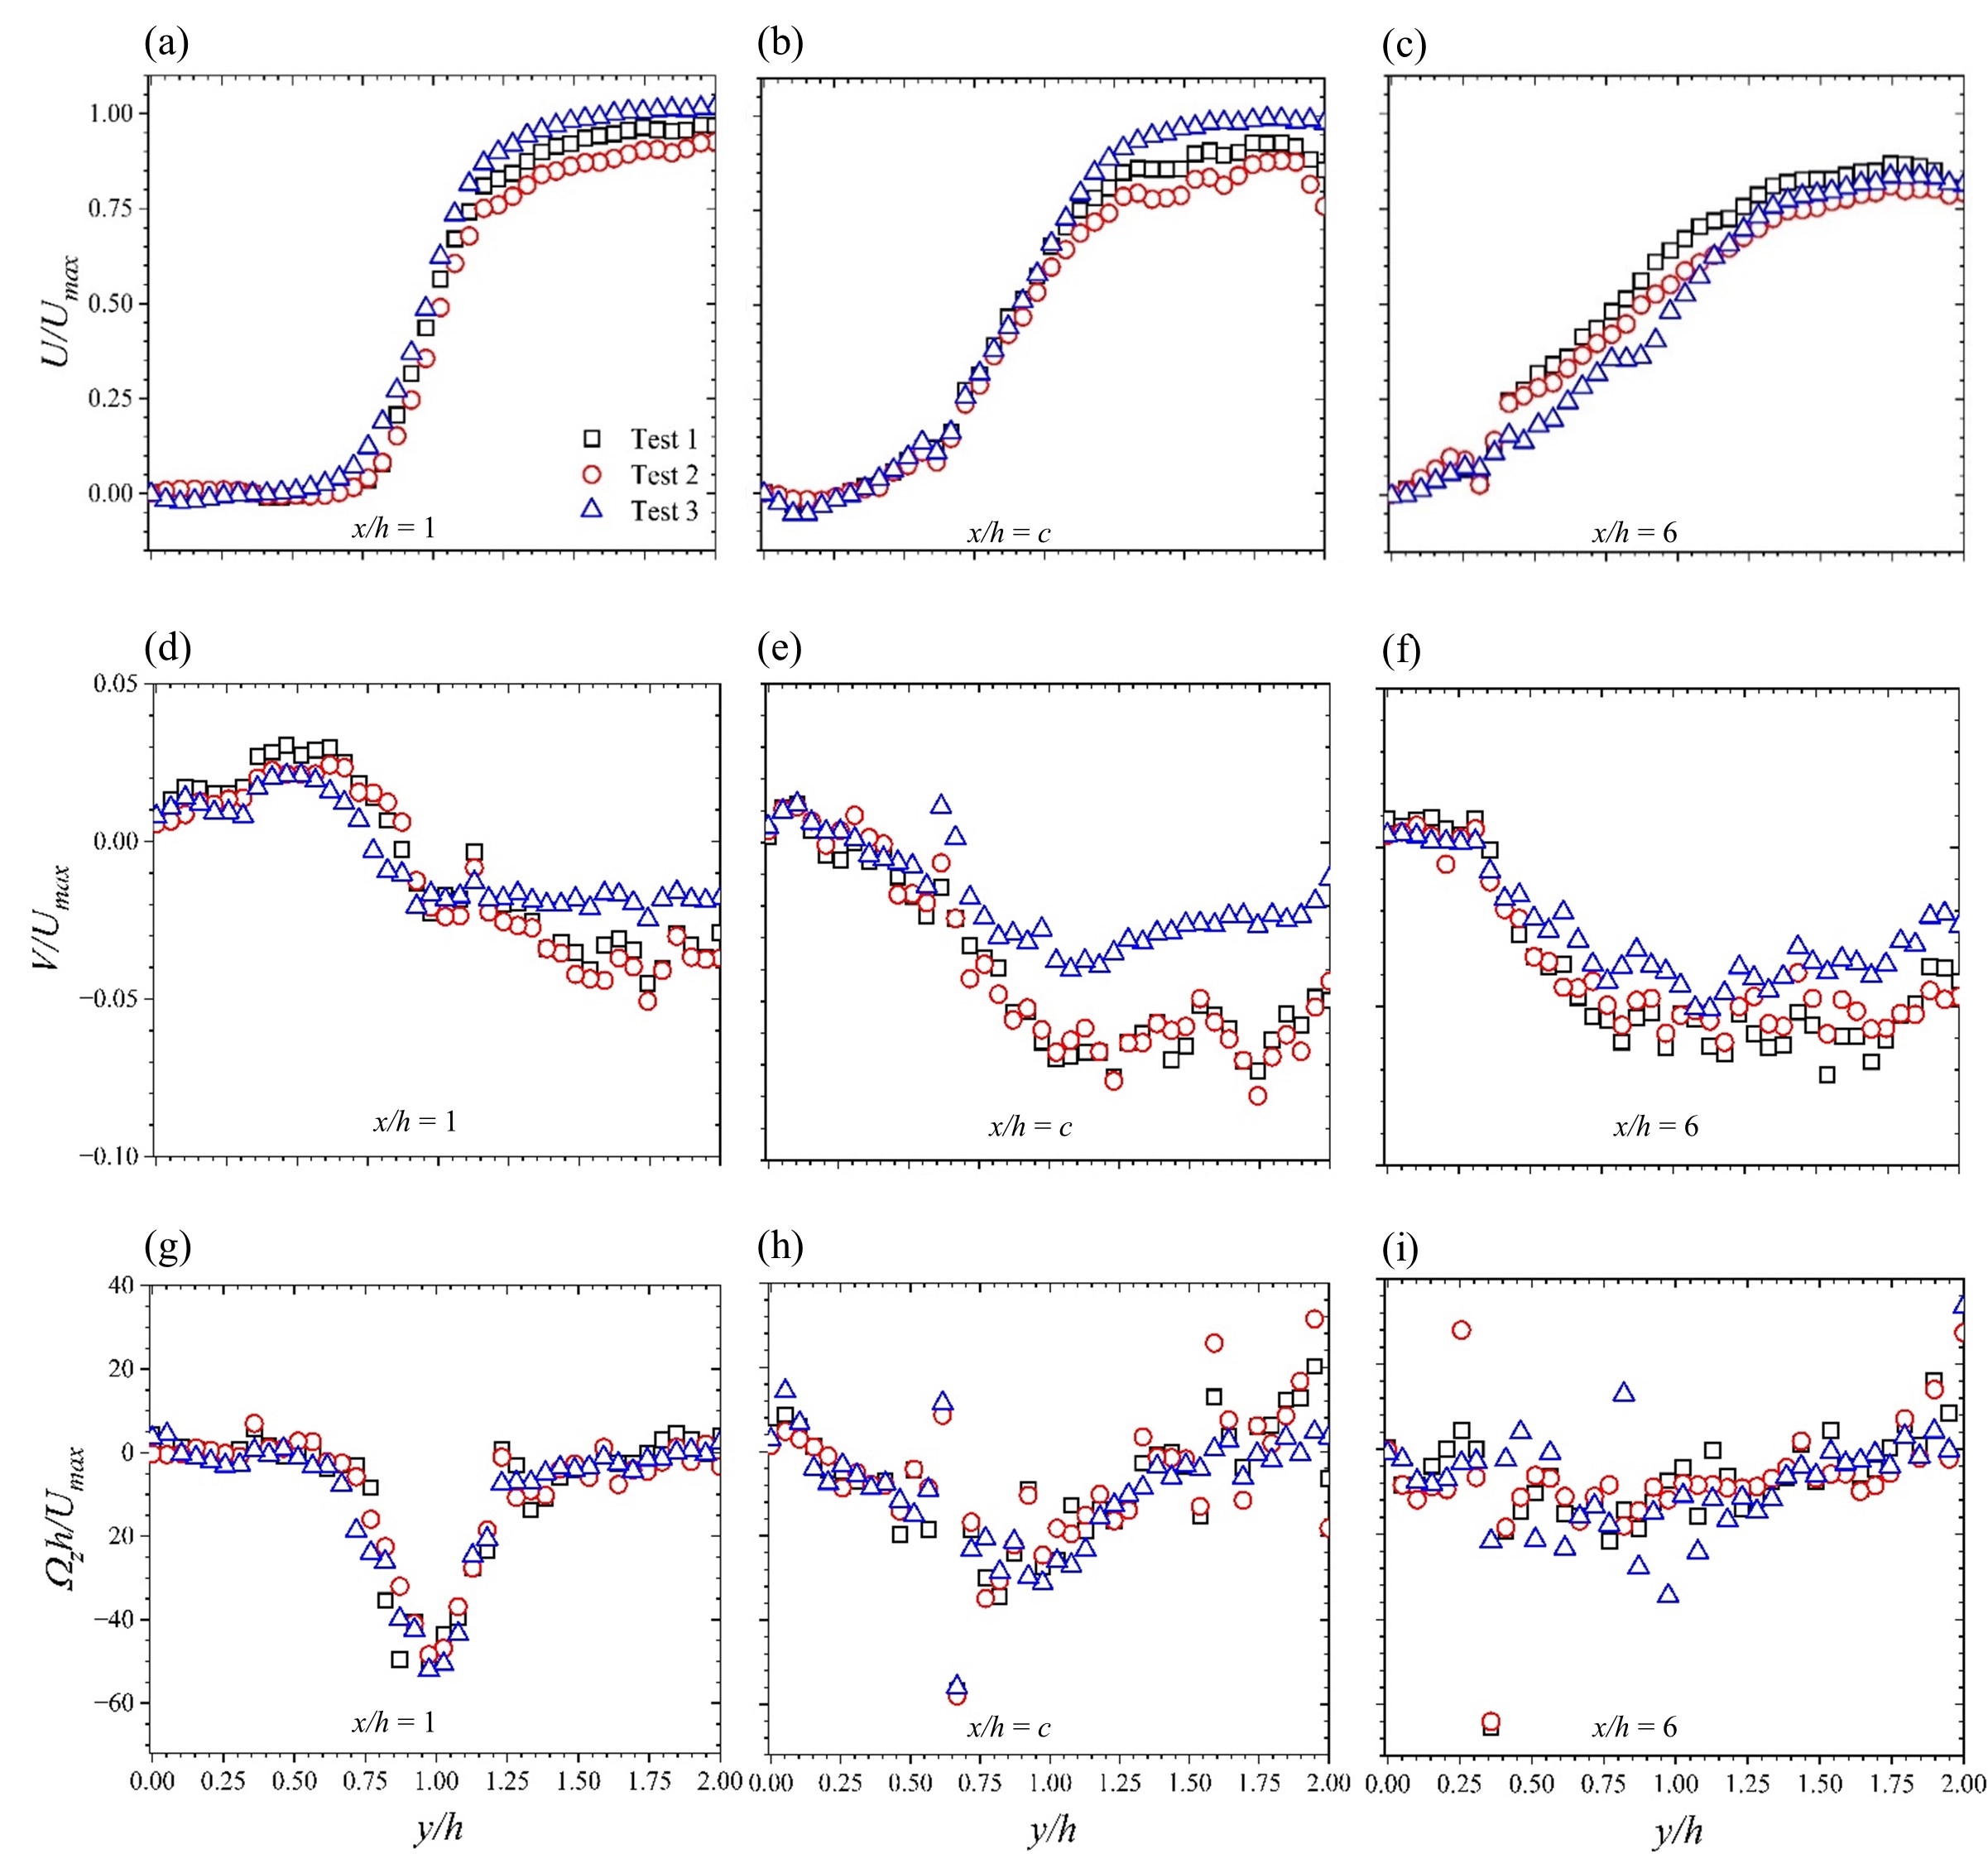
However, the wall-normal mean velocity profiles are different. They rather show marked distinctions between the test cases – specifically at x/h = c. The results of Test 3 diverge from Tests 1 and 2, at the separated shear layer region, indicating that the reason for the difference in the 16% enhancement of reattachment length (from Tests 1 or 2, to 3) stems from the wall-normal mean velocity at that layer. For Test 3, the wall-normal mean velocities move downward at a lower rate, compelling the reattachment of the flow further downstream.
For the mean spanwise vorticity plots, there appears to be some agreement in all three test cases (albeit with some scatter). However, some of the most intense vorticities occur at the shear layer immediately downstream of the step, where fluid rotation is prominent. Negative vorticities are registered there due to relatively large mean streamwise velocity gradient in the wall-normal direction (∂U/∂y) compared with the wall-normal mean velocity gradient in the streamwise coordinate (∂V/∂x).
3. 4. Turbulent Flow Statistics
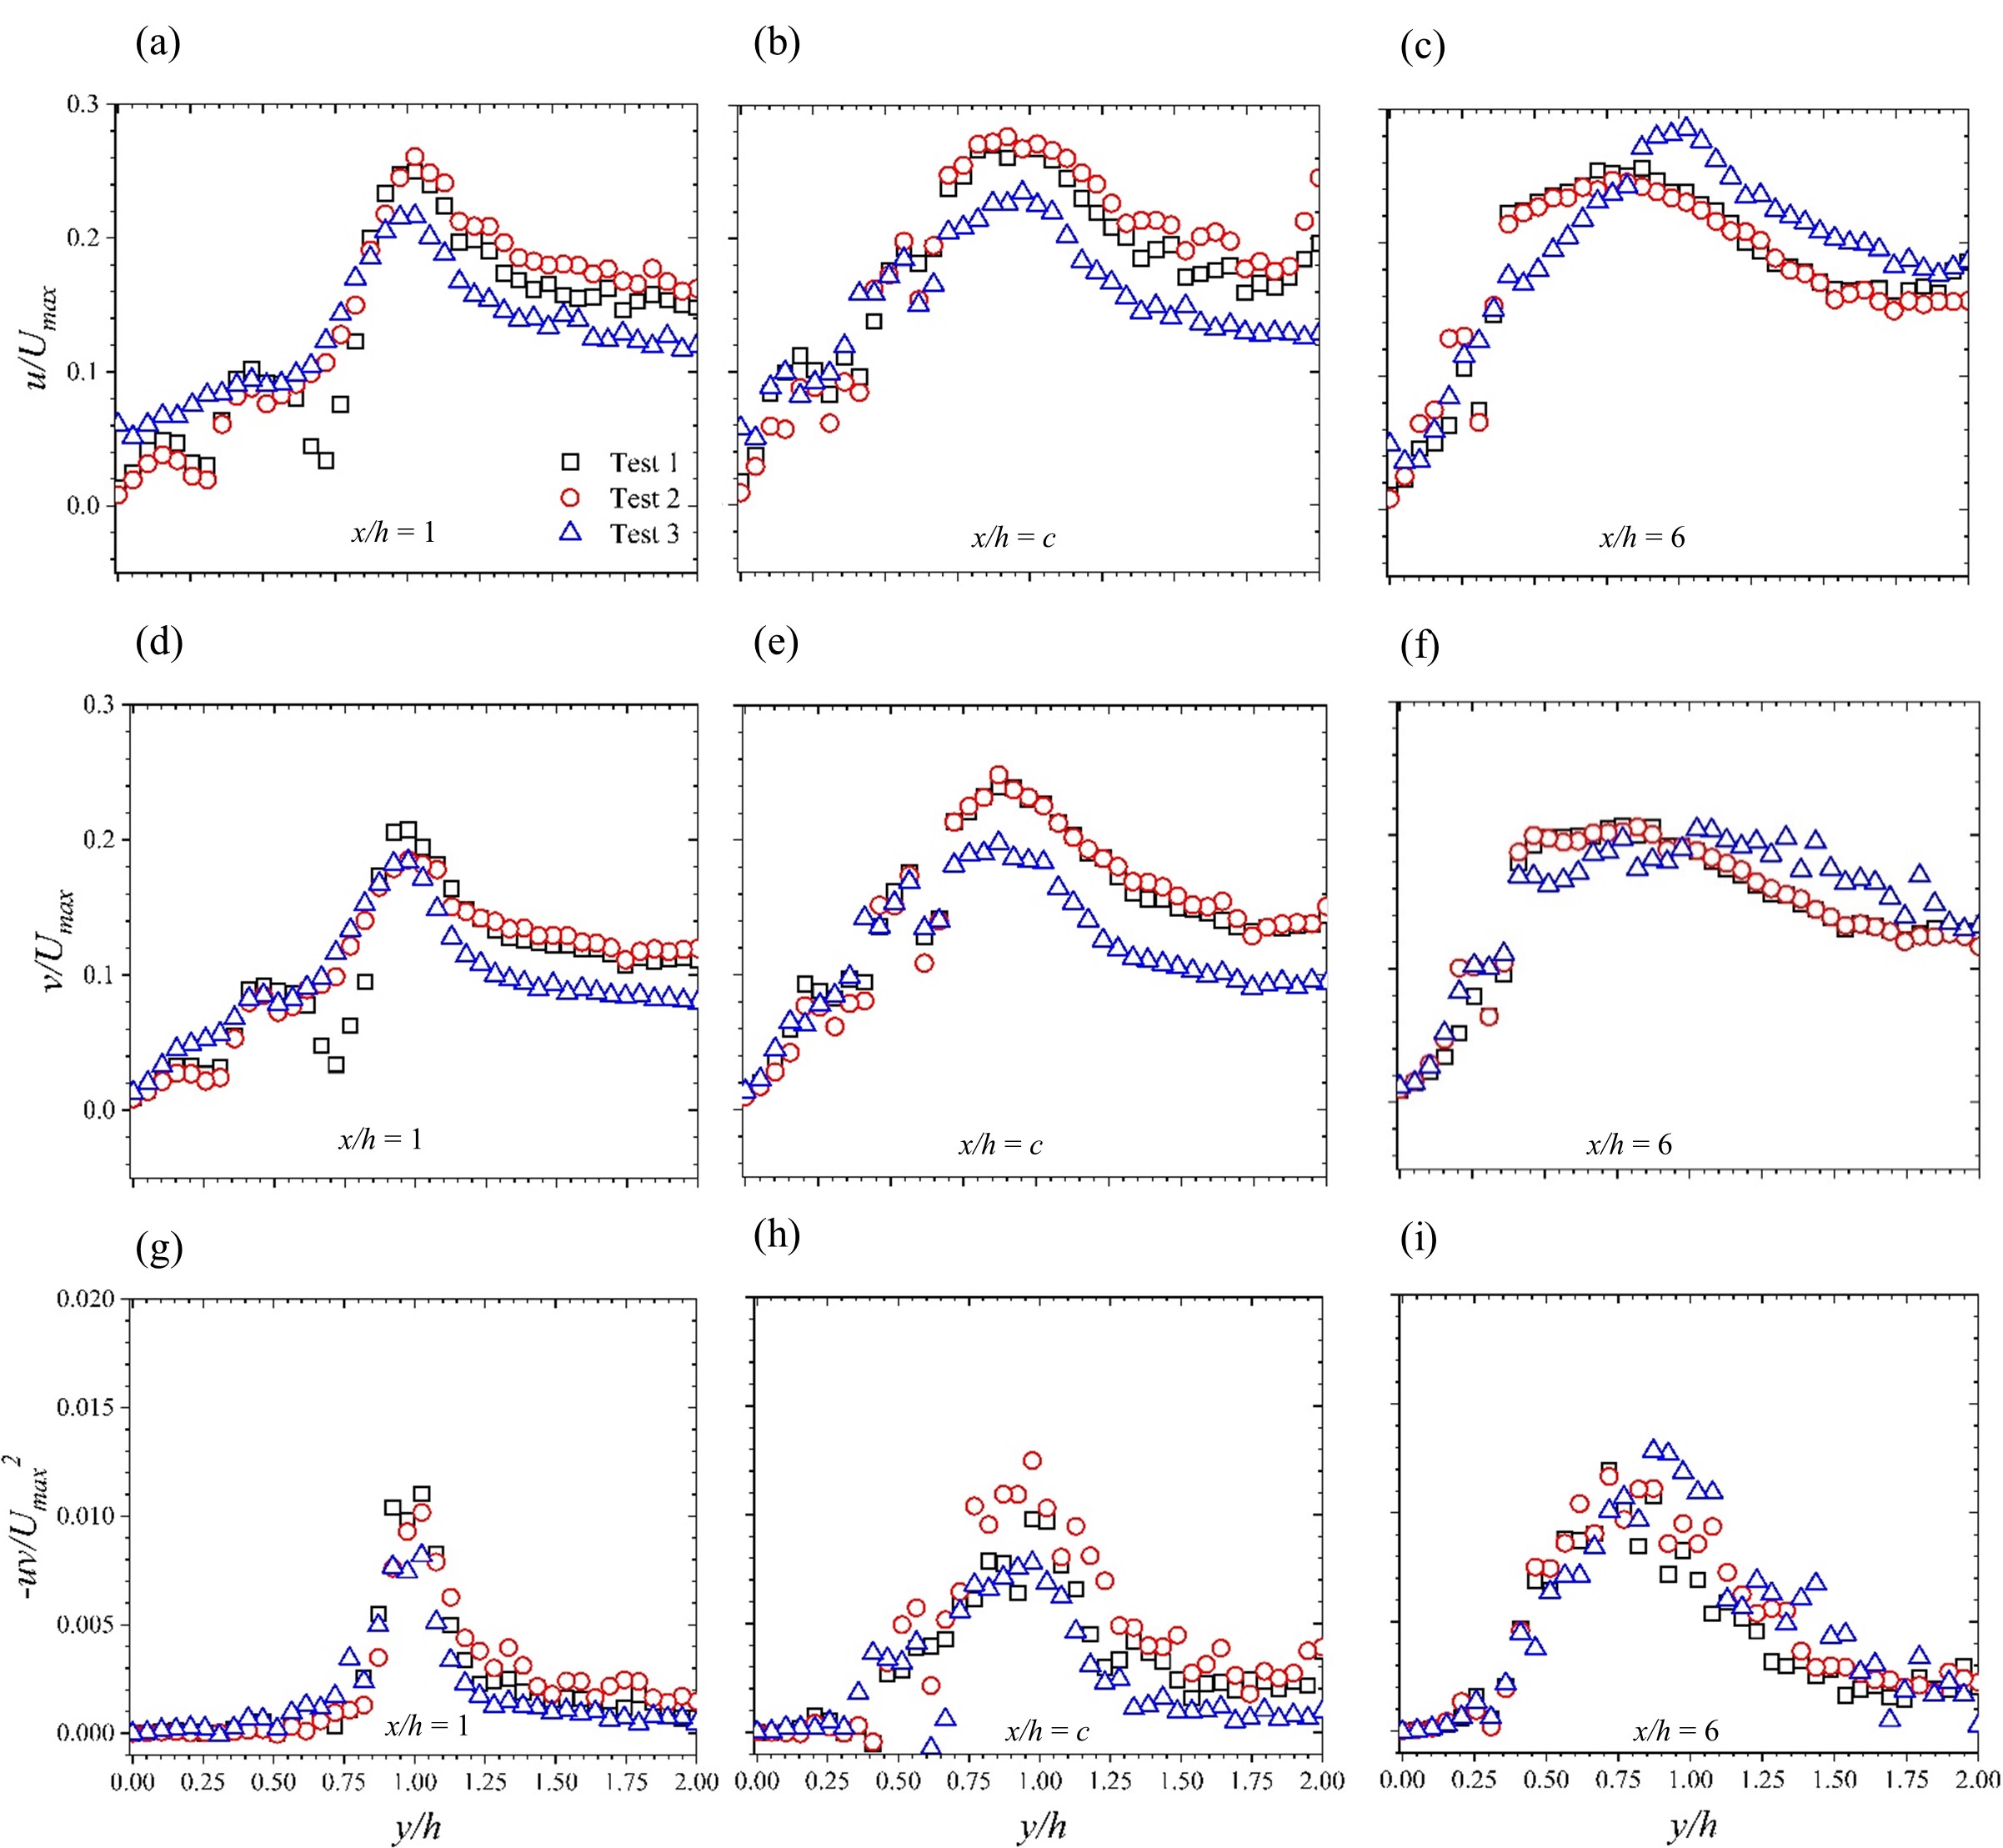
Statistics of turbulence extracted at streamwise locations identified in Table 2, are shown in Figures 6 and 7. The results of the wall-normal variations of the turbulence intensities (u, v) normalized by the maximum mean streamwise velocity Umax, are plotted in Figure 6. In general, both streamwise and wall-normal turbulence intensities increase from low values (close to the lower wall boundary) to a maximum value at y/h ≈ 1. For the data extracted at x/h = 1 and c, this heightened turbulence at y/h ≈ 1 is expected due to the presence of the separated shear layer, where large scale eddies are transported. At y/h > 1 (i.e., outer flow region), the turbulence intensities drop to values comparable to that corresponding wall-normal locations upstream of the step. For the data extracted at x/h ≈ 6, the profiles are symptomatic of flows undergoing recovery of boundary layer. The differences in values may be attributed primarily to differences in Reynolds number. Overall, increasing both Re and ER leads to decrements in turbulence intensities in the outer flow region of flows immediately downstream of the step. Beyond the point of reattachment, the test cases tend to converge.
The plots of Reynolds normal stresses are not shown in this work. However, we point out that we observed that the trends of those stresses are similar to the turbulence intensities of corresponding directions. This suggests that the trends of both turbulence intensities and Reynolds normal stresses are governed by similar physics of flow. We also note that the Reynolds normal stresses in the streamwise direction were found to be generally greater than that in the wall-normal direction. This is consistent with a large-scale anisotropic turbulent field. In Figure 6, the profiles of Reynolds shear stress variations in the wall-normal direction are shown. The values tend to rise from low (close to the lower wall) to maximum at y/h = 1. As y/h increases beyond 1, the Reynolds shear stresses decay rapidly. It is also noted that for the flow within the recirculation region, the Reynolds shear stresses increase within the wall-normal locations 0.50 < y/h < 1.50, from x/h = 1 to x/h = c. At x/h = 6 where the flow starts to recover, the region of high Reynolds stresses expand, in line with wide-channel flow measurements reported by Ampadu-Mintah and Tachie [15]. A global view of the Reynolds shear stress profiles indicate convergence with no significant distinctions in observations of the test cases.
Normalized turbulent kinetic energy k is also shown in plots of the wall-normal variations in Figure 7. It must be noted that giving that our PIV test system is planar, the assessment of k was done indirectly, using an estimate based on the evaluation of the Reynolds normal stresses, i.e., k≈0.75(u2+v2) [16]. As expected, the plots qualitatively follow the trends of the streamwise and wall-normal turbulence intensities, as both are significant contributors to the estimates. Additionally, in keeping with intuition, significant energy is recorded at regions of high vortical activity such as those within the recirculation region.
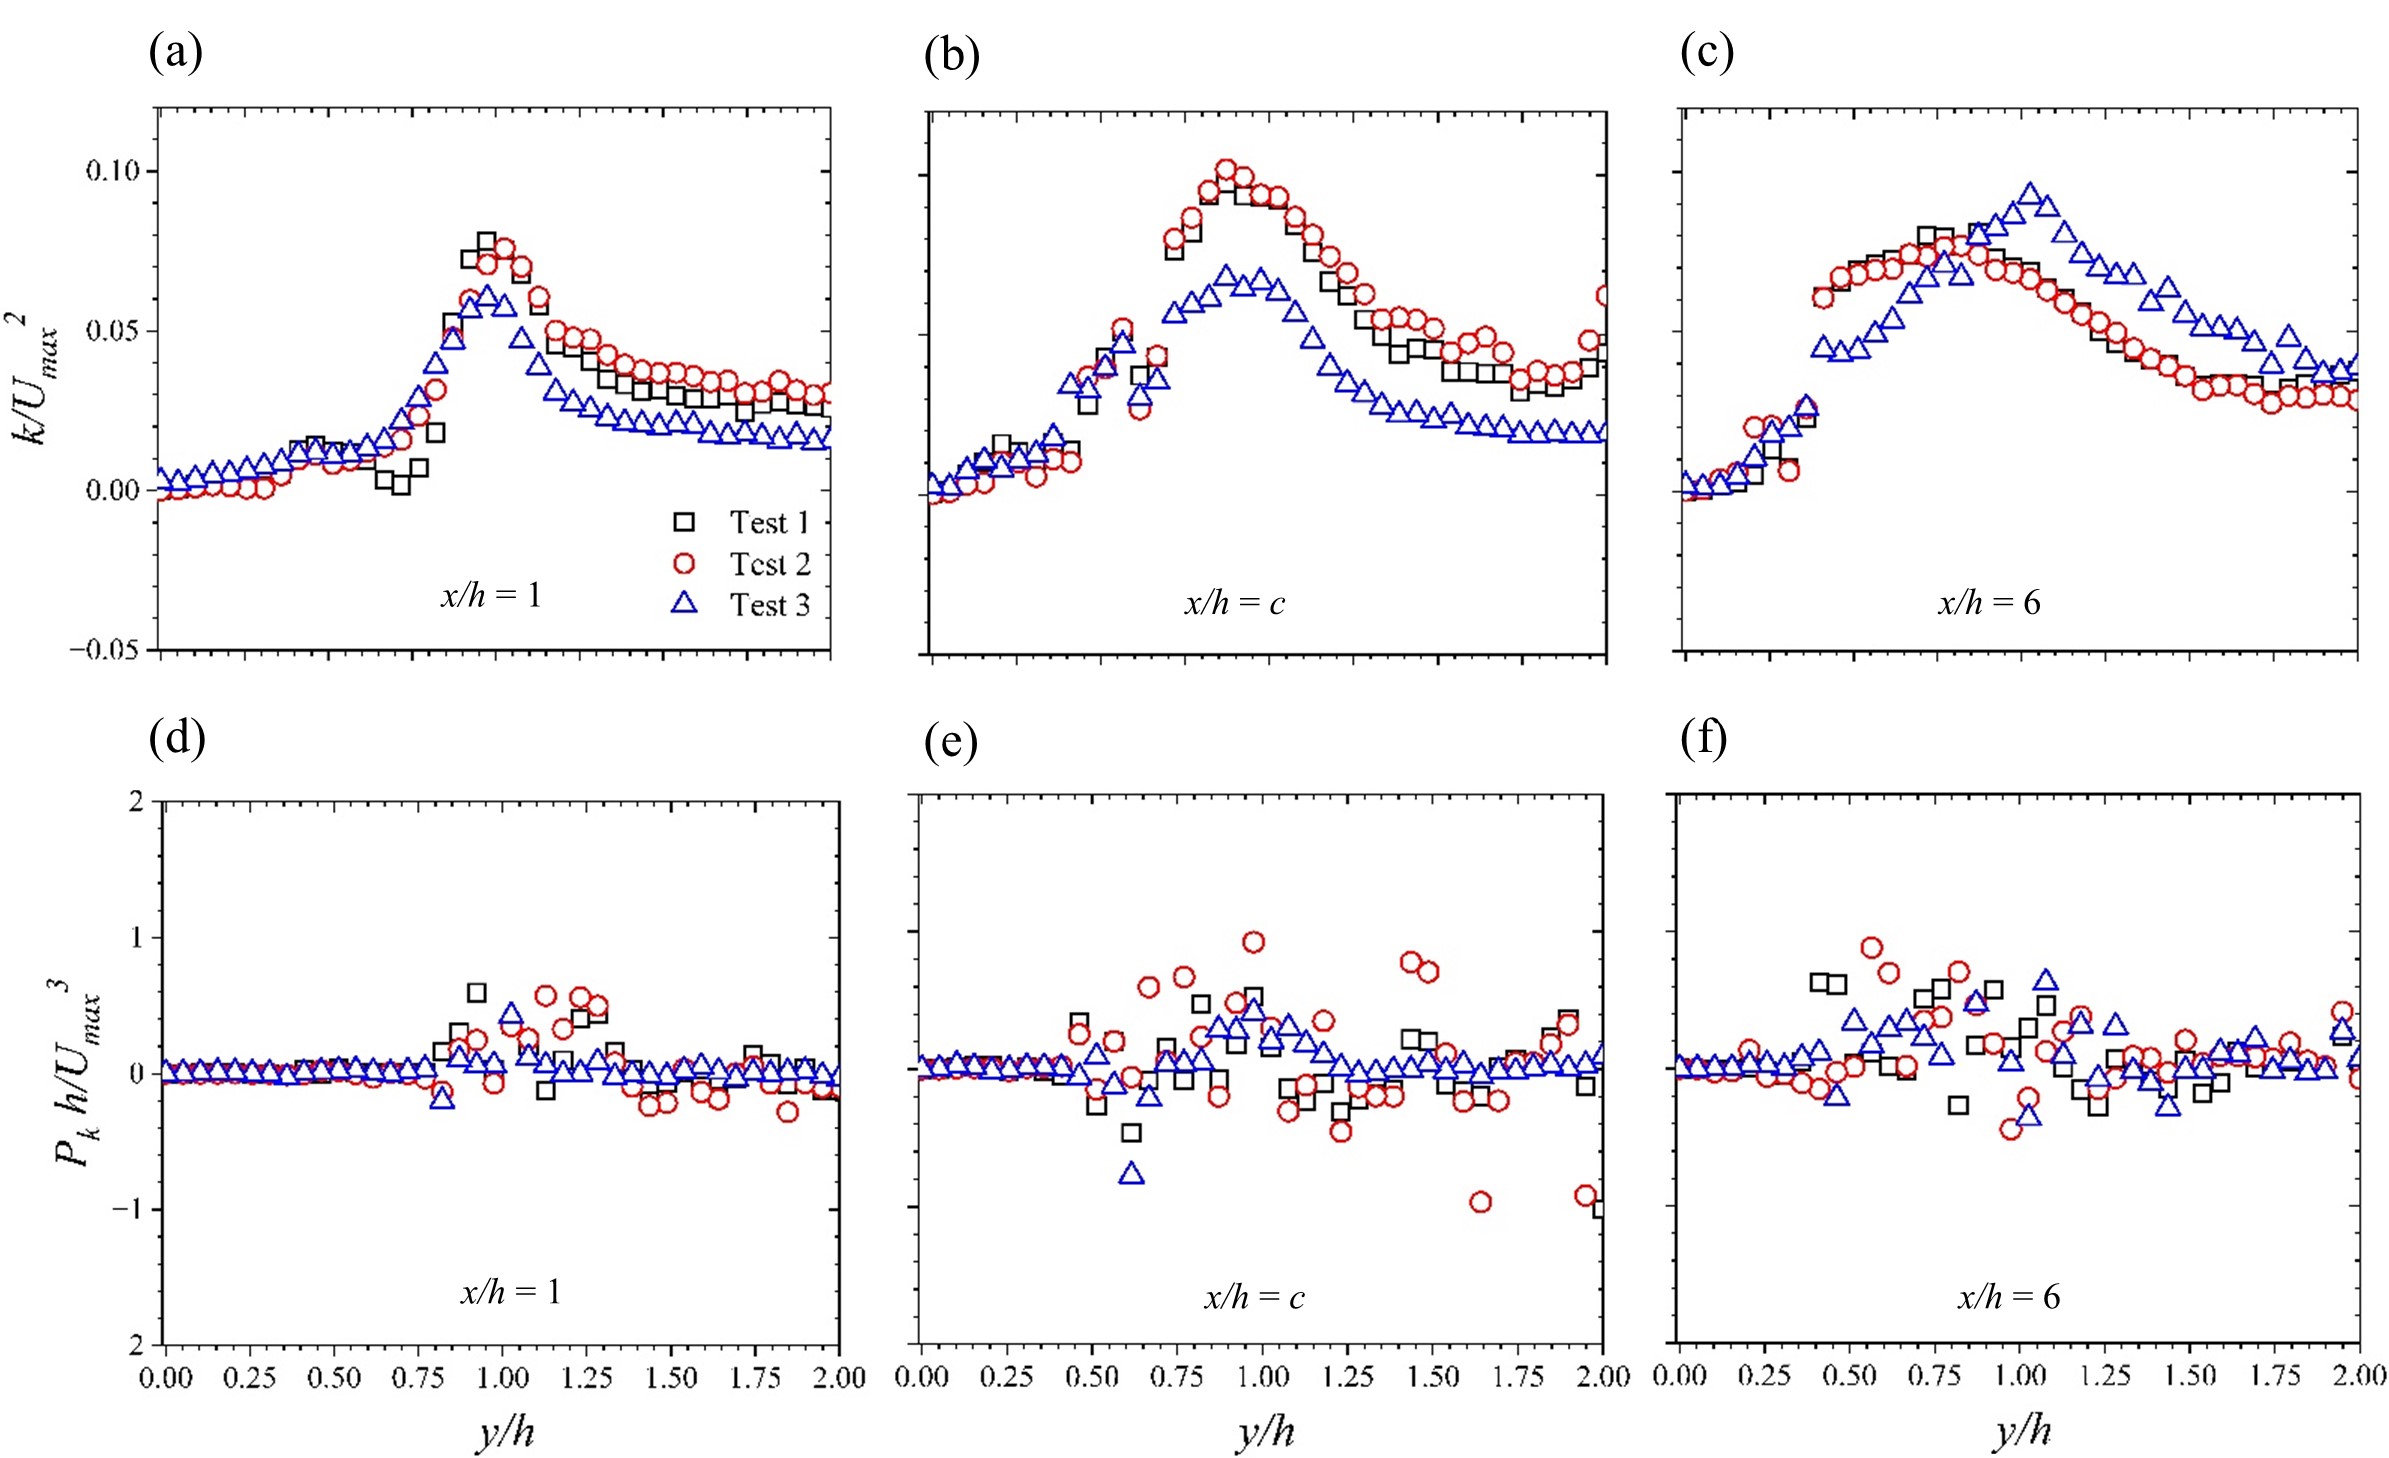
Further studies of the turbulent flow were conducted through an evaluation of the turbulence production. The plots are shown in Figure 7. Again, in accordance with the planar limitations of our PIV system, we estimated the production term as follows:
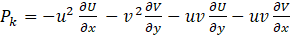
The results show significant scatter. While there are no clear differences between the test cases, peak production values are however registered around the shear layer and the outer flow regions. Additionally, changes in sign are apparent at the shear layer and the flow recovery region. This is in partial agreement with Arthur [11], who in his study of narrow close-channel BFS flow, reported of such changes within the recirculation region. These indicate reversals of flow energy between the mean flow and the fluctuating turbulent field.
4. Conclusion
In this paper, we have studied the backward-facing step (BFS) in a narrow open-channel to understand the effects of expansion ratio and Reynolds number variations. This was done by modeling the flow domain in an experimental facility consisting of a channel flume with a backward-facing step installed in the upstream section of the flow, resulting in an aspect ratio of 4. We varied the flow depth so as to achieve variant expansion ratio (ER) of 1.25 and 1.50. An open-channel turbulent flow was conducted through the flume at various flow rates such that the Reynolds number (Re) based on h and the maximum velocity could be tested between 2900 and 11,000. A two-dimensional particle image velocimetry technique was used to measure flow and geometric effects around the recirculation region of the BFS flow.
The mean streamwise velocity data for all cases show a recirculation region just downstream of the step. However, (nearly) doubling the Re leads to a multi-centered primary recirculation bubble, and a secondary corner bubble. Despite these significant changes, the reattachment length remains constant. Increasing the Re by 50% and the ER by 20% leads to an elimination of the corner bubble, and a 16% increment of the reattachment length. The results also indicate that the turbulent intensities and turbulent kinetic energy are mainly influenced by Re.
In general, these results suggest important differences between closed-channel, open-channel, wide channel and closed channel BFS flow configurations. This work provides insight into the effects of ER and Re, useful for the design and optimization of energy-efficient engineering systems.
References
[1] Eaton, J. K. and Johnston, J. P. "A review of research on subsonic turbulent flow reattachment," AIAA J., vol. 19, (9), pp. 1093-1100, 1981.
View Article
[2] Sidik, N.A., Ghaderian, J., & Sadeghipour, S. “Simulation of turbulent flow over a backward facing step using lattice Boltzmann method,” Journal of engineering science and technology, 8, 670-682, 2013.
[3] Singh, Anugya & Satheesh Kumar, Aravind & Kubendiran, Srinadhi & B T, Kannan. Assessment of Turbulence Models on a Backward Facing Step Flow Using OpenFOAM®. IOP Conference Series: Materials Science and Engineering. 912. 10.1088/1757-899X/912/4/042060, 2020.
View Article
[4] Darmawan, S., & Tanujaya, H. CFD Investigation of Flow Over a Backward-facing Step using an RNG k-? Turbulence Model. International Journal of Technology. Volume 10(2), pp. 280-289, 2019.
View Article
[5] Darmawan, Steven. Reynolds number effects on swirling flows intensity and reattachment length over a backward-facing step geometry using STD k-ε turbulence model. IOP Conference Series: Materials Science and Engineering. 852. 012073. 10.1088/1757-899X/852/1/012073, 2020.
View Article
[6] Coskun, Umut Can & Cadirci, Sertac & Gunes, Hasan. Active Flow Control Behind a Backward Facing Step Using a Zero-Net-Mass-Flux System. 10.1007/978-3-319-30602-5_29, 2016.
View Article
[7] Louda, P., Příhoda, J., and Kozel, K., “Numerical simulation of 3D backward facing step flows at various Reynolds numbers”, European Physical Journal Web of Conferences, vol. 92, 2015.
View Article
[8] Uruba, V. & Jonáš, P. Flow over back-facing step in a narrow channel. PAMM. 12. 10.1002/pamm.201210239, 2012.
View Article
[9] Almohammadi, K. Assessment of Reattachment Length Using Turbulence Models on Backward Facing Step (BFS) for Turbulent Flow with Modified General Richardson Method. Arabian Journal for Science and Engineering. 45. 10.1007/s13369-020-04695-0, 2020.
View Article
[10] Nadge, P. and Govardhan-Ankulkar, R. High Reynolds number flow over a backward-facing step: Structure of the mean separation bubble. Experiments in Fluids. 55. 10.1007/s00348-013-1657-5, 2014.
View Article
[11] Arthur, J. K. “A narrow-channelled backward-facing step flow with or without a pin-fin insert: Flow in the separated region,” Experimental Thermal and Fluid Science, vol. 141, p. 110791, 2023.
View Article
[12] Akinlade OG, Bergstrom DJ, Tachie MF, Castillo L. Outer flow scaling of smooth and rough wall turbulent boundary layers. Experiments in Fluids. 2004 Oct;37:604-12.
View Article
[13] Nakagawa H, and Nezu I. Experimental investigation on turbulent structure of backward-facing step flow in an open channel. Journal of Hydraulic Research. 1987 Jan 1;25(1):67-88.
View Article
[14] Nezu I, and Nakagawa H. Turbulent structure of backward-facing step flow and coherent vortex shedding from reattachment in open-channel flows. In Turbulent Shear Flows 6: Selected Papers from the Sixth International Symposium on Turbulent Shear Flows, Université Paul Sabatier, Toulouse, France, September 7–9, 1987 1989 (pp. 313-337). Springer Berlin Heidelberg.
View Article
[15] Arthur JK. Turbulent Flow through and over a Compact Three-Dimensional Model Porous Medium: An Experimental Study. Fluids. 2021 Sep 23;6(10):337.
View Article
[1] Eaton, J. K. and Johnston, J. P. "A review of research on subsonic turbulent flow reattachment," AIAA J., vol. 19, (9), pp. 1093-1100, 1981. View Article
[2] Sidik, N.A., Ghaderian, J., & Sadeghipour, S. “Simulation of turbulent flow over a backward facing step using lattice Boltzmann method,” Journal of engineering science and technology, 8, 670-682, 2013.
[3] Singh, Anugya & Satheesh Kumar, Aravind & Kubendiran, Srinadhi & B T, Kannan. Assessment of Turbulence Models on a Backward Facing Step Flow Using OpenFOAM®. IOP Conference Series: Materials Science and Engineering. 912. 10.1088/1757-899X/912/4/042060, 2020. View Article
[4] Darmawan, S., & Tanujaya, H. CFD Investigation of Flow Over a Backward-facing Step using an RNG k-? Turbulence Model. International Journal of Technology. Volume 10(2), pp. 280-289, 2019. View Article
[5] Darmawan, Steven. Reynolds number effects on swirling flows intensity and reattachment length over a backward-facing step geometry using STD k-ε turbulence model. IOP Conference Series: Materials Science and Engineering. 852. 012073. 10.1088/1757-899X/852/1/012073, 2020. View Article
[6] Coskun, Umut Can & Cadirci, Sertac & Gunes, Hasan. Active Flow Control Behind a Backward Facing Step Using a Zero-Net-Mass-Flux System. 10.1007/978-3-319-30602-5_29, 2016. View Article
[7] Louda, P., Příhoda, J., and Kozel, K., “Numerical simulation of 3D backward facing step flows at various Reynolds numbers”, European Physical Journal Web of Conferences, vol. 92, 2015. View Article
[8] Uruba, V. & Jonáš, P. Flow over back-facing step in a narrow channel. PAMM. 12. 10.1002/pamm.201210239, 2012. View Article
[9] Almohammadi, K. Assessment of Reattachment Length Using Turbulence Models on Backward Facing Step (BFS) for Turbulent Flow with Modified General Richardson Method. Arabian Journal for Science and Engineering. 45. 10.1007/s13369-020-04695-0, 2020. View Article
[10] Nadge, P. and Govardhan-Ankulkar, R. High Reynolds number flow over a backward-facing step: Structure of the mean separation bubble. Experiments in Fluids. 55. 10.1007/s00348-013-1657-5, 2014. View Article
[11] Arthur, J. K. “A narrow-channelled backward-facing step flow with or without a pin-fin insert: Flow in the separated region,” Experimental Thermal and Fluid Science, vol. 141, p. 110791, 2023. View Article
[12] Akinlade OG, Bergstrom DJ, Tachie MF, Castillo L. Outer flow scaling of smooth and rough wall turbulent boundary layers. Experiments in Fluids. 2004 Oct;37:604-12. View Article
[13] Nakagawa H, and Nezu I. Experimental investigation on turbulent structure of backward-facing step flow in an open channel. Journal of Hydraulic Research. 1987 Jan 1;25(1):67-88. View Article
[14] Nezu I, and Nakagawa H. Turbulent structure of backward-facing step flow and coherent vortex shedding from reattachment in open-channel flows. In Turbulent Shear Flows 6: Selected Papers from the Sixth International Symposium on Turbulent Shear Flows, Université Paul Sabatier, Toulouse, France, September 7–9, 1987 1989 (pp. 313-337). Springer Berlin Heidelberg. View Article
[15] Arthur JK. Turbulent Flow through and over a Compact Three-Dimensional Model Porous Medium: An Experimental Study. Fluids. 2021 Sep 23;6(10):337. View Article