Journal of Fluid Flow, Heat and Mass Transfer (JFFHMT)
ISSN: 2368-6111

Volume 11 - Year 2024 - Pages 248-254
DOI: 10.11159/jffhmt.2024.025
Parametric Analysis of Drag Reduction Determined by Streamwise Triangular Riblet Microstructures: Effect of Included Angle Variation
William Gordon1,2, O. Remus Tutunea-Fatan1,2, Evgueni Bordatchev2,1
1Western University
1151 Richmond St, London, Canada wgordon5@westerneng.ca; rtutunea@eng.uwo.ca
2National Research Council of Canada
800 Collip Circle, London, Canada evgueni.bordatchev@nrc-cnrc.gc.ca
Abstract - Recent research has focused on the hydrodynamics of turbulent water flow over surfaces structured with various micro-scale features. Previous studies have demonstrated that streamwise triangular riblets (STR), also known as sawtooth riblets, and other riblet designs can achieve drag reduction, self-cleaning, and fouling-resistant effects. This study aimed to numerically simulate and parametrically analyze the effect of the included angle (α) of STRs on potential drag reduction. The CFD simulations conducted in this study examined the impact of design parameters on turbulent flow hydrodynamics and their influence on drag reduction performance. The analysis considered several included angle values: α = 15°, 30°, and 60°, at multiple flow velocities. Flow conditions, particularly the turbulent structures formed around the riblets, were analyzed in detail and compared with published data. CFD simulations utilized the LES WALE model with a prism and hexahedral mesh. The examination of turbulent flow patterns near riblet tips and valleys revealed characteristics consistent with previously published data for 60° STR. Furthermore, as α decreases, the range of nondimensional riblet spacing (S+) exhibiting drag-reducing effects narrows, while the range of Reynolds numbers increases. The smaller included angle analyzed was associated with maximum drag reduction (~10%) at smaller S+ values. The results of this study are expected to pave the way for developing, optimizing, and controlling advanced hydro- and aerodynamic functional surfaces.
Keywords: Turbulence, drag reduction, microsurfaces, sawtooth riblets, streamwise triangular riblets
© Copyright 2024 Authors - This is an Open Access article published under the Creative Commons Attribution License terms. Unrestricted use, distribution, and reproduction in any medium are permitted, provided the original work is properly cited.
Date Received: 2023-12-05
Date Revised: 2024-07-12
Date Accepted: 2024-07-28
Date Published: 2024-08-23
1. Introduction
Surfaces with micro-scale riblets can exhibit unique and enhanced fluid dynamic properties compared to flat surfaces. There are numerous applications that benefit from controlling and altering fluid dynamics near textured or structured surfaces. Although this is not a new research area, many unknowns still exist. In this context, the current study aims to determine the effect of the included angle of streamwise triangular riblets — also known as sawtooth riblets — on drag reduction. The comprehensive analysis of the impact of STR structures on drag reduction was inspired by shark skin, which features microscopic surface structures characterized by semicircular grooves running parallel to the flow direction and grouped in small scales called dermal denticles [1, 2].
Previous research has focused on analyzing the attributes and potential applications of STR structures. For example, extensive investigations have explored the effect of staggered arrangements of 3D riblets on drag reduction [3]. Other studies have examined the correlation between debris accumulation or riblet tip wear and riblet performance [4]. Additionally, significant efforts have been made to analyze the effect of different riblet types (such as, STR, blade riblets, asymmetrical triangular riblets, etc.) on flow manipulation [5]. Some studies have used experiments to investigate the effect of compliance in the materials to which riblets are affixed, mimicking the compliance of actual shark skin [6]. Anti-fouling and self-cleaning properties of STR structures have also been computationally and experimentally examined [7]. Large-scale simulations have studied the overall effects of riblets on a Stratos 716 X business jet [8]. Similarly, tests on an Airbus 320 airplane with 60° STR structures showed a 2% reduction in fuel usage [9]. Despite the substantial knowledge base, further research is essential for optimizing riblets and understanding their properties. Therefore, conducting extensive parametric studies is an effective approach to achieve this goal.
To address this, the main objective of the present study is to analyze the effect of varying the included angle of the riblets on drag reduction, with the expectation that this knowledge will further elucidate the mechanism of passive drag reduction. Upcoming sections will detail comparisons between CFD simulations and experimental data.
2. Numerical Simulation and Experimental Methodologies
2.1. Numerical Simulation Methodology
Two different series of simulations were completed in this study and will be detailed further. In the first series, the fluid velocity over the featured surface was varied to change the S+ value (Eq. 1 and 2). However, higher Reynolds numbers associated with increased velocity likely resulted in higher turbulence levels in some cases. To account for this, a second series of simulations was performed using a new model for each simulation. In this approach, riblet spacing was varied to manipulate the S+ value without changing the fluid velocity of the initial flow conditions.


Where S+ is the non-dimensional riblet spacing, S is the physical riblet spacing, ν is the kinematic viscosity, uτ is the frictional velocity, τo is the wall shear stress on a flat surface, and ⍴ is the fluid density.
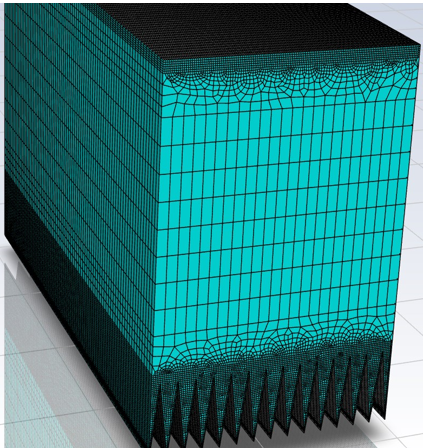
The first step in the numerical solution was creating the swept prism and hexahedral grid in ANSYS, with mesh type and parameters based on past studies [10]. Element sizes were set at 35 μm for features and the top surface in order to satisfy Eq. 3, and 750 μm for the large central area. Split lines were used to control cell growth rather than a simple inflation rate. The larger element size in the central section, see Figure 1, was intended to reduce the number of cells and computation time, as there is significantly less turbulence to model in this region [11]. All simulations used identical meshes and the same mesh parameters when the domains differed.

Where y+ is the non-dimensional wall normal distance, and y is the physical wall normal distance.
 (a)
(a)
 (a)
(a)
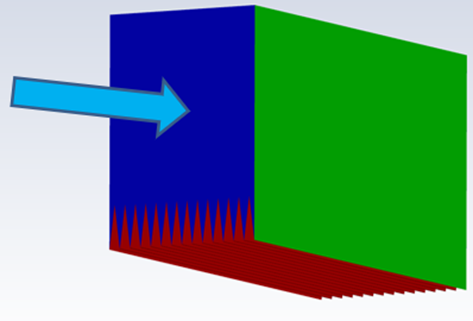
In FLUENT, the viscous model was set as LES WALE, as it is one of the most extensive turbulent flow models. This model requires significantly higher quantity and quality of cells compared to models like the k-ɛ model, making LES more computationally demanding. To reduce computation time, all simulations began as steady-state RANS (standard k-ɛ). This initial data for the transient simulations closely resembled the actual established velocity, with turbulent fluctuations initialized to "trip" the flow into turbulence. The inlet, outlet, left, and right walls were defined as periodic interfaces to simulate an infinitely long and wide domain. Under these periodic boundary conditions, cases varying riblet spacing were characterized by a specified mass flow rate of around Q = 0.04 kg/s, changing as a function of the inlet area. The mass flow rate was set only in the x-direction, with the initial pressure gradient set as 0 Pa/m. The top and featured surfaces had a no-slip wall boundary condition. The time step of these simulations was initially defined as the smallest element size divided by the average velocity and then varied throughout the simulation. After running the simulation for around 10,000 iterations, the number of iterations per time step was noted, with adjustments made to the time step as needed.
2.2. Experimental Performance Evaluation Methodology
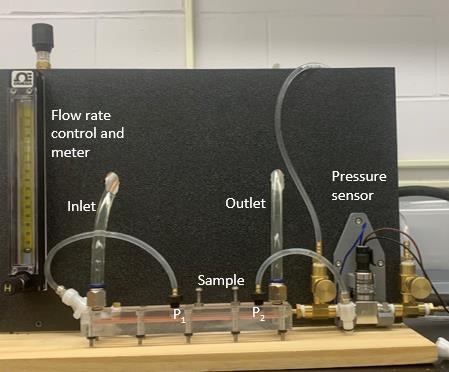
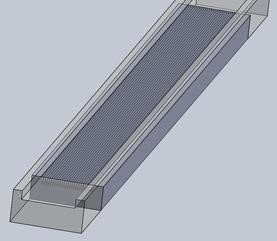
The experiments validating the numerical results used an apparatus capable of measuring the pressure gradient caused by drag changes produced by surface structures, see Figure 2. A D5100 pressure transducer from TE Connectivity measured the pressure gradient, with a total error of ±103.4 Pa. Data was read by a LabVIEW program, then uploaded to a Matlab program that averaged each measurement over time. The Matlab program also linearly offset the data based on two zero measurements taken at the beginning and end of each experiment to account for slight variations in atmospheric pressure.
Four samples were manufactured from acrylic, each characterized by these angles: 15°, 30°, 60°, and flat with no features. Riblet spacing was chosen at 235 μm. The features were machined using a single-point diamond cutting tool installed on a five-axis micromachining center. The geometric parameters selected were consistent with past simulations and the experimental device used.
3. Results and Discussion
3.1. The Effect of Flow Velocity on Drag
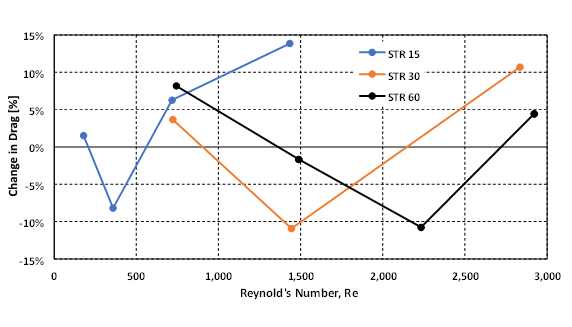
The drag reduction (Eq. 4) results of the numerical simulations for variable STR angles and mass flow rates reveal several critical observations, see Figure 3. Specifically, as α decreases, the Reynolds number at which peak reduction occurs also decreases. This has important implications for applications where lower velocities are desirable, indicating that STRs with lower angles should be used. These results also suggest that riblets with shallower angles should be placed near the front of a vessel, while those with increasingly larger angles should be placed towards the rear as the Reynolds number increases. Moreover, the preliminary results imply that the range of Reynolds numbers at which drag reduction occurs shrinks as α increases. However, this idea requires further investigation due to the low number of data points used in this study.

Where CD is the change in drag and τ is the wall shear stress on the structured surface.
3.2. The Effect of Riblet Spacing on Drag
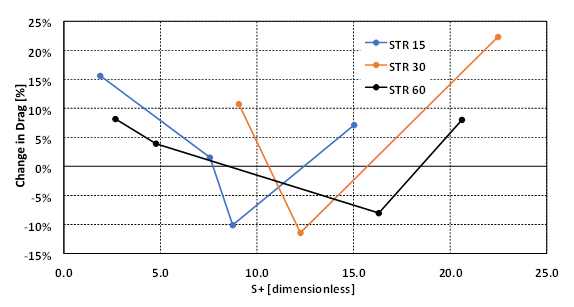
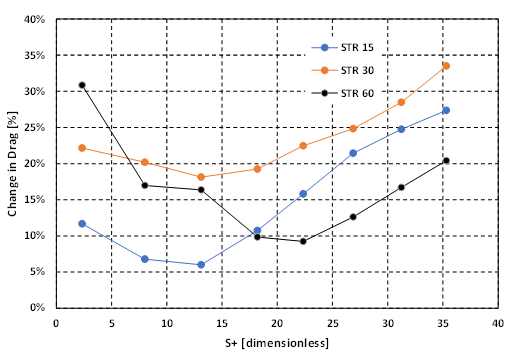
The numerical results for variable riblet spacings are presented in Figure 4. For α = 15°, peak drag reduction occurs around S+ = 9 rather than the expected S+ = 10 – 20. A previous study [5] indicated that as α decreases, the S+ value at which peak drag reduction occurs also decreases. This trend is also observed in the results for α = 30° and α = 60°. Notably, the drag reductive region of the curve decreases as α decreases. Bechert et al. [6] made a similar comment, which might explain the reduced drag reductive "window" visible in Figure 4. If this observation is experimentally validated, it could have important implications for designing drag reductive riblets, indicating that riblets with larger included angles can provide drag reduction over a larger window of velocities or riblet spacing. As an example of implications for implementation, along the length of the flat surface on cargo truck trailers the Reynold’s number increases, thus, an improvement in the drag reductive efficiency could be implemented through varying the riblet spacing. Additionally, the α = 60° riblets would be the best choice out of the three studied geometries
Unfortunately, due to the large computational costs of these simulations, a limited number of data points were created. This makes it difficult to make strong statements about the precise location of the maximum drag reduction and the exact shape of the curve seen in Figure 4. Additionally, it should be noted that similar trends are noticed between the two series of simulations, varying velocity and varying spacing (Figures 3 and 4 respectively), however, a larger study may be able to illustrate unseen differences.
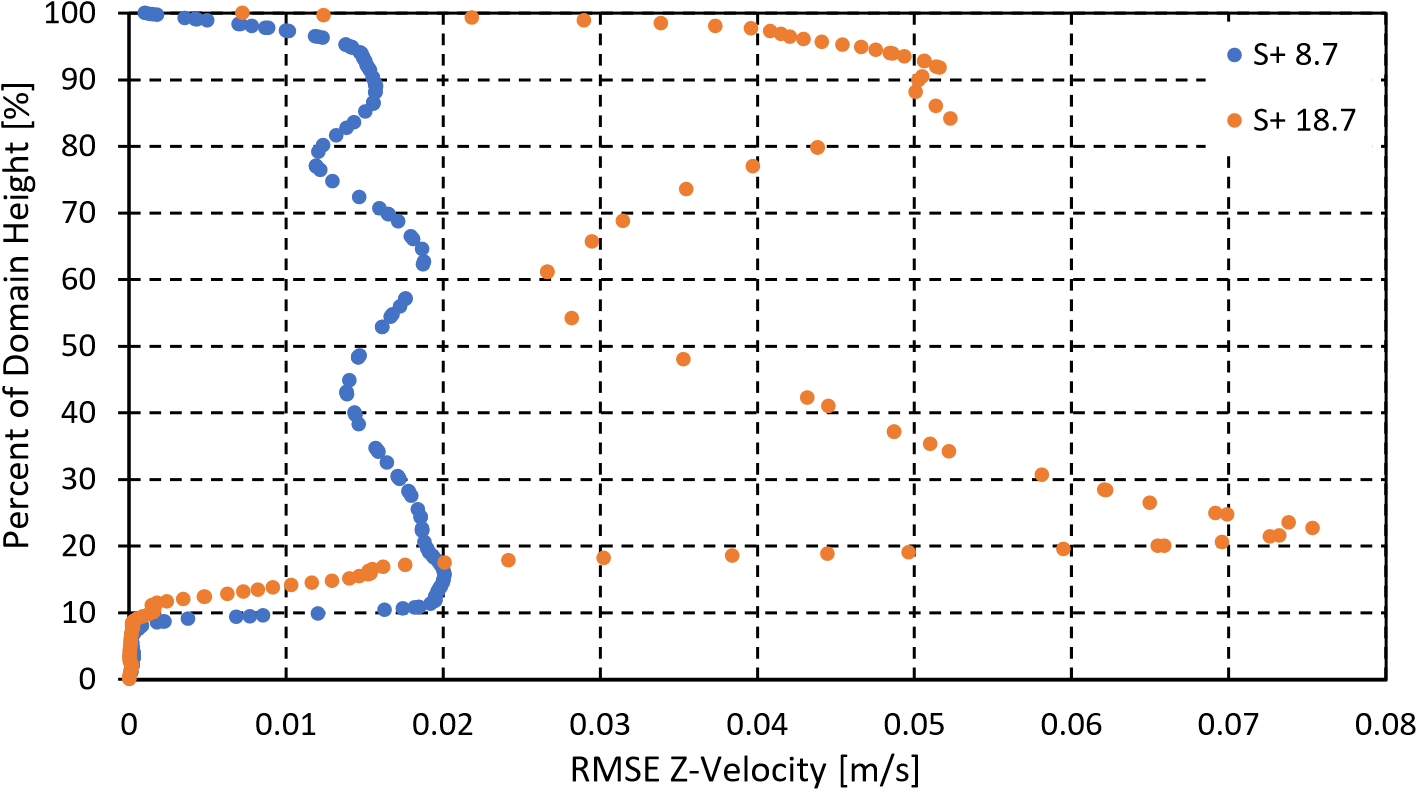
Two main hypotheses were proposed by Martin and Bhushan [2] to explain the mechanisms through which riblets reduce skin friction drag. One hypothesis suggests that drag reduction results from a reduction in velocity fluctuations in the spanwise direction. The other hypothesis posits that the geometry of the structures prevents the formation of streamwise vortices within the riblet valleys, lifting and pushing turbulences away from the surface.
The numerical results from this study align with both proposed theories. The velocity-RMSE fields, computed using velocity fluctuations (Eq. 5), monitored using time statistics during the simulations. The results for the α = 15° case show an increase in w-RMSE between drag decreasing and drag increasing cases just above the riblet peaks. The peak w-RMSE value for α = 15° drag decreasing/increasing scenarios differs by a factor of roughly 3.75. Similar factors were found for the other geometries, specifically, 2.67 for α = 30° and 4.5 for α = 60°. Increased velocity fluctuations cause increased drag through increased turbulence at the riblet peaks.
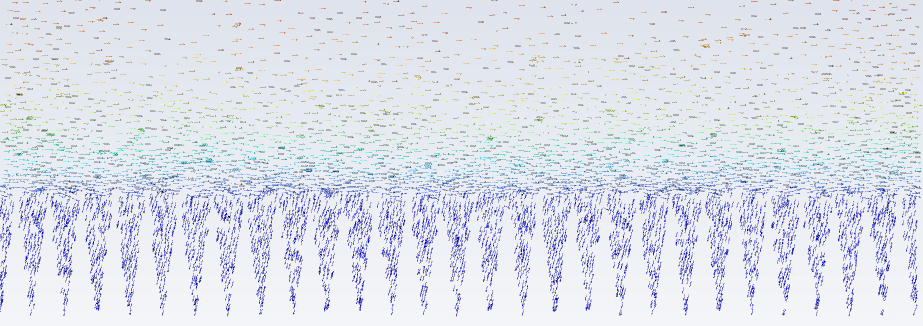
The reduction in streamwise eddies is illustrated in Figure 6, depicting velocity vectors in the plane perpendicular to the flow for the 15° case. The colour scale for all plots ranges from 1.08e-7 to 0.73 m/s as seen in Figure 6c). Velocity fields in both drag increasing and decreasing scenarios suggest that drag increasing is associated with higher velocity fluid being closer to the riblet peaks than its decreasing counterpart. In the drag increasing case, streamwise vortices travels further down the riblet valley further than in the drag decreasing case. Similar observations were made in [1], indicating that drag decreasing correlates with less intense streamwise vortices in the riblet valley and near the riblet peaks.
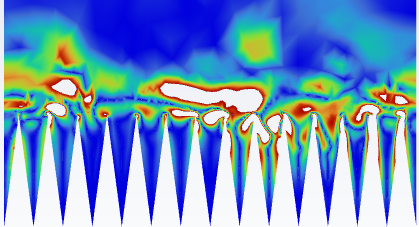
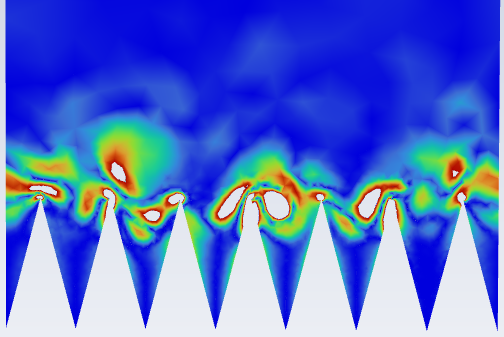
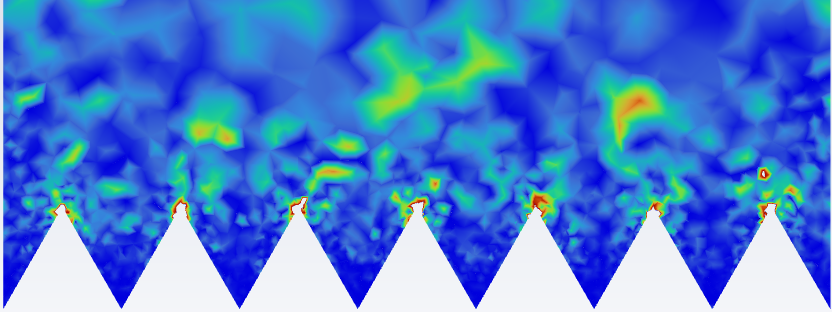
An alternate method for visualizing this phenomenon involves x-vorticity contours, see Figure 7. Figure 8 shows the same x-vorticity contours in detail around the riblets. These plots reveal more clearly the larger and more violent turbulence above the riblet peaks in drag increasing cases. They also illustrate the tendency of vorticity to travel deeper into the riblet valleys for steep STR angles, increasing the contact area between surface structures and streamwise vortices, ultimately leading to an increase in drag. Additionally, the drag decreasing cases all have a stronger boundary, or transition between the calm and slower moving fluid in the riblet valleys and the high levels of streamwise vorticity above the riblets. The range of contours presented in Figures 7 and 8 is 0-118 [1/s]. Colourless areas exhibit vorticities above the maximum value of the scale.
 (a)
(a)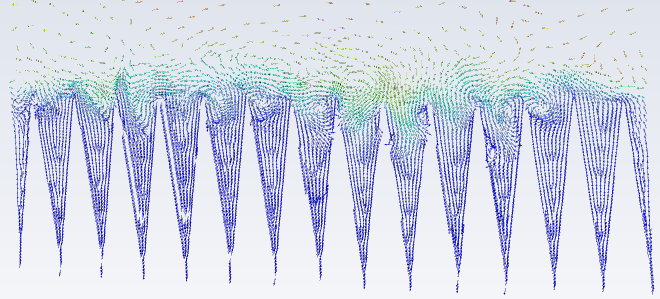 (b)
(b)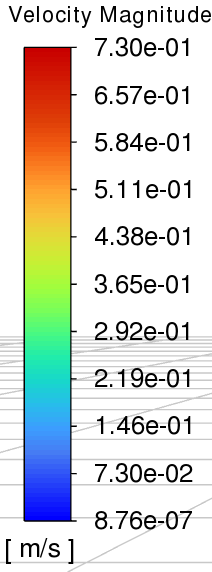 (c)
(c)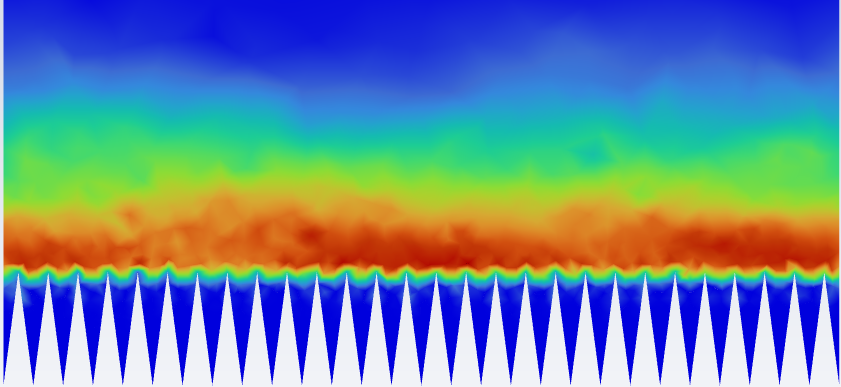 (a)
(a)
 (b)(a)
(b)
(b)(a)
(b)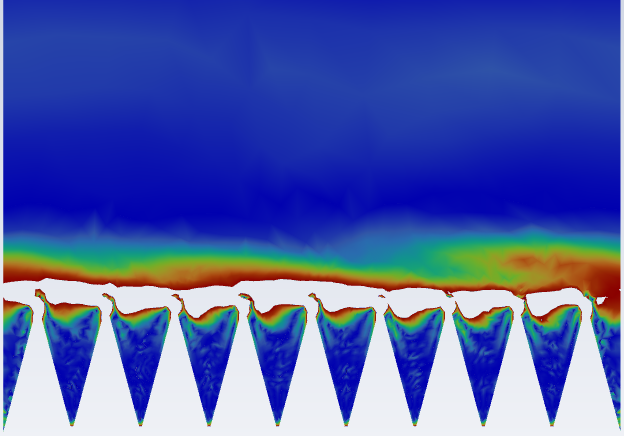 (c)
(c)
 (d)
(d)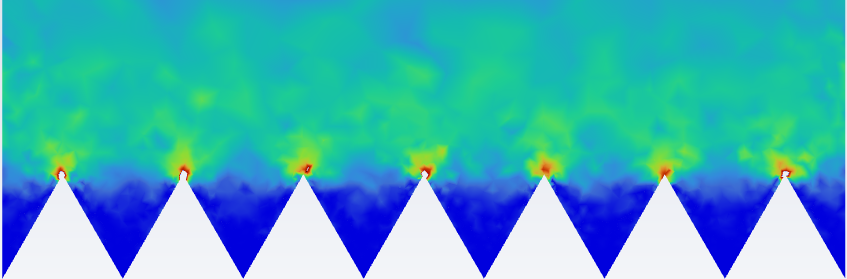 (e)
(e)
 (f)
(f)3.3. Experimental Results
Unfortunately, the experimental tests conducted so far have been inconclusive, as their results did not align with the numerical data obtained from this study and previous ones, see Figure 9. The discrepancy noticed is due to a shift upward in the curve where there is no drag reduction observed. It is also important to note that the S+ values at which the lowest drag occurs are very similar to those found in the computational results. Specifically, for the α = 15° case the minimum drag occurs between S+ = 6.8 and 13.1, for α = 30° it is between 13.1 and 18.2, and for α = 60° it is between 18.2 and 22.3.
While the root cause of the discrepancy between numerical and experimental data is still under investigation, it is possible that flat surfaces perpendicular to the flow direction, present before the sample, see Figure 10, are creating a wake in the riblet valleys. This wake might affect the subsequent vorticities formed near the STR structures. Additionally, since the same flat surface is also present at the rear of the sample, back pressure may be generated as the fluid in the riblet valleys suddenly collides with this surface after the sample ends.
During these experiments, multiple trials were used to find the mean value for the final data. Between the different trials for all geometries there was less than 15% difference between the pressure differential values. Since this percent difference value is still relatively high, a more repeatable experimental setup would be preferable. A possible method improving the repeatability of the experiment may be using an isolator to help reduce the impact of any environmental noise. Currently the attempts to limit environmental impacts involve carefully choosing time of which the experiments are run and using rubber mattingunder the water channel.
Despite the current lack of correlation between numerical and experimental data, it is notable that a near-perfect correlation was achieved for a different type of structure that did not feature the forward and backward-facing steps characteristic of the STR samples tested in this study. This suggests that the misalignment between numerical and experimental data is likely caused by specific geometric features in the sample, rather than the testing apparatus itself. To address these issues, alternative testing methods will be developed in the future.
4. Conclusions
The numerical results reenforce previously made observations about the reduced drag reduction window of Reynold’s number and S+ value for riblets with smaller included angles. Additionally, both the Reynolds number and S+ value associated with maximum drag reduction appear to be lower for riblets with smaller angles. Specifically, the LES WALE simulations show while varying the velocity, and keeping a consistent riblet spacing, the maximum drag reduction occurs at a Reynold’s number of 358 for α = 15°, 1444 for α = 30°, and 2232 for α = 60°. Similarly, while changing the riblet spacing, and keeping a consistent flow velocity, the maximum drag reduction occurred at S+ = -8.7 for α = 15°, 12.3 for α = 30°, and 16.3 for α = 60°.
Furthermore, the mechanism behind this drag reduction found in previous studies - more specifically: the reduced streamwise vortices within the riblet valley and the reduction in spanwise velocity fluctuations - are also visible within the performed CFD simulations. The streamwise vorticity contours near the riblet valley show that the drag reducing cases have a strong boundary between the calmer fluid in the riblet valley and the stronger turbulence right above the riblet peaks. Drag increasing cases on the other hand seem to have more random hotspots of streamwise vorticity in the riblet valleys and above the peaks. The RMSE-z velocity plots show that there is a significant decrease in spanwise velocity fluctuations right above the riblet peaks for the drag decreasing cases.
While the experimental results obtained so far have been inconclusive and do not align with the numerical simulations, the numerical results are consistent with previously reported findings. If a redesigned experimental setup enables validation of the drag reduction values from the numerical data, it will significantly strengthen the validity of the research. Nonetheless, experimental validation is still required before any definitive statements can be made on these topics.
Acknowledgements
The work presented in this study is the result of the collaboration between Western University (London, Ontario, Canada) and National Research Council of Canada (London, Ontario, Canada). Partial financial support was also provided by Natural Sciences and Engineering Research Council (NSERC) of Canada. The significant technical support provided by Dr. Benjamin Hamilton is also gratefully acknowledged.
References
[1] S.-J. Lee and S.-H. Lee, "Flow Field Analysis of a turbulent boundary layer over a Riblet surface," Experiments in Fluids, vol. 30, no. 2, pp. 153-166, 2001.
View Article
[2] S. Martin and B. Bhushan, "Fluid Flow Analysis of a shark-inspired microstructure," Journal of Fluid Mechanics, vol. 756, pp. 5-29, 2014.
View Article
[3] B. R. Smith, P. Yagle and P. D. McClure, "Computational Simulation of Staggered 3-D Riblets for Skin Friction Drag Reduction," AIAA SCITECH 2023 Forum, 2023
View Article
[4] P. A. Leitl, C. Feichtinger, G. Schatzdorfer and A. Flanschger, "Measurement of riblet defects and their impact on performance," AIAA SCITECH 2021 Forum, 2021
View Article
[5] S. Endrikat, D. Modesti, R. García-Mayoral, N. Hutchins, D. Chung, "Influence of riblet shapes on the occurrence of Kelvin-Helmholtz Rollers," Journal of Fluid Mechanics, vol. 913, 2021.
View Article
[6] D. W. Bechert, M. Bruse, W. Hage, J. G. Van Der Hoeven, G. Hoppe, "Experiments on drag-reducing surfaces and their optimization with an adjustable geometry," Journal of Fluid Mechanics, vol. 338, pp. 59-87, 1997.
View Article
[7] H. O. Benschop, A. J. Guerin, A. Brinkmann, M. L. Dale, A. A. Finnie, W.-P. Breugem, A. S. Clare, D. Stübing, C. Price, K. J. Reynolds, "Drag-reducing riblets with fouling-release properties: Development and testing," Biofouling, vol. 34, no. 5, pp. 532-544, 2018.
View Article
[8] P. A. Leitl, J. Smoker, M. L. Garcia de Albeniz and A. Flanschger ""Numerical and experimental investigation of different Riblet layouts on a Stratos 716 X business jet," AIAA SCITECH 2023 Forum, 2023
View Article
[9] R. García-Mayoral and J. Jiménez, "Drag reduction by Riblets," Philosophical Transactions of the Royal Society A: Mathematical, Physical and Engineering Sciences, vol. 369, no. 1940, pp. 1412-1427, 2011
View Article
[10] F. Yifeng, Y. Chengqing, B. Xiuqin, L. Tao, "Study on drag reduction performance of antifouling ribbed surfaces," Journal of Ship Production and Design, vol. 34, no. 1, pp. 32-41, 2018.
View Article
[11] Ansys® Meshing User's Guide, Release 13.0, Help System, ANSYS, Inc.
[1] S.-J. Lee and S.-H. Lee, "Flow Field Analysis of a turbulent boundary layer over a Riblet surface," Experiments in Fluids, vol. 30, no. 2, pp. 153-166, 2001. View Article
[2] S. Martin and B. Bhushan, "Fluid Flow Analysis of a shark-inspired microstructure," Journal of Fluid Mechanics, vol. 756, pp. 5-29, 2014. View Article
[3] B. R. Smith, P. Yagle and P. D. McClure, "Computational Simulation of Staggered 3-D Riblets for Skin Friction Drag Reduction," AIAA SCITECH 2023 Forum, 2023 View Article
[4] P. A. Leitl, C. Feichtinger, G. Schatzdorfer and A. Flanschger, "Measurement of riblet defects and their impact on performance," AIAA SCITECH 2021 Forum, 2021 View Article
[5] S. Endrikat, D. Modesti, R. García-Mayoral, N. Hutchins, D. Chung, "Influence of riblet shapes on the occurrence of Kelvin-Helmholtz Rollers," Journal of Fluid Mechanics, vol. 913, 2021. View Article
[6] D. W. Bechert, M. Bruse, W. Hage, J. G. Van Der Hoeven, G. Hoppe, "Experiments on drag-reducing surfaces and their optimization with an adjustable geometry," Journal of Fluid Mechanics, vol. 338, pp. 59-87, 1997. View Article
[7] H. O. Benschop, A. J. Guerin, A. Brinkmann, M. L. Dale, A. A. Finnie, W.-P. Breugem, A. S. Clare, D. Stübing, C. Price, K. J. Reynolds, "Drag-reducing riblets with fouling-release properties: Development and testing," Biofouling, vol. 34, no. 5, pp. 532-544, 2018. View Article
[8] P. A. Leitl, J. Smoker, M. L. Garcia de Albeniz and A. Flanschger ""Numerical and experimental investigation of different Riblet layouts on a Stratos 716 X business jet," AIAA SCITECH 2023 Forum, 2023 View Article
[9] R. García-Mayoral and J. Jiménez, "Drag reduction by Riblets," Philosophical Transactions of the Royal Society A: Mathematical, Physical and Engineering Sciences, vol. 369, no. 1940, pp. 1412-1427, 2011 View Article
[10] F. Yifeng, Y. Chengqing, B. Xiuqin, L. Tao, "Study on drag reduction performance of antifouling ribbed surfaces," Journal of Ship Production and Design, vol. 34, no. 1, pp. 32-41, 2018. View Article
[11] Ansys® Meshing User's Guide, Release 13.0, Help System, ANSYS, Inc.