Journal of Fluid Flow, Heat and Mass Transfer (JFFHMT)
ISSN: 2368-6111

Volume 11 - Year 2024 - Pages 125-137
DOI: 10.11159/jffhmt.2024.013
Fire characteristics of Natural Fibre Composites Subjected to different Heat Flux Intensities
Raphael Ogabi1, Brady Manescau1, Khaled Chetehouna1, Bukola Abiodun2, Abdulwasiu, Mohammed Raji1, Jeffrey Barminas3
1INSA Centre Val de Loire, Univ. Orléans PRISME EA 4229, F-18022 Bourges, France
ogabiraphael@gmail.com ; brady.manescau@insa-cvl.fr
khaled.chetehouna@insa-cvl.fr
abdulwasiu.muhammed.raji@insa-cvl.fr@insa-cvl.fr
2Department of Biological Sciences, Ahmadu Bello University, Zaria, Nigeria
bukolaa255@gmail.com
3National Research Institute for Chemical Technology, Zaria, Nigeria
bjtsware@gmail.com
Abstract - This study examines the combustion characteristics of green biocomposite materials, specifically flax and banana-reinforced Greenposite composites, under varying heat flux densities (20, 35, and 50 kW/m²). Using the Vacuum Assisted Resin Transfer Molding (VARTM) method for fabrication, the materials underwent thermal-physical characterization to assess ignition, flame spread, surface temperature, and gas emissions. Findings indicate that these biocomposites display unique thermal behaviors at different scales; flax-based composites showed better thermal properties at a medium scale, whereas banana-based composites exhibited better performance at a large scale. This research underscores the size-dependent thermal properties of bio-sourced materials and contributes to understanding their fire performance. The study highlighted the size-dependent nature of bio-sourced material thermal properties. This research contributes valuable insights into the fire performance of bio-sourced composites, addressing critical aspects of materials.
Keywords: Green biocomposites, VARTM, NexGen Burner, Cone calorimeter, Thermal properties, Fire safety.
© Copyright 2024 Authors - This is an Open Access article published under the Creative Commons Attribution License terms Creative Commons Attribution License terms. Unrestricted use, distribution, and reproduction in any medium are permitted, provided the original work is properly cited.
Date Received: 2023-11-27
Date Revised: 2024-08-08
Date Accepted: 2024-05-28
Date Published: 2024-06-24
1. Introduction
The development and utilization of composite materials, particularly in the transport sector, have been on a significant rise due to their exceptional mechanical properties, lightweight nature, and high performance in diverse environmental conditions.
Among these composites, biosourced and synthetic types have gained considerable attention due to their potential for sustainability and high-performance characteristics [1]. However, their application brings forth critical challenges, especially concerning their fire behavior. Understanding the fire behavior of these composites when subjected to various heat flux densities is crucial for ensuring safety and compliance with fire standards in the transport industry. The transport industry, encompassing automotive, aerospace, maritime, and rail sectors, constantly seeks materials that offer not only structural efficiency and weight reduction but also economic viability and environmental sustainability.
Biosourced composites, made from natural fibres and bio-based resins, with a polymer matrix, have emerged as leading materials meeting these demands [1], [2]. Their adoption promises enhanced fuel efficiency, reduced carbon emissions, and a lower environmental footprint, aligning with global sustainability goals. However, the integration of these materials into the transport sector's infrastructure and vehicles presents a complex challenge: ensuring robust fire safety standards without compromising their beneficial properties [2].
To address these challenges, experimental studies focusing on the fire behavior of biosourced composites under varied heat flux densities are essential. Such studies provide invaluable insights into the ignition, combustion, and flame spread characteristics of these materials. By examining composites on a medium (cone calorimeter) and large scale (NexGen burner), researchers can better understand the real-world implications of fire incidents in the transport sector. These experimental investigations help in the development of models that predict fire behavior, guiding the design and manufacturing of safer composite materials [3]-[7].
The impact of different heat fluxes on the fire behavior of composites is a critical area of study. Heat flux, a measure of the rate of heat energy transfer per unit area, significantly influences the ignition time, flame spread rate, and overall combustion dynamics of composites. By subjecting biosourced to various heat flux densities, researchers can simulate a range of fire scenarios, from slow smoldering to rapid flashover conditions. This information is pivotal in designing composites that are not only high-performing and sustainable but also exhibit enhanced fire retardancy [8]-[11].
In this study, two biodegradable materials based on bio resin reinforced with flax and banana were manufactured using the Vacuum Assisted Resin Transfer Method (VART Method). In order to provide elements of understanding, two experimental devices aimed at studying the thermal behavior of a composite material were used: (a) a cone calorimeter assimilated to a intermediary scale and (b) the NexGen burner assimilated to a real-life fire condition. The overall objective is to study the effect of three heat flux densities (20, 35 and 50 kW.m-²) and intumescent flame retardant on the thermal, physical and chemical properties of the flax and banana laminate composite materials manufactured.
2. Materials, Equipment and Methods
Flax fibres were selected as natural fibre reinforcement to produce the composite material. The flax fibres used had a 2x2-twill weave structure with an area density of 550 g.m-2 and a linear density of 0.0045 g.m-1. The woven fabric was purchased from Eco-technilin, France.
The banana was chosen as the natural fibre reinforcement to produce the composite material and was inspired by its special properties and possible applications as revealed in Figure 1 (right). The banana fibres used in this study exhibited remarkable properties, including an areal density of 420 g.m-2 and an exceptionally low linear density of 0.00004 g.m-1.
A bio-based epoxy resin called Greenpoxy 56, which contains a bio-based content of 56%, was selected as the matrix for binding the natural fibre reinforcement. It played a crucial role in transferring loads between fibres and giving the composite its final shape. The specific bio-based epoxy resin used, Infugreen 810, was obtained from Sicomin, France. To initiate the curing process of the epoxy system, SD 8822 was used as the hardener/hardener. The epoxy was infused to facilitate the molding of the fibre-reinforced composites (FRC) laminates.
2.1. Biocomposites preparation
The production of green biocomposites based on flax and banana reinforcements using Greenpoxy 56 and an amine hardener was carried out through the Vacuum Assisted Resin Transfer Molding (VARTM) method at INSA CVL Bourges. After the fabrication process, the green biocomposites were carefully trimmed and cut to meet the desired specifications and final dimensions i.e. 100 mm x 100 mm for the cone calorimeter test and 500 mm x 500 mm for the Vesta NextGen burner. The final thickness of the flax and banana green biocomposite obtained are 5.5 ± 0.1 mm and 5.45 ± 0.1 mm respectively. A fire-resistant film coating was then applied to the surface of the green biocomposite.
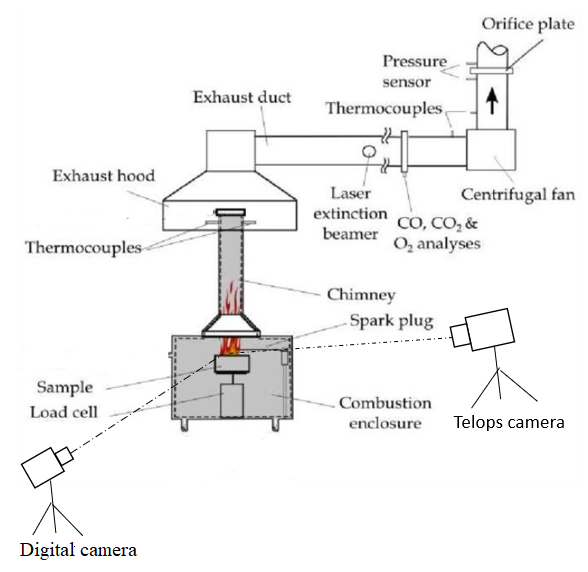
2.2. Cone calorimeter
The experimental setup closely followed the configuration guidelines outlined in the ISO 5660-1:2015 standard as shown in Figure 2. The cone calorimeter used was manufactured by Deatak in the USA. Additionally, the Telops infrared camera was strategically positioned to measure the thermal degradation camera. To ensure repeatability, three samples were examined per test.
Additionally, the Telops infrared camera was strategically positioned to measure the thermal degradation camera. To ensure repeatability, three samples were examined per test.
2.3. NexGen burner
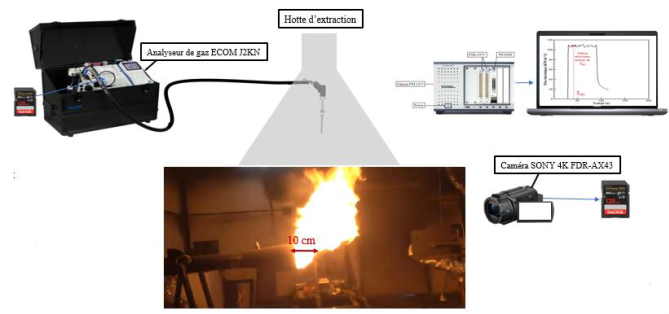
This section introduces the NexGen burner, part of the Fire VESTA experimental setup, designed for assessing material degradation. The test bench, tailored for certification tests resembling aircraft engine incidents, evaluates material thermal degradation exposed to a kerosene/air flame with specific temperature and flow parameters [3]-[5]. Components critical to the burner's functionality, including air and fuel supply systems, are outlined. The sample, held securely in a holder with a deflector, undergoes pinching to ensure stationary testing conditions. The deflector prevents flame bypass, protecting the sample's rear face. A hood, located on the upper part of the test bench, extracts combustion and pyrolysis products. Airflow regulation, managed by a pressure regulator and sonic choke, induces swirling motion with a stator and turbulator for enhanced turbulence. Combustion initiation employs a spark plug activated by a 10-kV voltage at the start of testing. Additionally, the heat flux of the flame was calibrated using the Captec sensor, a Telops camera was used for the surface temperature determination of the biocomposites, a gas analyzer for the gas emission measurement, and a digital camera to monitor the entire process (the setup is shown in Figure 2).
2.4. Methodology
Cone calorimeter: The prescribed standard test of the cone calorimeter allows for authentic degradation scenarios by covering a range of heat fluxes, specifically at 20, 35, and 50 kW.m-². The cone calorimeter provides several significant measurements, including heat release rate (HRR), mass loss rate (MLR), Time to Ignition (TTI), Carbon dioxide (CO2) concentration, Carbon monoxide (CO) concentration, and Smoke production rate (SPR). The test sample's HRR is computed with Equation 1.
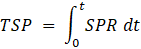
HRR relies on the assumed heat produced per unit mass of oxygen (13.1 MJ/kg O2), the oxygen depletion factor, and the mass flow rate in the exhaust duct (from Equation 2). The total smoke production (TSP) in square meters is obtained by integrating the SPR in square meters per second, as indicated by Equation 3.


Where
![]() ̇: Heat release rate
̇: Heat release rate
E: Activation energy
me: Mass of the material
XO2i: Initial oxygen concentration
∅: Mass fraction of the combustible material
![]() : Correction factor
: Correction factor
me: mass loss rate, t: time
∁√(∆P/Te ): Total heat of combustion
TSP: Total smoke production
SPR: Smoke production rate
NexGen burner: The Captec device with a measuring range of 200 kW.m-² and a sensitivity of 50 mV/(kW.m-²) was used to calibrate the heat flux of the kerosene/air flame at 20, 35, and 50 kW.m-². A gas analyzer, ECOM-J2KN Pro, connected to the NexGen setup collects gas emission species. The experiment was based on the optimum fuel flow rate of 0.0019 kg.s-1, air flow rate of 0.02845kg.s-1, and equivalence ratio of 1.03 to assess the combustion performance of the flax and banana greenpoxy composites.
These samples were placed 73, 62, and 43 cm away from the cone burner to obtain the heat flux conditions of 20, 35, and 50 kW/m² respectively.
Thereafter, the biocomposite combustion test was performed until complete degradation was observed. The mass loss of the composite sample is measured using a SCAIME AG3 center support load cell located under the sample holder with an uncertainty of ±5g.
The Ecom-J2KN Pro analyzer operates with the non-dispersed infrared principle (NDIR) with the accuracy of ±0.2%, ±2%, and ±5% for O2, CO, and CO2 respectively. The surface temperature was also measured with the help of the Telops IR camera which operates via the use of a filter to ghost the flame and record the front-face temperature of the biocomposite samples.
3. Results and discussion
3.1 Cone calorimeter results:
Table 1 summarizes cone calorimetry results for green epoxy composites reinforced with flax and banana fibres. Tests were conducted at heat flux levels of 20, 35, and 50 kW.m-², offering a comparative overview of composite performance under different thermal stress conditions.
Table 1. Cone Calorimeter Tests on Flax and Banana Bio-composites at Various Heat Fluxes.
|
Flax_Greenpoxy |
Banana_ Greenpoxy |
|||||
|
Parameters |
20 kW.m-² |
35 kW.m-² |
50 kW.m-² |
20 kW.m-² |
35 kW.m-² |
50 kW.m-² |
|
Tig (±2)/s |
144.9 |
67.0 |
36.0 |
125.0 |
55.7 |
32.5 |
|
pHRR (±5)/kW.m-² |
495.4 |
693.7 |
823 |
753.1 |
761.9 |
908.6 |
|
pHRRt (±0.5)/s |
319 |
290 |
177 |
154 |
263 |
145 |
|
THE (±3)/MJ |
87.5 |
102.8 |
114.1 |
83.8 |
122.2 |
129 |
|
ARHE (±4)/ kW.m-² |
393.1 |
611.9 |
771.7 |
513 |
790.4 |
1066.6 |
|
FIGRA (±0.2)/kW.m²s-1 |
1.56 |
2.39 |
4.65 |
2.9 |
4.89 |
6.27 |
|
FPI (±0.1)/kW.m²s-1 |
3.44 |
10.35 |
22.86 |
6.02 |
13.68 |
27.96 |
|
Av-CO2Y (±0.002)/kg.kg-1 |
3.08 |
4.004 |
5.638 |
3.00 |
4.294 |
6.133 |
|
Av-COY (±0.005)/kg.kg-1 |
0.086 |
0.1142 |
0.132 |
0.18 |
0.20 |
0.211 |
|
Residue (±0.5)/g |
6.17 |
5.19 |
0.52 |
6.45 |
1.49 |
0.30 |
Flax_G-poxy = Flax-reinforced Greenpoxy composite
Banana_G-poxy = Banana-reinforced Greenpoxy composite
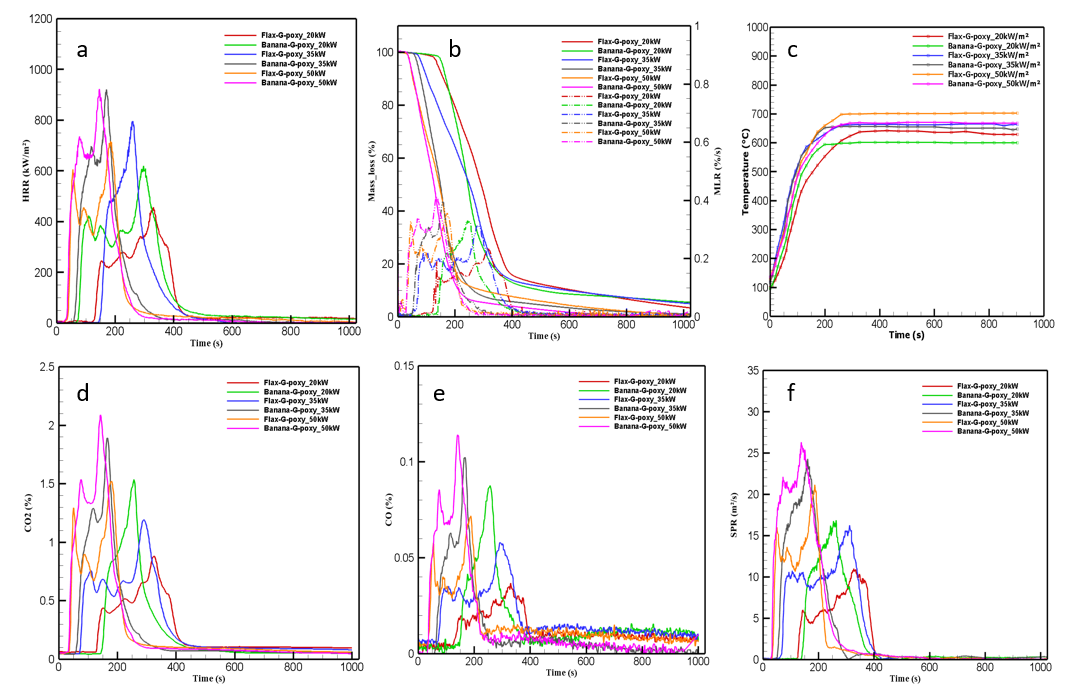
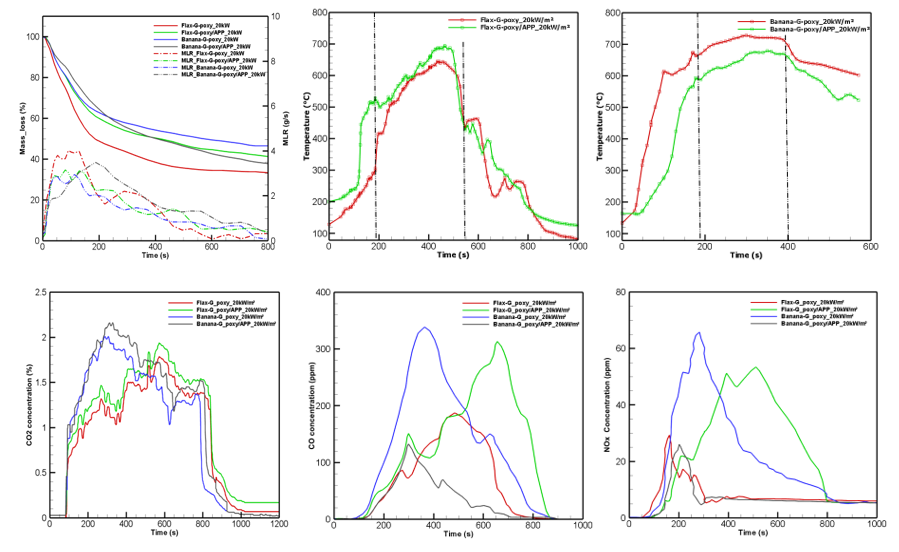
The provided graphs display a series of fire behavior tests for Flax-Greenpoxy and Banana-Greenpoxy composites at different heat fluxes (20 kW.m-², 35 kW.m-², and 50 kW.m-²). The discussion is as follows:
a. Heat Release Rate (HRR):
Figure 3a reveals the study that investigates the fire response of flax and banana biocomposites at varying heat fluxes. For the flax biocomposite at 20 kW.m-², there's a notable delay in ignition (144.9 seconds) and a slow escalation to peak heat release rate (HRR) (319 seconds), with a maximum HRR of 495.4 kW.m-². However, at a higher heat flux of 50 kW.m-², ignition and peak HRR times reduce significantly, with a peak HRR of 823 kW.m-².
As heat flux increases, the HRR of the composite material rises more rapidly, indicating greater sensitivity to heat flux changes. The banana biocomposite, in comparison, shows a higher sensitivity to heat flux variations. It ignites quicker than the flax composite even at lower heat fluxes (20 kW/m²), with shorter times to ignition (125 seconds) and peak HRR (154 seconds), and a higher peak HRR of 753 kW.m-².
At an intermediate heat flux of 35 kW.m-², both flax and banana biocomposites show similar trends in ignition and HRR. At 50 kW.m-², the banana composite ignites even quicker (32.5 seconds), reaches peak HRR faster (145 seconds), and has a higher peak HRR (908.6 kW.m-²) compared to the flax composite.
In summary, the banana biocomposite is more responsive to changes in heat flux, igniting faster and reaching higher HRRs more quickly than the flax biocomposite. This suggests different fire performance characteristics between the two materials, with the banana composite showing a more rapid heat release profile across varying heat flux levels.
b. Mass Loss/mass loss rate:
Initially, all samples show a sharp decline in mass. For instance, Flax Greenposite at 50 kW rapidly loses about 80% of its mass within the first 200 seconds, indicating a high rate of thermal decomposition. At 20 kW, banana composites exhibit slower mass loss compared to flax, with banana retaining over 60% of its mass up to around 200 seconds, versus flax dropping below 40% in the same timeframe.
The peak MLR values indicate the highest rate of combustion. Flax at 50 kW shows a peak MLR close to 0.8% per second around 50 seconds into the test, significantly higher than banana composites at the same heat flux, which peak at approximately 0.6% per second.
After the peak, the MLR for all samples gradually declines. By around 500 seconds, most curves flatten out, suggesting a stabilization as the materials reach a residual mass state.
The 'trench' observed in the MLR data at the 50 kW.m-² condition can be elucidated by examining the chemical and molecular behavior under thermal stress. This pronounced dip in the MLR curve suggests a transient phase in the pyrolytic decomposition process where the rate of mass loss temporarily decelerates. Chemically, this phenomenon can be attributed to the depletion of volatile compounds which are known to combust readily and evaporate at lower temperatures when compared to the more resilient components such as cellulose and lignin.
c. Degradation Temperature:
Fig. 3c provides surface temperature measurements for both FGC (Flax Green Epoxy Composite) and BGC (Banana Green Epoxy Composite) at different heat flux levels: 20 kW.m-2, 35 kW.m-2, and 50 kW.m-2. The surface degrading temperature of the green biocomposites, particularly Flax Greenpoxy Composite and Banana Greenpoxy Composite, hinges on fibre composition, structure, conductivity, diameter, and degradation temperature. These factors shape their thermal behavior, fire safety, and structural integrity. Monitoring these aspects offers valuable insights into optimizing these eco-friendly materials for various applications. Incorporating advanced tools like the Telops thermal camera into the Cone Calorimeter enhances this critical assessment.
The peak temperature for FGC decreases with higher heat flux levels. It ranges from 567.6 °C at 20 kW.m-2 to 641.5 °C at 35 kW.m-² and 705 °C at 50 kW.m-². For BGC, the peak temperature follows a similar pattern. It starts at 634.5 °C at 20 kW.m-², increases to 672.9 °C at 35 kW.m-², and reaches 724.8 °C at 50 kW.m-².
This graph in Fig. 3d shows the production of CO2 as a combustion product. The Flax-Greenpoxy composite produces more CO2, especially at higher heat fluxes, which aligns with its higher HRR and indicates more complete combustion. It appeared that the increase in HRR was directly proportional to the increase in CO2 production rate, mainly due to the increased production of combustible gases.
e. CO Production:
Carbon monoxide (CO) yield (Fig. 3e) initiated its ascent following exposure to the cone heater's prescribed heat fluxes at 20, 35, and 50 kW.m-².
In addition to the mass loss data discussed earlier, these measurements indicated that carbon monoxide (CO) was one of the constituents of the non-burning gas mixture released during the pyrolysis of the green biocomposites (FGC and BGC).
The emission of this gas increased as the heat flux applied to both green biocomposites increased. It is highly likely that this release of CO primarily originated from the upper surface of the material.
This initial increase was characterized by a peak, which was followed by a subsequent decline in CO production.>
Subsequently, CO production experienced a resurgence due to incomplete combustion during the flaming combustion phase, reaching a peak almost concurrently with the peak HRR. Following this, CO production exhibited a declining trend as the fuel load diminished. CO production began to increase again as the flameout phase approached, reaching another peak when the HRR curve stabilized. Subsequently, the rate of CO production gradually decreased. This observed trend suggested that incomplete combustion intensified close to flameout, transitioning into smoldering combustion. During this phase, the residue of epoxy, present both on the material's surface and between flax fibre plies, continued to burn, albeit without an open flame, resulting in the relatively significant emission of CO.
f. Smoke Production (SPR):
According to Fig. 3f, at low heat flux (20 kW.m-²), the combustion of both FGC and BGC was relatively slower compared to higher heat flux levels. The rate of smoke production was lower at this heat flux, as the materials have more time to char and release smoke gradually.
At a moderate heat flux (35 kW.m-²), a moderate increase in the rate of combustion for both materials was observed. Smoke production showed an increase compared to the lower heat flux, but was relatively moderate compared to higher heat flux levels.
At high heat flux (50 kW.m-²), the combustion process for both FGC and BGC was significantly accelerated. The rate of smoke production was revealed to be highest at this heat flux level, as the materials burnt more rapidly and released smoke more quickly.
It's worth noting that delamination of the green biocomposite materials occurred during the combustion process which exposed the unburned greenepoxy and fibres to the external heat flux, which could have contributed to the increased smoke production. This effect becomes more pronounced at higher heat flux levels.
The peak smoke production rate of BGC at 50 kW.m-2 is about 27 m2.s-1 while that of FGC is 21 m².s-1. The specific differences in smoke production between FGC and BGC can be attributed to the varying compositions of fibre reinforcements present in green biocomposite materials. BGC, with its higher cellulosic content and lower lignin content, tends to combust more readily, leading to faster smoke generation. In contrast, FGC, with its lower cellulosic content and slightly higher lignin content, exhibits a relatively slower combustion process and reduced smoke production. Thus, the peak SPR of BGC is about 12.5 % higher than BGC. These differences highlight the importance of material selection and composition in determining fire safety characteristics.
3.2 NexGen burner results:
This section presents the results concerning the effect of fibre type, heat flux variation, and fire retardant on the fire behavior of the biocomposites during combustion (Fig. 4).
The study includes assessing heat flux intensities at 20 kW.m-², 35 kW.m-2, and 50 kW.m-2. This is achieved by placing the Captec sensor at varying distances from the central point of the cone burner (74 cm, 62 cm, and 43 cm respectively) to replicate combustion conditions in a cone calorimeter. The objective is to compare how Flax and banana-reinforced biocomposites behave in large-scale fire situations, offering valuable insights into real-life fire scenarios.
The biocomposite materials of 50 x 50 cm dimensions are then placed in front of the flame at the designated positions for the test until complete degradation at the region of exposure is achieved.

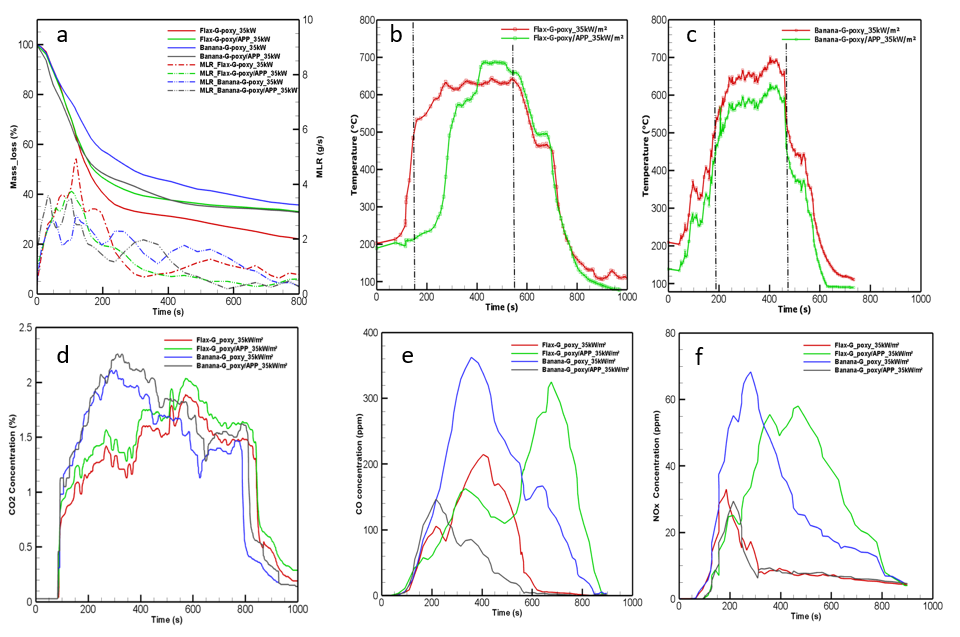
a. Mass Loss and Mass Loss Rate:
In Fig. 4a, 5a and 6a, both Flax-Greenpoxy and Banana-Greenpoxy composites exhibit a reduction in mass as time progresses, which is indicative of material degradation due to the applied heat.
The mass loss for both composites is greater at higher heat flux conditions (35 kW.m-² and 50 kW.m-²) compared to the lower heat flux (20 kW.m-²). This is expected as higher heat flux would typically result in more intense thermal degradation.
The Banana-Greenpoxy composite tends to lose mass more rapidly than the Flax-G composite, which might be due to differences in thermal stability and composition between the two materials. The Banana-Greenpoxy composite may have components that degrade or volatilize more quickly when subjected to heat.
The MLR, represented by the dashed lines, indicates the rate at which mass is lost over time.
Higher peaks in MLR correspond to faster rates of mass loss at specific times during the experiment. The Banana-Greenpoxy composites have higher peaks in MLR compared to the Flax-Greenpoxy composites, suggesting that the Banana-Greenpoxy composites experience periods of more rapid degradation.
The MLR for both materials tends to increase with higher heat flux conditions, which correlates with the fact that higher heat fluxes induce more rapid thermal degradation.
Material Composition: The inherent differences in material composition between Flax-Greenpoxy and Banana-Greenpoxy composites could result in different thermal degradation behaviors. The Banana fibres might have a composition that degrades faster under heat, leading to a higher MLR.
Thermal Stability: The thermal stability of the matrix and the fibres in the composites can significantly affect mass loss and MLR. If Banana fibres have lower thermal stability than Flax fibres, this could explain the more significant mass loss and higher MLR.
Heat Transfer Properties: The efficiency of heat transfer through the composite materials can affect how quickly they degrade. If the Banana-G composite has poorer heat transfer properties, it could lead to quicker and more localized overheating, thus a higher MLR.
Char Formation: The formation of a char layer can act as a thermal barrier. Differences in how Flax and Banana fibres char could influence the rate of mass loss. If Flax fibres form a more protective char, this could result in a lower MLR compared to Banana fibres.
Overall, these results can provide insights into the suitability of these composites for various applications, especially where thermal resistance is a key factor. The faster mass loss and higher MLR of Banana Greenpoxy at all heat flux conditions suggest that Flax Greenpoxy might be more suitable for applications requiring higher thermal resistance.
b. Degradation Temperature:
Fig. 4b, 5b and 6b, features the surface temperature data captured by a Telops infrared camera, details the thermal response of Flax Greenpoxy and Banana Greenpoxy composites under varying heat flux conditions of 20 kW.m-², 35 kW.m-², and 50 kW.m-². The temperature trends over time are plotted for these three scenarios.
At 20 kW.m-²: Both composites show a steady temperature rise, with the Banana composite heating faster and reaching a higher peak temperature compared to the Flax composite.
At 35 kW.m-²: There is an accelerated temperature increase for both materials compared to the 20 kW.m-² scenario, with the Banana composite again achieving a higher peak temperature more rapidly. The Flax composite, while also reaching high temperatures, maintains these temperatures for a longer duration before beginning to cool.
At 50 kW.m-²: This scenario presents the fastest temperature rise, particularly for the Banana composite, which exhibits the quickest and highest peak temperature of all conditions tested. The Flax composite also reaches a high peak but at a slower rate and shows a more gradual decrease in temperature over time.
The Banana Greenpoxy composite consistently heats up to higher temperatures more quickly than the Flax composite across all heat flux levels. This suggests that the Banana composite reacts more rapidly to heat application but also cools down faster. Conversely, the Flax composite, while slower to reach peak temperatures, tends to retain heat for a longer period. This characteristic could indicate better thermal stability and slower heat dissipation, which might be advantageous in applications where maintaining a higher temperature for an extended period is beneficial.
d. CO2 Production:
In the investigation of CO2 concentration evolution over time for Flax Greenpoxy and Banana Greenpoxy composites under varying heat flux conditions as shown in Fig. 4d, 5d and 6d, a comprehensive analysis reveals distinct behaviors between the two materials. Initially, as combustion commences, an increase in CO2 concentration is observed for all samples, reaching peaks at various intervals directly correlated with the applied heat flux. Notably, at higher heat fluxes, the observed peaks in CO2 concentration are significantly elevated, indicative of more intense combustion processes and consequent enhanced CO2 generation.
Particularly, the Banana Greenpoxy composites display a tendency to achieve these peak concentrations at a swifter pace than the Flax Greenpoxy, with the most pronounced differences appearing at 35 kW.m-² and 50 kW.m-² heat flux conditions. Following the peak, a decline in CO2 concentration is consistently seen across all samples, which could potentially be ascribed to the exhaustion of combustible material or the emergence of a protective char layer that impedes further combustion.
A detailed comparison of the composites underscores that the Banana-Greenpoxy consistently reaches a higher marked peak in CO2 concentration across all heat flux conditions in comparison to the Flax Greenpoxy.
This distinction may be attributed to the disparate combustion characteristics inherent to the materials constituting the composites.
Delving into the possible reasons behind these trends, several factors come to the fore. The differential in peak CO2 concentrations and the rate at which they are achieved may be linked to the combustion efficiency of the materials. The Banana Greenpoxy composite, with its unique composition, might facilitate a more complete combustion, hence the higher CO2 concentrations observed. Furthermore, the material composition, including the properties of the fibres and the matrix within the composites, substantially influences the combustion process. Should the Banana fibres possess a more combustible nature or a higher carbon content, this would invariably result in elevated CO2 concentrations.
The thermal stability of the materials alongside the temperatures at which they decompose also plays a pivotal role in CO2 production. Materials that decompose at lower temperatures are likely to commence CO2 production sooner, thereby reaching peak concentrations more rapidly. Additionally, the influence of heat flux is non-negligible; the augmented energy input at higher heat flux conditions precipitates a rapid escalation to peak CO2 concentrations, accelerating the combustion process.
e. CO Production:
The graphical data presented in Figure 4e, 5e and 6e, provides an insightful analysis of carbon monoxide (CO) emission from Flax-Greenpoxy and Banana-Greenpoxy composites under a range of heat flux conditions. Initially, both composites exhibit a rise in CO concentration, hitting their peaks at different times based on the heat flux applied.
This increase is a typical characteristic of the combustion process where the highest concentration points signify the most intense phase of combustion.
For Flax-Greenpoxy, the CO concentration increases moderately at a lower heat flux of 20 kW.m-², with the peak concentration occurring around the 200-second mark. As the heat flux intensifies to 35 kW.m-² and 50 kW.m-², there is a noticeable escalation in the CO concentration, reaching a zenith earlier, particularly at the highest heat flux which indicates a more rapid combustion rate and increased CO output. In contrast, the Banana-Greenpoxy composites demonstrate a similar trend at 20 kW.m-²; however, they attain a slightly higher peak in CO concentration. At the escalated heat fluxes of 35 kW.m-² and 50 kW.m-², the Banana-Greenpoxy composites reveal a more significant and quicker rise to peak CO levels compared to the Flax-Greenpoxy, suggesting a more rapid rate of combustion.
In contrast, the Banana-Greenpoxy composites demonstrate a similar trend at 20 kW.m-²; however, they attain a slightly higher peak in CO concentration. At the escalated heat fluxes of 35 kW.m-² and 50 kW.m-², the Banana-Greenpoxy composites reveal a more significant and quicker rise to peak CO levels compared to the Flax-Greenpoxy, suggesting a more rapid rate of combustion.
Several factors contribute to these observed trends, including the distinct combustion characteristics of the composites, which could be influenced by the inherent properties of the banana fibres or the resin matrix. An increase in heat flux naturally leads to a higher rate of combustion, evidenced by the pronounced peaks in CO concentration at higher heat flux levels for both material types. Moreover, the quicker attainment of peak CO levels in the Banana-Greenpoxy composites at increased heat fluxes may indicate a propensity for faster degradation or combustion of this material.
f. NOx Production:
Figure 4f, 5f and 6f reveal that at an intensity of 20 kW.m-², NOx emissions for Flax-Greenpoxy decreased from 30 ppm to 60 ppm for Banana-Greenpoxy. When the intensity increased to 35 kW.m-², the NOx emissions reduced from 35 ppm for Flax-Greenpoxy to 68 ppm for Banana-Greenpoxy. At a higher intensity of 50 kW.m-², the NOx emissions decreased from 38 ppm for Flax-Greenpoxy to 70 ppm for Banana-Greenpoxy.
Overall, the results suggest that both composites combust more intensely at higher heat fluxes, with more rapid temperature rise, higher peak gas emissions. Flax-Greenpoxy tends to show more pronounced reactions in terms of gas emissions, suggesting a potentially more vigorous combustion process compared to Banana-Greenpoxy. This behavior is as a result of the different cellulosic and lignin compositions of the composites materials.
The implications of these results are twofold. First, they contribute valuable data to the domain of fire safety engineering, particularly in the application and design of bio-sourced composites in the transport industry. Second, they offer a pathway for future research to explore the incorporation of novel fire retardant technologies and the development of composites with tailored fire-resistant properties.
As bio-sourced composites continue to gain traction as sustainable alternatives in various industrial applications, the insights derived from this study will play a pivotal role in enhancing their design and integration, ensuring that fire safety remains a cornerstone of sustainable development in material science.
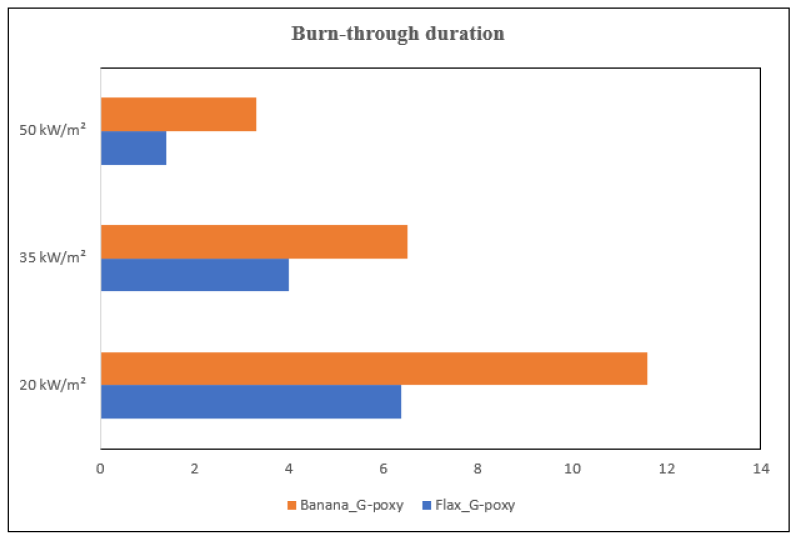
3.2.1 Burn-through test
Figure 7 presents the burn-through duration of flax and banana-reinforced Greenposite composites under different heat flux densities: 20, 35, and 50 kW.m-². This duration measures the time required for fire to completely penetrate the composite material [5].
Flax Greenposite shows remarkable resilience at 20 kW.m-², with a burn-through duration of approximately 12 minutes, suggesting effective thermal resistance at lower heat exposures. This duration decreases significantly as the heat flux increases to 35 kW.m-² and 50 kW.m-², dropping to about 8 and 6 minutes respectively. The decreasing trend indicates that while flax fibres provide substantial insulation, their protective capacity diminishes under intense heat exposure.
Banana-Greenpoxy composite, in contrast, demonstrates shorter burn-through times across all heat flux densities, with durations of approximately 8 minutes at 20 kW.m-², and reducing further to about 6 and 4 minutes at 35 and 50 kW.m-² respectively. The faster degradation of banana fibres under heat stress suggests lower thermal stability compared to flax fibres.
3.2.2 Post-fire decay test
The post-fire decay durations, shown in Figure 8, evaluate how long the materials continue to smolder or release heat after the flame source is removed [5].
For banana-Greenpoxy, the decay durations are significantly longer across all heat flux levels, ranging from about 20 minutes at 20 kW.m-² to nearly 23 minutes at 50 kW.m-². This extended smoldering indicates that banana fibres, while less resistant during active burning, tend to retain heat longer, potentially due to residual chemical reactions within the material.
Flax Greenposite exhibits shorter decay times, from around 15 minutes at 20 kW.m-² to 18 minutes at 50 kW.m-², reflecting a more rapid cessation of thermal activity post-burning. The quicker cool-down suggests better overall fire safety performance in post-fire scenarios.
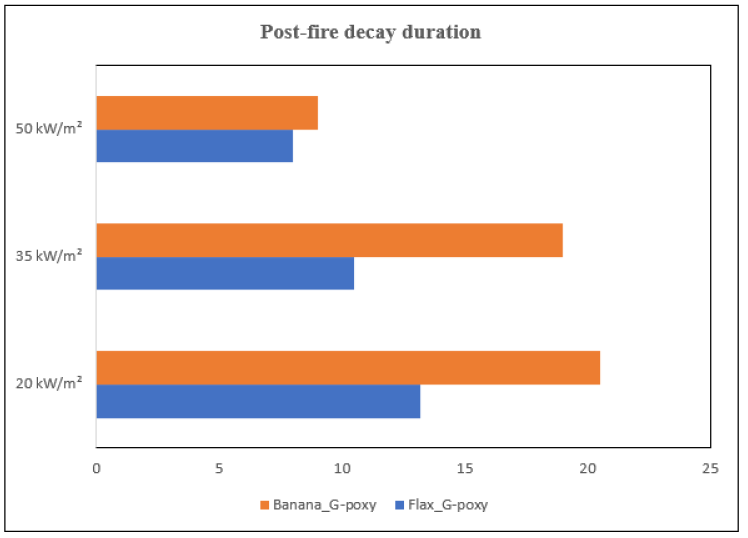
The differing thermal behaviors of flax and banana-reinforced composites can be attributed to the unique interactions between the bio-fibres and the Greenposite matrix. Flax fibres, likely due to their higher lignin content, form a denser char layer under heat, which effectively slows down heat penetration initially but also loses efficacy more quickly at higher temperatures. In contrast, the banana fibres exhibit faster initial burn-through but continue to smolder longer, posing a different kind of fire hazard.
4. Conclusion
This comprehensive study offers significant insights into the fire behavior of flax and banana-reinforced Greenpoxy biocomposites subjected to various heat flux densities. Through meticulous experimental designs using the cone calorimeter and NexGen burner, we have successfully delineated the thermal and combustion characteristics of these biocomposites, highlighting their distinct responses under different thermal stresses.
Our findings reveal that the thermal performance of flax and banana biocomposites is notably influenced by the type of bio-fiber reinforcement and the heat flux conditions. The banana-reinforced Greenpoxy composites demonstrated a quicker response to increased heat flux, exhibiting higher rates of mass loss and peak temperatures, which may suggest lower thermal stability but faster reactive dynamics in fire scenarios. Conversely, the flax-reinforced composites displayed a more controlled and delayed thermal response, suggesting better insulation properties and potentially higher thermal resistance.
Moreover, the study underscores the importance of understanding the interaction between bio-fiber properties and matrix behavior in fire conditions. This interaction profoundly affects the biocomposites' fire safety performance, particularly in terms of flame spread, smoke production, and overall fire growth, which are critical factors in safety engineering and fire risk assessment in the transport sector.
Acknowledgements
I would like to sincerely thank the Petroleum Technology and Development Fund (PTDF) for funding this research and the National Research Institute for Chemical Technology for all their support during my doctoral studies. Also, I would like to appreciate the P2CF research laboratory at INSA CVL in France where the research was carried out.
References
[1] R. Ogabi, B. Manescau, K, Chetehouna, N. Gascoin, "A Study of Thermal Degradation and Fire Behaviour of Polymer Composites and Their Gaseous Emission Assessment." Energy, 14, 1-32. 2021, https://doi.org/10.3390/en14217070. View Article
[2] J. Luche, T. Rogaume, F. Richard, and E. Guillaume, "Characterization of thermal properties and analysis of combustion behavior of PMMA in a cone calorimeter," Fire Saf. J., vol. 46, no. 7, pp. 451-461, 2021 doi: 10.1016/j.firesaf.2011.07.005. View Article
[3] Y. H. Kao, R. Ochs, and S. Summer, "Experimental study of the burner for FAA fire test : NexGen burner," pp. 1-10, 2017, doi: 10.1002/fam.2429. View Article
[4] E. Schuhler, A. Chaudhary, B. Vieille, and A. Coppalle, "Fire Behaviour of Composite Materials Using Kerosene Burner Tests at Small-Scales," Fire Saf. J. 121. 2021, DOI: 10.1016/j.firesaf.2021.103290. View Article
[5] S. Bourbigot, J. Sarazin, C. A. Davy, and G. Fontaine, "Foamed geopolymers for fire protection: Burn-through testing and modeling," Fire Mater., vol. 46, no. 7, pp. 1011-1019, Nov. 2022. DOI: 10.1002/FAM.3048. View Article
[6] R. Ogabi, B. Manescau, K. Chetehouna, E. Obame, S. Senave, "The Impact of Equivalence Ratio on the Fire Characteristics of Kerosene/Air Flame Produced by NexGen Burner for Aeronautic Application". Case Stud. Therm. Eng. 2024, 104004.https://doi.org/10.1016/J.CSITE.2024.104004. View Article
[7] M. Rashid, J. L. Hanus, K. Chetehouna, K. Khellil, Z. Aboura, and N. Gascoin, "Investigation of the effect of tufts contribution on the in-plane mechanical properties of flax fibre reinforced green biocomposite," Funct. Compos. Mater., vol. 2, no. 1, pp. 1-13, Apr. 2021. DOI: 10.1186/S42252-021-00019-Z. View Article
[8] R. Ogabi, B. Manescau, K. Chetehouna, and S. Senave, "Investigation of the flame properties and fire behavior of carbon-reinforced PEKK, BMI and phenolic composites impacted by Jet-A1/air flames," Fire Mater., no. September, pp. 1-16, 2023, doi: 10.1002/fam.3179. View Article
[9] T. Fateh, C. Kahanji, and P. Joseph, "A study of the effect of thickness on the thermal degradation and flammability characteristics of some composite materials using a cone calorimeter," 2017, doi: 10.1177/0734904117713690. View Article
[10] A. Ramgobin, G. Fontaine, and S. Bourbigot, "Thermal Degradation and Fire Behavior of High Performance Polymers," Polym. Rev., vol. 59, no. 1, pp. 55-123, 2019, doi:10.1080/15583724.2018.1546736. View Article