Journal of Fluid Flow, Heat and Mass Transfer (JFFHMT)
ISSN: 2368-6111

Volume 11 - Year 2024 - Pages 116-124
DOI: 10.11159/jffhmt.2024.012
Techno-Economic Comparison Of The ORC And The PEORC For Low-Temperature Industrial Waste Heat Recovery
Anastasios Skiadopoulos1, Dimitrios Manolakos1
1Agricultural University of Athens, Department of Natural Resources Utilization and Agricultural Engineering
75 Iera Odos, Athens, Attica, Greece 11855
tskiado@aua.gr; dman@aua.gr
Abstract - In this paper, the Organic Rankine Cycle (ORC) and the Partially Evaporated Organic Rankine Cycle (PEORC) are techno-economically compared for low-temperature waste heat recovery, with a particular focus on industrial applications. Numerical models of the two power cycles were developed, while a dedicated two-phase expansion model simulating the performance of an industrial expander in the two-phase region was applied to estimate more precisely the efficiency of the PEORC. Different WFs, temperatures of the heat source, and waste heat transfer rates were considered for a complete mapping of the power cycles’ efficiency. The PEORC power cycle simulations indicate that its heat-to-power efficiency is highly dependent on the performance of the two-phase expander, with vapor quality at the evaporator outlet identified as the most crucial operating parameter. The efficiency comparison between the two alternative power cycle architectures reveals that the PEORC performs consistently better, achieving thermal efficiencies between 2.28% and 7.75%, whereas the respective values for the ORC are in the range of 1.25% to 7.13%. Both the ORC and the PEORC demonstrate favorable financial performance for the studied operating conditions. By applying the PEORC, the Levelized Cost Of Electricity (LCOE) for the industry is expected to fluctuate between 0.015 and 0.119 €/kWh, 16-17% lower than the values estimated with the ORC. Favorable PayBack Periods (PBP) (4-5 years) and Net Present Values (NPV) (260-480k€) are expected when the PEORC is applied, always higher than the respective values for the ORC because of its increased energy efficiency.
Keywords: Industrial waste heat, ORC, PEORC, Energy efficiency, Financial performance.
© Copyright 2024 Authors - This is an Open Access article published under the Creative Commons Attribution License terms Creative Commons Attribution License terms. Unrestricted use, distribution, and reproduction in any medium are permitted, provided the original work is properly cited.
Date Received: 2023-10-05
Date Revised: 2024-05-17
Date Accepted: 2024-05-27
Date Published: 2024-06-14
1. Introduction
The optimal utilization of energy sources is a prerequisite in the global effort to increase the sustainability of modern societies. One of the pillars on which this effort must be based is the improvement of the primary energy conversion efficiency of major energy consumers, such as in the industrial sector. In the industry, energy efficiency can be substantially increased by utilizing the large amounts of waste heat generated from processes. Industrial waste heat is estimated to approach, on a global scale, nearly 70% of the primary energy input [1], with the highest share (rising to over 60% [1], [2]) rejected at heat source temperatures lower than 100oC, a range commonly designated as low-temperature heat.
A common technological solution for the exploitation of low-temperature waste heat, directly applicable in the industry, is the installation of a bottoming power cycle. A well-established power cycle in the low-temperature heat range is the Organic Rankine Cycle (ORC), which can be driven by different heat sources, including waste heat, solar irradiance, geothermal power, and biomass. The ORC operates on the same principle as the steam Rankine Cycle, but the Working Fluid (WF) can be selected among a variety of substances, such as refrigerants and hydrocarbons, with low boiling temperatures at high pressures. This flexibility in WF selection constitutes the main advantage of the ORC. This is because the design of the power cycle can be adapted to the characteristics of the heat source. Furthermore, the type of power generator can be selected to maximize the efficiency of the ORC, with turbines typically applied in large-scale systems, and volumetric expanders, such as piston, twin-screw, scroll, and rotary vane, used in small-scale units [3]. The flexible design of the ORC has led to its wide-scale application, and it is now considered a mature and robust technology with low operating and maintenance costs, and nearly unsupervised operation [4].
The main drawback of the ORC is the increased exergy losses of the heat source during the evaporation of the WF [5]. The exploitation of the heat source’s exergy can be increased by omitting the evaporation of the WF, in which case the power cycle assumes a trilateral shape, and an optimal match between the temperature profiles of the heat source and the WF is accomplished. The trilateral cycle is known as the Trilateral Flash Cycle (TFC), and it was originally conceived for the maximization of power generation in geothermal power plants [6], [7]. The TFC consists of the same WF thermodynamic processes as the ORC, but the WF flows out of the evaporator in the saturated liquid state, and, thereafter, it undergoes two-phase expansion in the power generator. The TFC is realized by increasing the mass flow rate of the WF, which leads to the absorption of higher amounts of heat from the WF, and, as a result, to the generated power maximization. The risk of erosion by liquid droplets renders turbines unsuitable for two-phase expansion [8]. On the other hand, twin-screw expanders are indicated in the literature as the ideal expansion machine for the TFC [9] because of their ability to handle two-phase flows and operate at high rotational speeds with minimum friction losses. However, the very high volume ratios of the WF in the TFC cannot be easily handled by state-of-the-art twin-screw expanders applied in ORC units, with very low isentropic efficiencies documented in the literature when the expansion of the WF starts from the saturated liquid state [10], [11]. To overcome this shortcoming of the TFC, the Partially Evaporating ORC (PEORC) power cycle was introduced[12]. In this power cycle architecture, only a fraction of the WF’s mass is evaporated, resulting in intermediate volume ratios during two-phase expansion. The PEORC combines the advantages of the ORC and the TFC, featuring increased heat source utilization compared to the ORC, and higher two-phase expansion efficiency than the TFC.
In this study, the PEORC and the ORC are techno-economically compared for low-temperature waste heat recovery applications, relevant to the industry, with the maximum temperature of the heat source and heat duty at the evaporator reaching 100oC and 300 kWth, respectively. At first, the efficiency of the two power cycles in recovering a heat source with the aforementioned range of characteristics is compared. These results are used to compare the financial performance of the two different power cycles and quantify the respective potential benefits for an industrial unit. For this research work, a numerical model simulating the operation of the two power cycles under different temperatures of the heat source, heat duties at the evaporator, and different WFs was developed. A main novelty of the presented herein work is the utilization of a novel semi-empirical low-order thermodynamic model to simulate two-phase expansion in a twin-screw expander [13] in PEORC power cycle simulations. The application of this numerical tool allows for a better estimation of the two-phase expansion efficiency, the phenomenon that mainly affects the performance of the PEORC. In this way, the PEORC potential as an ORC alternative for industrial waste heat recovery applications can be assessed more realistically. The power cycles’ simulations indicate that the PEORC outperforms, in terms of heat-to-power conversion efficiency, the ORC for all the studied operating scenarios. Both the ORC and the PEORC demonstrate favorable financial performance for the studied applications. However, the increased energy efficiency of the PEORC is depicted systematically in the estimated values of all the utilized financial indexes. The methodology and results presented in this work may be utilized by the industry as a guide when assessing different technological solutions to exploit waste heat from processes.
2. Methodology
2. 1. Thermodynamic modeling
Qualitative Temperature-entropy (T-s) diagrams of the PEORC and the ORC are presented in Figure 1, where the thermodynamic processes undergone by the Heat Transfer Fluid (HTF) and the Cooling Fluid (CF) are also drawn. As mentioned in the Introduction, the thermodynamic processes of the WF are the same for both power cycles, namely a) 1→2: Adiabatic pumping, b) 2→3: Heat absorption at the evaporator, c) 3→4: Adiabatic expansion, and d) 4→1: Heat rejection at the condenser. The values of the parameters used for the simulations presented herein, along with their descriptions, symbols, and units are listed in Table 1.
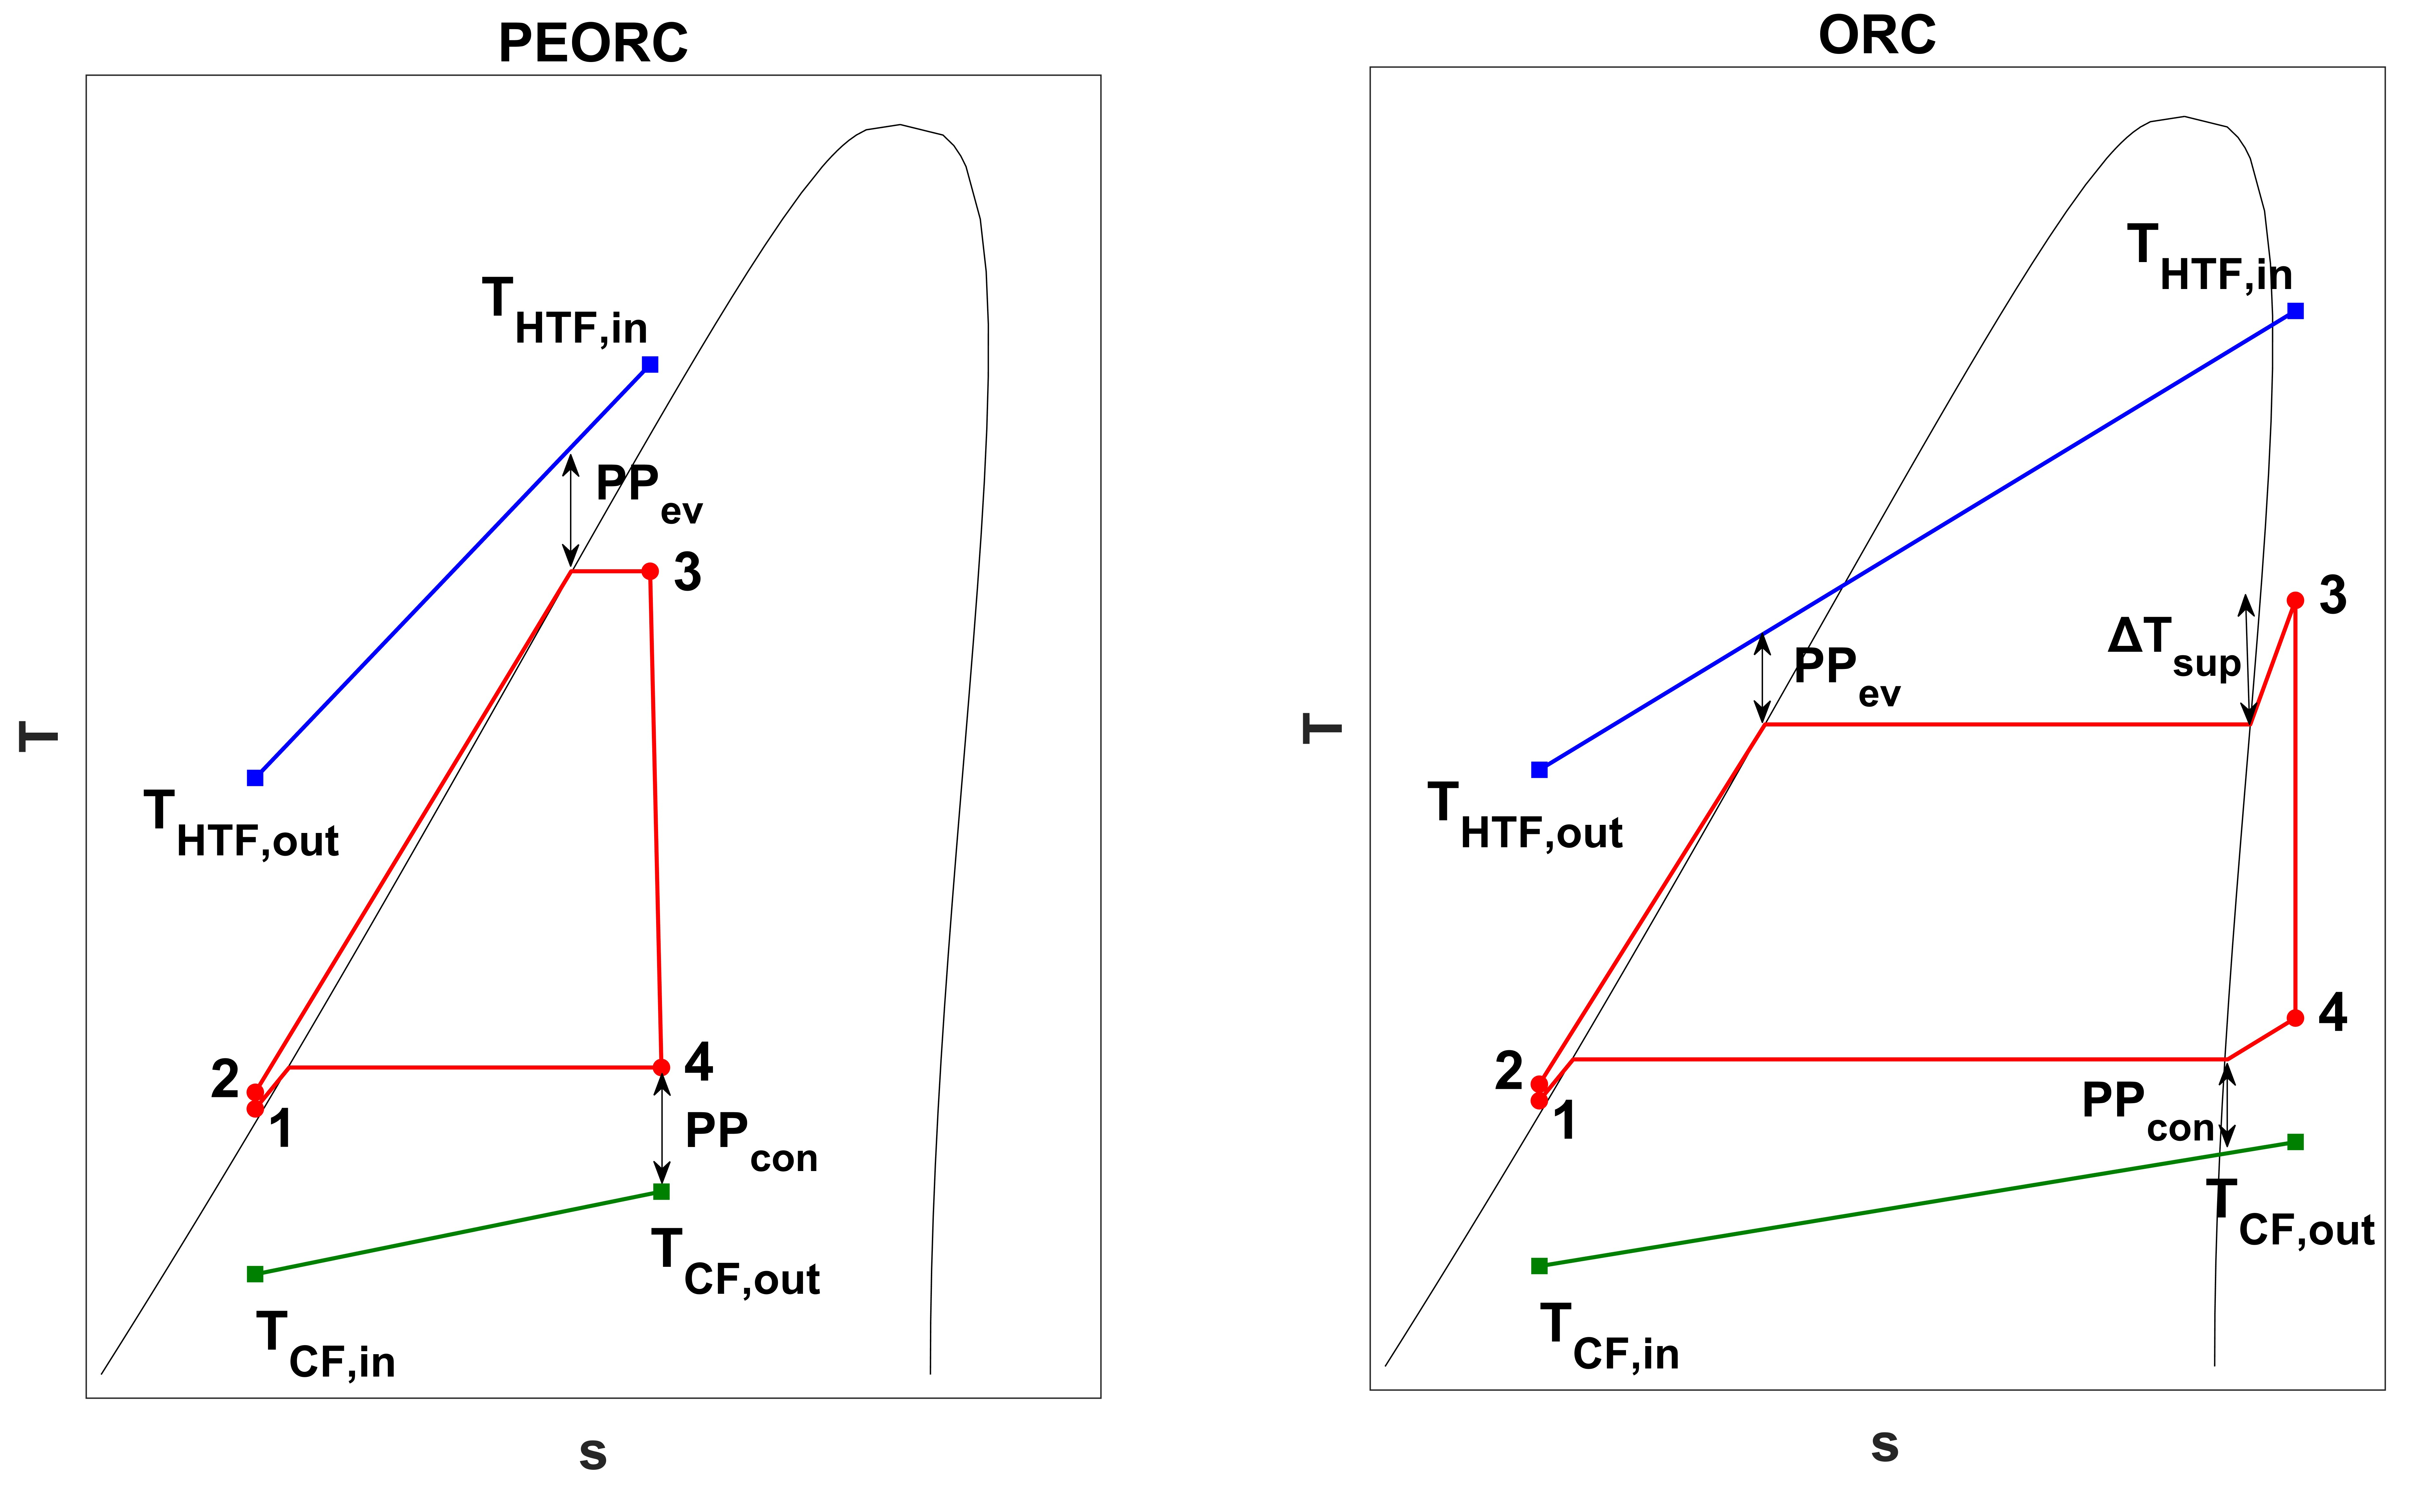
In the evaporator, the temperature of the HTF drops from THTF,in to THTF,out. The temperature of the CF at the inlet of the condenser is equal to TCF,in, and it rises to TCF,out at the condenser pinch point, as in Eq. 1. The condensation temperature Tcon of the WF is then given by Eq. 2. The calculation of Tcon leads to the determination of the WF condensation pressure pcon.

The heat duty ![]() at the evaporator is given by Eq. 3,
where
at the evaporator is given by Eq. 3,
where ![]() is the specific heat, under constant
pressure, of the HTF, and
is the specific heat, under constant
pressure, of the HTF, and ![]() its temperature at the evaporator
outlet. Ignoring the heat losses at the evaporator,
its temperature at the evaporator
outlet. Ignoring the heat losses at the evaporator, ![]() is also given by Eq. 4,
where
is also given by Eq. 4,
where ![]() is the mass flowrate of the WF,
whereas
is the mass flowrate of the WF,
whereas ![]() and
and ![]() denote its specific enthalpy at
states 2 and 3, respectively.
denote its specific enthalpy at
states 2 and 3, respectively.


By applying Eq. 5, the temperature THTF,pr of the HTF at the end of preheating is calculated, for a given value of the WF evaporation pressure pev. In Eq. 5, TWF,sat (pev is the saturation temperature of the WF at pev. The heat duty ![]() of the evaporator is given by Eq. 6, where hl,sat (pev ) represents the specific enthalpy of the saturated liquid WF at pev.
of the evaporator is given by Eq. 6, where hl,sat (pev ) represents the specific enthalpy of the saturated liquid WF at pev.


Table 1: Parameters for PEORC and ORC simulations.
|
Parameter |
Description [Units] |
Value |
|
WF |
Working Fluid [-] |
R245fa, R1234ze(Z), R1234ze(E) |
|
HTF |
Heat Transfer Fluid [-] |
H2O |
|
Mass flowrate of the HTF [kg/s] |
2 |
|
| hehtf |
HTF pump head [m] |
10 |
| PPev |
Pinch point at the evaporator [oC] |
5 |
| PPcon |
Pinch point at the condenser [oC] |
5 |
| THTF,in |
HTF temperature at the evaporator inlet [oC] |
80-100 |
| TCF,in |
CF temperature at the condenser inlet [oC] |
30 |
|
Heat duty at the evaporator [kWth] |
100-300 |
|
| CF |
Cooling Fluid [-] |
Air |
| ΔTCF |
Temperature rise of the CF [oC] |
10 |
| ΔTsub |
WF sub-cooling at the condenser [oC] |
5 |
| ΔTsp |
WF superheat at the evaporator in ORC [oC] |
1-5 |
| x3 |
Quality of the WF at the onset of expansion in PEORC [-] |
0.1-0.9 |
| ηpu,is |
Pump isentropic efficiency [%] |
70 |
| ηem |
Electromechanical efficiency [%] |
90 |
By inspecting Eqs. 3 to 6, two unknown variables are identified, namely ![]() and pev. Moreover, a degree of freedom is also pinpointed, i.e. the value of x3 for the PEORC and of ΔTsp for the ORC. By specifying the desired values for x3 and ΔTsp (within the ranges prescribed in Table 1), the solution of the set of Eqs. 3 to 6 leads to the calculation of m'WF and pev for a given value of
and pev. Moreover, a degree of freedom is also pinpointed, i.e. the value of x3 for the PEORC and of ΔTsp for the ORC. By specifying the desired values for x3 and ΔTsp (within the ranges prescribed in Table 1), the solution of the set of Eqs. 3 to 6 leads to the calculation of m'WF and pev for a given value of ![]() .
.
The isentropic efficiency ηex,is of the expander is given by Eq. 7, where h4 is the WF’s specific enthalpy at state, and h4,is is its specific enthalpy corresponding to its isentropic expansion from state 3 to pcon. In ORC simulations, a fixed value, equal to 0.70, is used for ηex,is, and Eq. 7 is used to calculate h4. On the other hand, in PEORC simulations the semi-empirical thermodynamic model (details about the methodology in Ref. [13]) is run to simulate two-phase expansion as a function of x3, ![]() , pev, and pcon. In this case, h4 is an output of the two-phase expansion model, and Eq. 7 is applied to calculate ηex,is.
, pev, and pcon. In this case, h4 is an output of the two-phase expansion model, and Eq. 7 is applied to calculate ηex,is.
The shaft power ![]() generated by the twin-screw expander,
and the power
generated by the twin-screw expander,
and the power ![]() absorbed by the WF pump are given by
Eqs. 8 and
9,
respectively. The value of
absorbed by the WF pump are given by
Eqs. 8 and
9,
respectively. The value of ![]() in Eq. 9 is
calculated by applying Eq. 10,
where
in Eq. 9 is
calculated by applying Eq. 10,
where ![]() stands for the specific enthalpy of
the WF corresponding to its isentropic pumping from state 1 to
stands for the specific enthalpy of
the WF corresponding to its isentropic pumping from state 1 to ![]() . On the other hand,
. On the other hand, ![]() in Eq. 9 is
calculated as a function of
in Eq. 9 is
calculated as a function of ![]() and
and ![]() . The power
. The power ![]() absorbed by the HTF pump is
calculated by Eq. 11 ,
where
absorbed by the HTF pump is
calculated by Eq. 11 ,
where ![]() is
the gravitational acceleration. Finally, the thermal efficiency
is
the gravitational acceleration. Finally, the thermal efficiency ![]() of the power cycle is given by Eq. 12,
where
of the power cycle is given by Eq. 12,
where ![]() represents the net generated power.
represents the net generated power.


2. 2. Financial analysis
The financial performance of the ORC and the PEORC as industrial waste heat recovery solutions is compared by estimating the values of the Levelized Cost Of Electricity (LCOE), the PayBack Period (PBP), and the Net Present Value (NPV). LCOE, PBP, and NPV are calculated by Eqs. 13, 14, and 15, respectively.
In Eqs. 13, 14, and 15, Iinv represents the initial capital investment cost. In Eqs. 13 and 15, Nlt is the total anticipated operating lifetime of the engine, whereas r is the interest rate. In Eq. 13, M and Etot are the maintenance cost and the electricity produced in year i, respectively. It must be noted that, in this work, M and Etot are considered constant throughout the thermal engine’s operating lifetime. Finally, in Eqs. 14 and 15, RR stands for the annual estimated avoided cost for the industrial unit operation.
Iinv and RR are given by Eqs. 16 and 17, respectively. In Eq. 16, cinv is the power-specific capital investment cost for the thermal engine, whereas Pnom is its nominal electric capacity. In this work, Pnom is taken as the highest of the w'net values of the PEORC and ORC power cycles at their best efficiency points for the selected operating conditions. In Eq. 17, cel represents the electricity price from the power grid. On the other hand, Etot is given by Eq. 18, assuming that the thermal engine operates at a constant best-efficiency point for hr hours in a year.


The target of the analysis is to compare, by estimating the LCOE, PBP, and NPV indices’ values, the financial benefit for the industrial unit by applying the PEORC and the ORC for waste heat recovery. The analysis is parametric, with cinv, cel, and hr, designated as the degrees of freedom. For this work, a representative test case is considered, where the heat transfer rate ![]() at the evaporator, and the temperature Thtf,in of the heat source at the evaporator inlet are equal to 300 kWth, and 100oC, respectively. The utilized parameters, along with their description, applied values, and symbols, for the financial analysis are listed in Table 2.
at the evaporator, and the temperature Thtf,in of the heat source at the evaporator inlet are equal to 300 kWth, and 100oC, respectively. The utilized parameters, along with their description, applied values, and symbols, for the financial analysis are listed in Table 2.
Table 2. Parameters of the financial analysis.
|
Parameter |
Description [Units] |
Value |
| Nlt |
Operating lifetime [Yrs] |
20 |
| r |
Interest rate [%] |
4 |
| M |
Annual maintenance cost [€] |
0.01Iinv |
| cinv |
Nominal power-specific thermal engine capital investment cost [€/kWel] |
2000-4000 |
| cel |
Power grid electricity price [€/ kWh] |
0.15-0.25 |
| hr |
Annual operation hours [h] |
2000-8000 |
4. Results and discussion
4. 1. ORC and PEORC thermodynamic performance
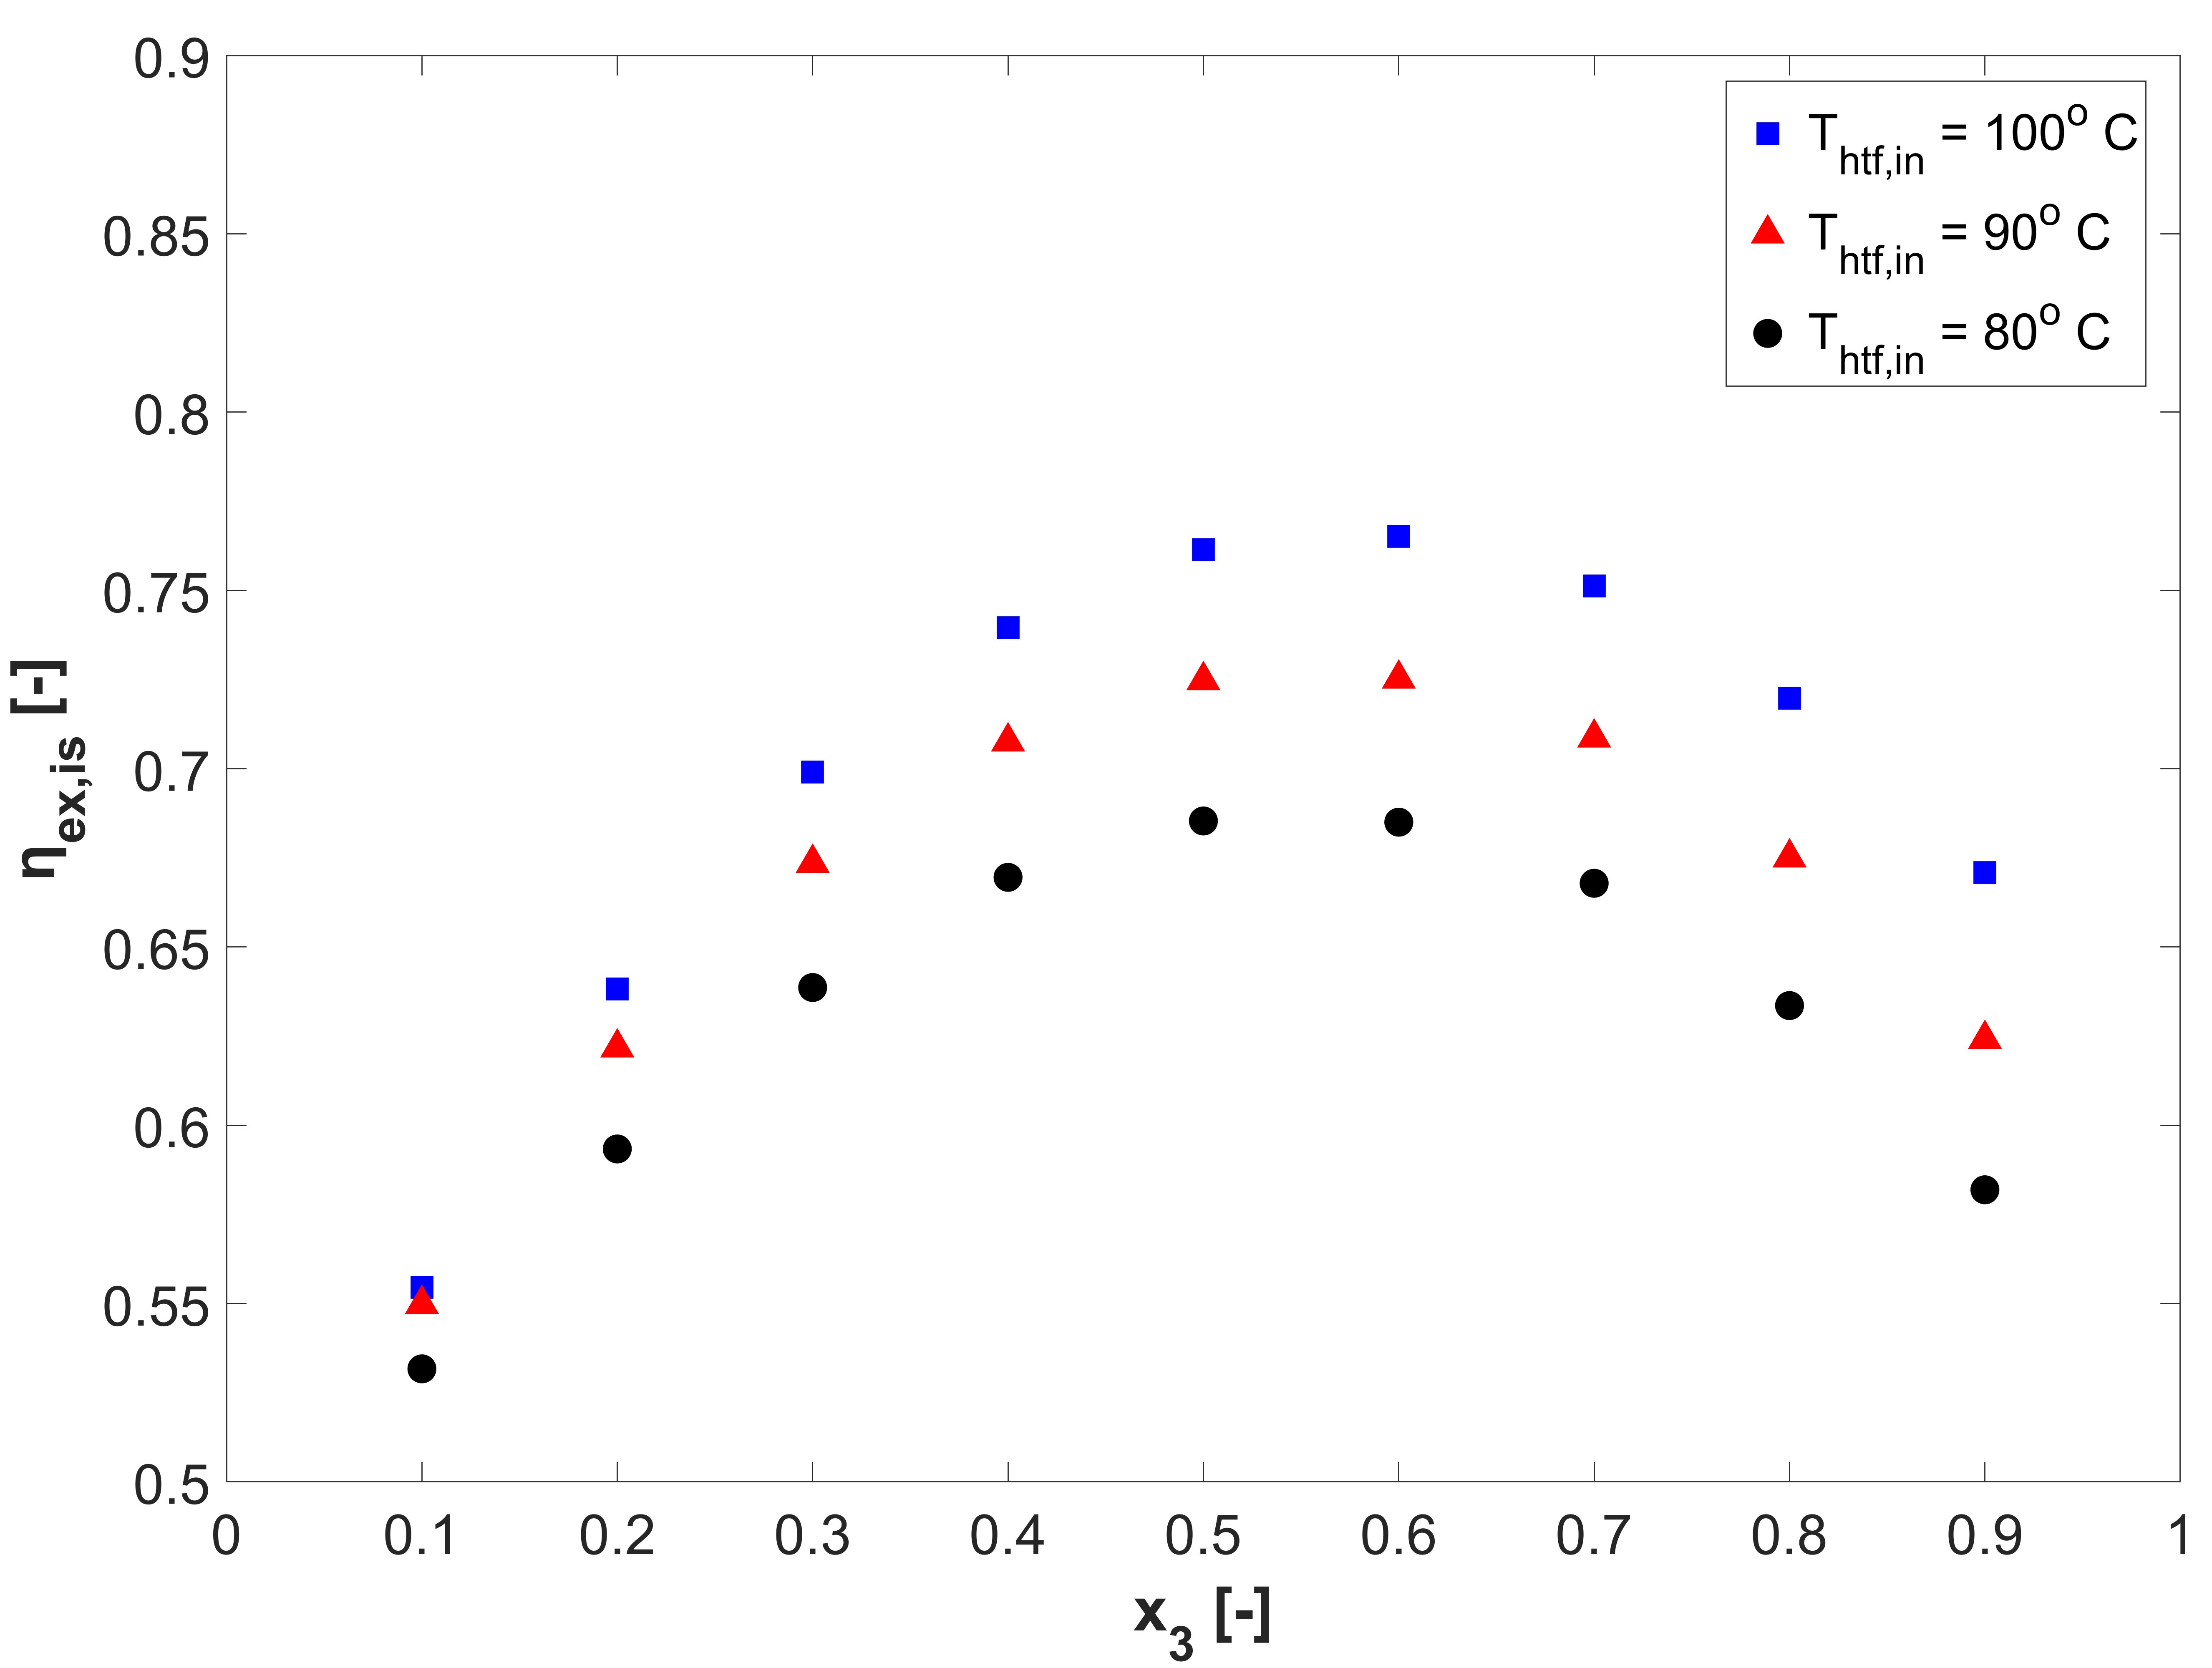
At first, the variation of ηex,is in the PEORC based on the operating conditions is analyzed. This brief analysis is presented, taking into account that the efficiency of two-phase expansion has the most significant impact on the PEORC thermal efficiency, and, as a result, on its competitiveness against the standard ORC. The effect of x3 and Thtf,in on ηex,is in the PEORC is presented in Figure 2. As x3 increases over 0.1 the isentropic efficiency of the expander is improved until the optimal value of ηex,is is achieved for a vapor quality between 0.6 and 0.7. This behavior of ηex,is indicates that at this x3 range the WF volume ratio approaches the built-in volume ratio of the modeled expander (details in Ref. [13]). As Thtf,in increases, higher ηex,is values are calculated by the two-phase expansion model, indicating that higher operating pressure ratios, within the examined range of heat source characteristics, are favorable. This occurs because a better match between the pressure at the end of expansion and the pressure at the discharge line can be achieved as the temperature of the heat source increases (under-expansion losses are minimized). Finally, it must be noted that the effect of the WF on ηex,is is negligible, and, therefore, not presented herein.
In Figures 3 and 4, ηth is plotted versus x3 for different values of Thtf,in when ![]() is equal to 100 and 300 kWth, respectively, in the PEORC. As anticipated, based on analysis of the two-phase expansion efficiency, increasing Thtf,in leads to improved values of ηth. On the other hand, at higher
is equal to 100 and 300 kWth, respectively, in the PEORC. As anticipated, based on analysis of the two-phase expansion efficiency, increasing Thtf,in leads to improved values of ηth. On the other hand, at higher ![]() the thermal efficiency decreases. This is caused by the deterioration of the two-phase expander efficiency as mWF increases because of the negative effect of increased leakage flow rates are higher [13] on ηex,is. For
the thermal efficiency decreases. This is caused by the deterioration of the two-phase expander efficiency as mWF increases because of the negative effect of increased leakage flow rates are higher [13] on ηex,is. For ![]() equal to 100 kWth the optimal value of ηth is obtained at x3 approaching 0.6 regardless of Thtf,in and the type of the WF. On the other hand, for
equal to 100 kWth the optimal value of ηth is obtained at x3 approaching 0.6 regardless of Thtf,in and the type of the WF. On the other hand, for ![]() equal to 300 kWth, there is a variation of the value of x3 for which the higher η_th is calculated. Specifically, as Thtf,in drops, the optimal x3 is reduced to values as low as 0.2. Concerning the WF selection, the simulations indicate that R1234ze(Z) and R245fa perform almost identically, and, in any case, more efficiently or equivalently to R1234ze(E).
equal to 300 kWth, there is a variation of the value of x3 for which the higher η_th is calculated. Specifically, as Thtf,in drops, the optimal x3 is reduced to values as low as 0.2. Concerning the WF selection, the simulations indicate that R1234ze(Z) and R245fa perform almost identically, and, in any case, more efficiently or equivalently to R1234ze(E).
 =100 kWth.
Overall, it is estimated that the PEORC can achieve a maximum ηth equal to 7.75%, 6.34%, and 4.80% for Thtf,in equal to 100oC, 90oC, and 80oC, respectively, when ![]() equals 100 kWth. The respective values of ηth when
equals 100 kWth. The respective values of ηth when ![]() is equal to 300 kWth are 5.96%, 3.96%, and 2.28%.
is equal to 300 kWth are 5.96%, 3.96%, and 2.28%.
The effect of ΔΤsp and Thtf,in on ηth for the ORC operation is presented in Figures 5 and 6, for ![]() equal to 100 kWth and 300 kWth, respectively. The variation of ηth as a function of ΔΤsp is negligible because the respective difference in the value of pev is slight. As Thtf,in is reduced, ηth diminishes because the operating pressure ratio of the power cycle is reduced, with a negative effect on the enthalpy drop of the WF. As
equal to 100 kWth and 300 kWth, respectively. The variation of ηth as a function of ΔΤsp is negligible because the respective difference in the value of pev is slight. As Thtf,in is reduced, ηth diminishes because the operating pressure ratio of the power cycle is reduced, with a negative effect on the enthalpy drop of the WF. As ![]() increases, ηth drops because the value of pev is reduced for the same value of ΔΤsp at the suction port of the expander. As observed in the case of the PEORC, R1234ze(Z) outperforms or, in the worst case, is as efficient as the other examined WFs for all the examined operating conditions.
increases, ηth drops because the value of pev is reduced for the same value of ΔΤsp at the suction port of the expander. As observed in the case of the PEORC, R1234ze(Z) outperforms or, in the worst case, is as efficient as the other examined WFs for all the examined operating conditions.
 =300 kWth.
 =100 kWth.
Quantitatively, the standard ORC can accomplish a ηth equal to 7.13%, 6.00%, and 4.66% when Thtf,in equals 100oC, 90oC, and 80oC, respectively, and the heat duty at the evaporator reaches 100 kWth. When ![]() is equal to 300 kWth, the respective values for the thermal efficiency are 5.06%, 3.34%, and 1.25%.
is equal to 300 kWth, the respective values for the thermal efficiency are 5.06%, 3.34%, and 1.25%.
4. 2. ORC and PEORC financial performance comparison
As mentioned in Section 2.2, the target of the financial analysis is to compare the potential benefit for an industrial unit resulting from the application of the PEORC and the ORC to exploit the available waste heat from processes. An indicative case study was considered for the results presented in this Section, where the available waste heat for the thermal engine is equal to 300 kWth, and the temperature of the heat source reaches 100oC. By examining the results presented in Section 4.1 (see Figure 4 and Figure 6) for the abovementioned thermodynamic characteristics of the heat source, the maximum achievable thermal efficiency ηth for the ORC and PEORC, with R1234ze(Z) as the WF, is equal to 5.06% and 5.96%, respectively. Hence, w'net is equal to 15.18 and 17.88 kWel, for the ORC and PEORC, respectively, and the value of 18 kWel is used for Pnom in the performed financial analysis calculations.
 =300 kWth.
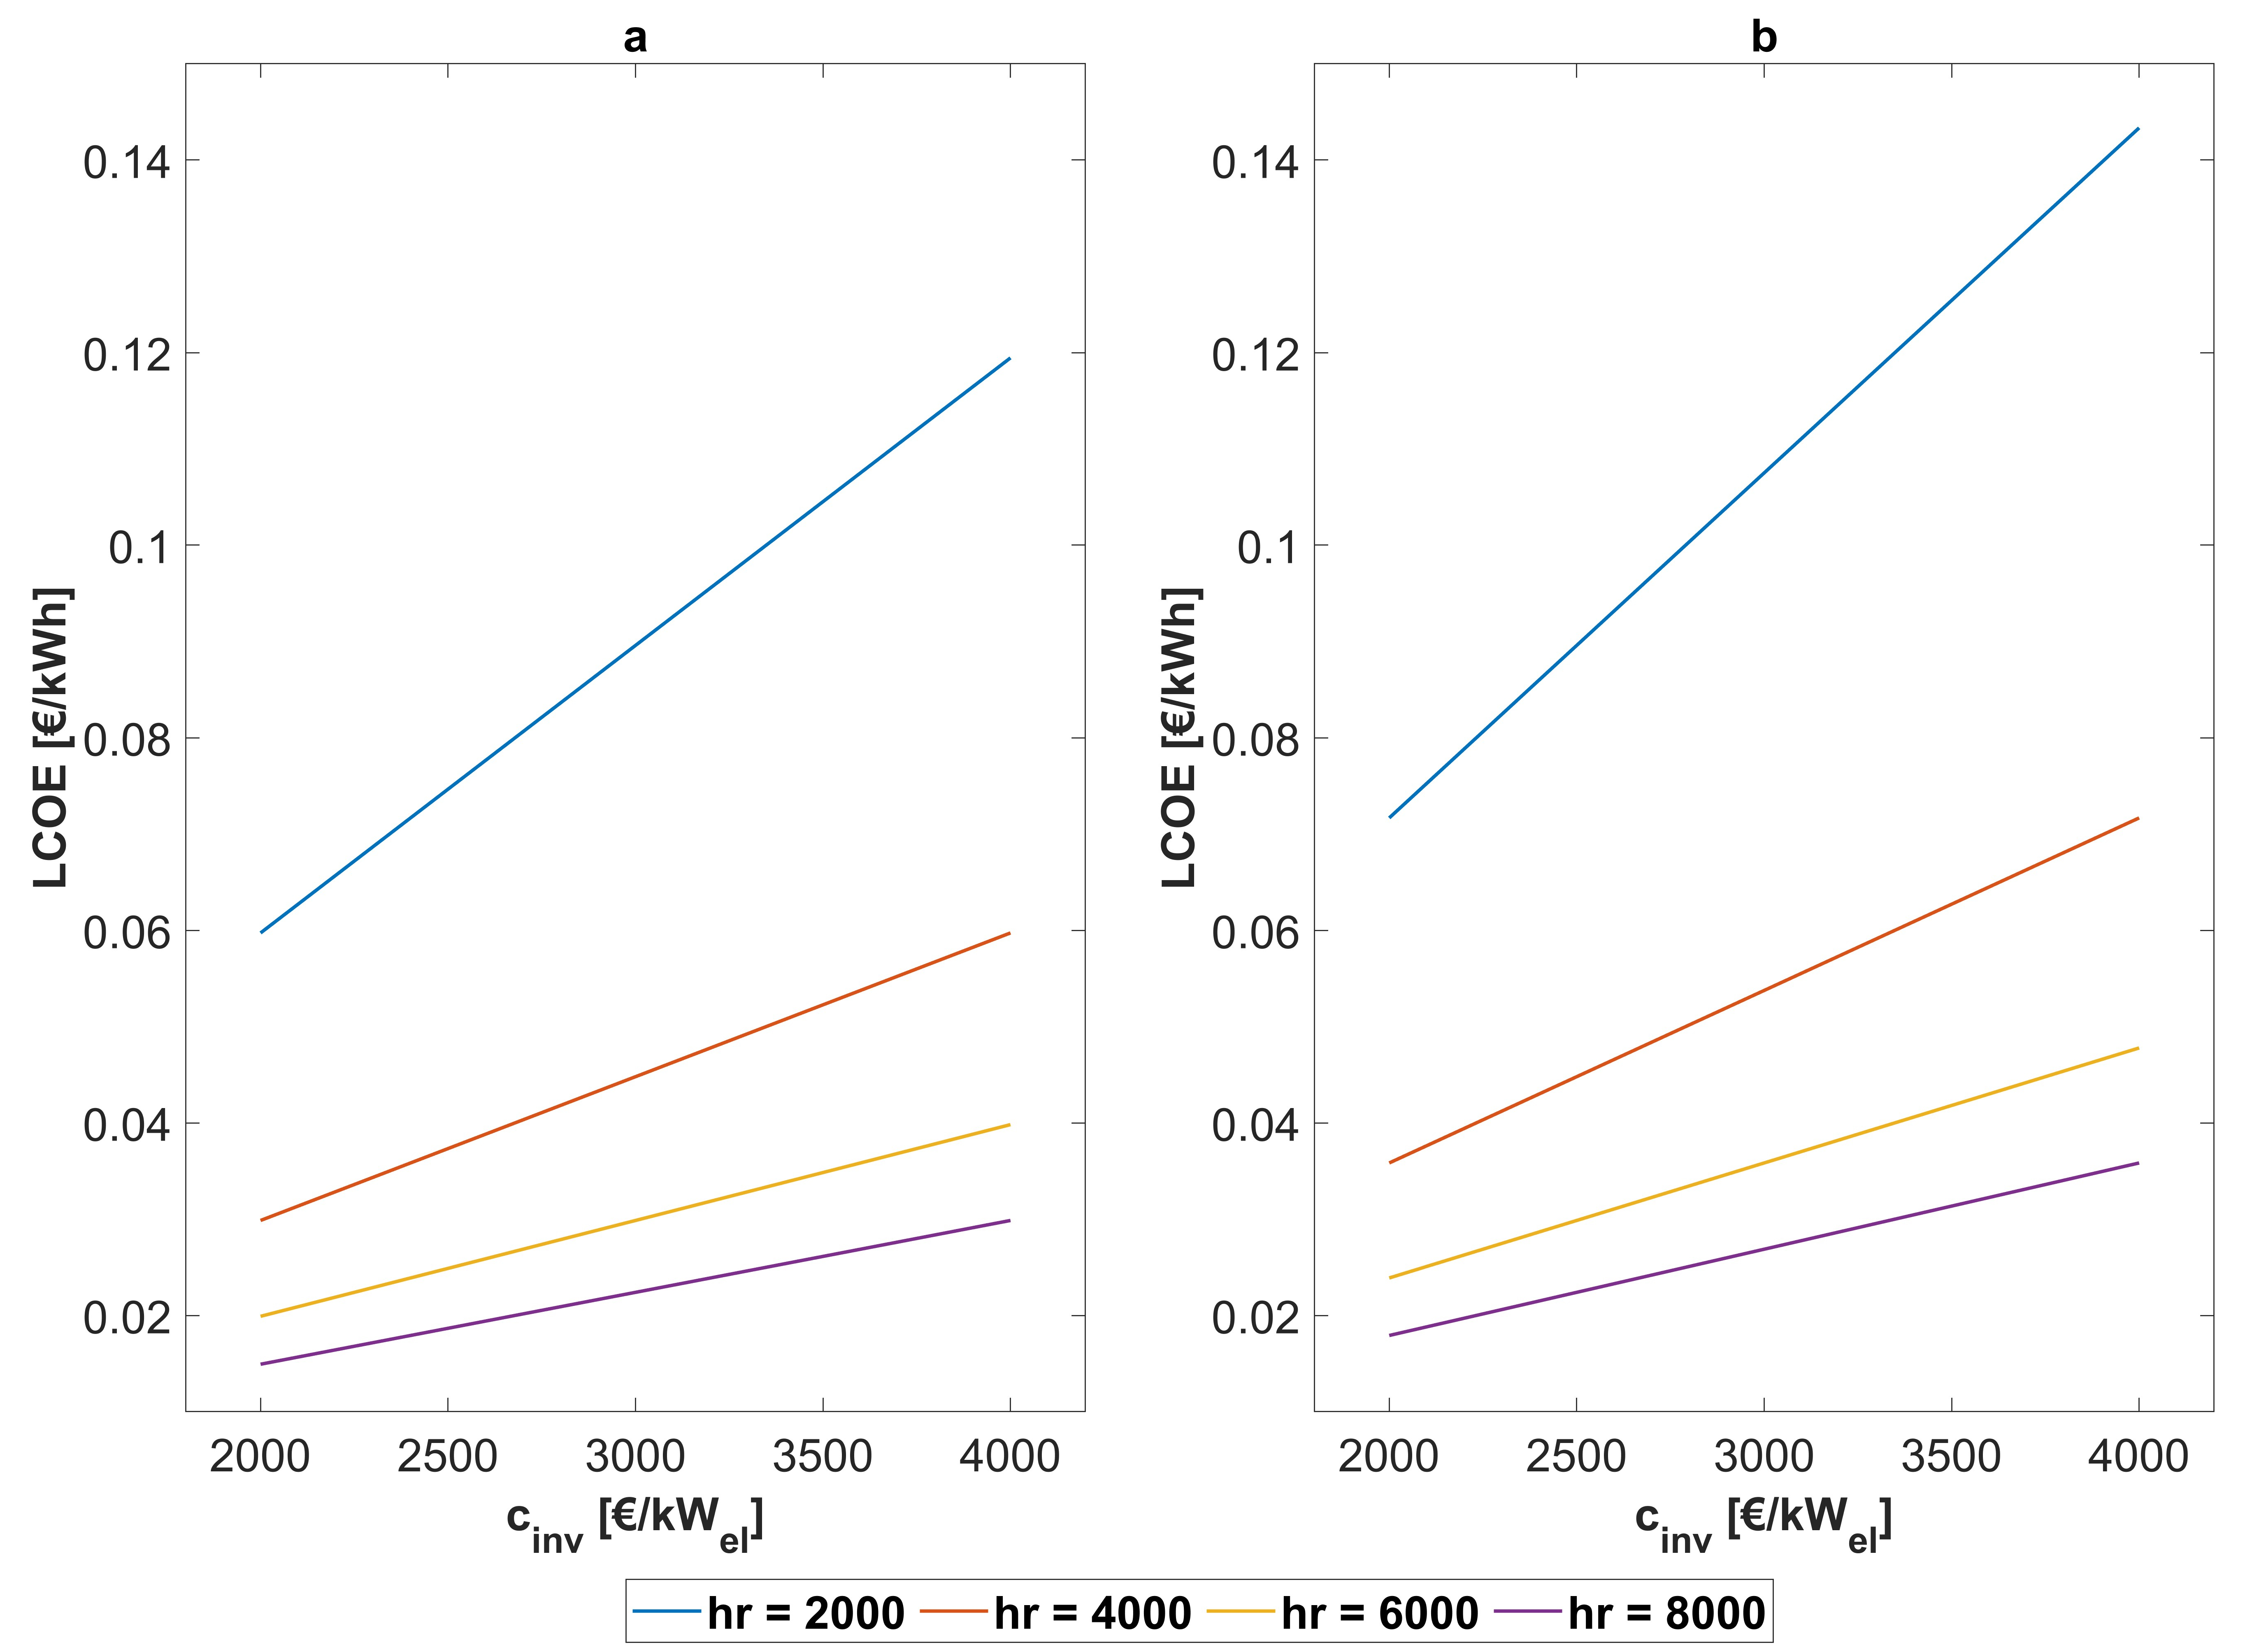
 In Figure 7a and Figure 7b, LCOE is presented versus cinv for different values of the total annual operating hours hr for the ORC and PEORC, respectively. At this point, it must be noted that similar LCOE values were estimated for different thermodynamic characteristics of the heat source. Hence, the presented results may be considered representative across the spectrum of the examined operating scenarios in Section 4.1. The positive impact of cinv reduction and hr increase on the LCOE is obvious for both configurations. Regarding the comparison between the two power cycles, the application of the PEORC leads to LCOE values that are lower by 16 to 17%. Both power cycles can accomplish competitive LCOE values for industrial waste heat recovery, between 0.018 and 0.143 €/kWh in the case of the ORC, and 0.015 and 0.119 €/kWh when the PEORC is applied.
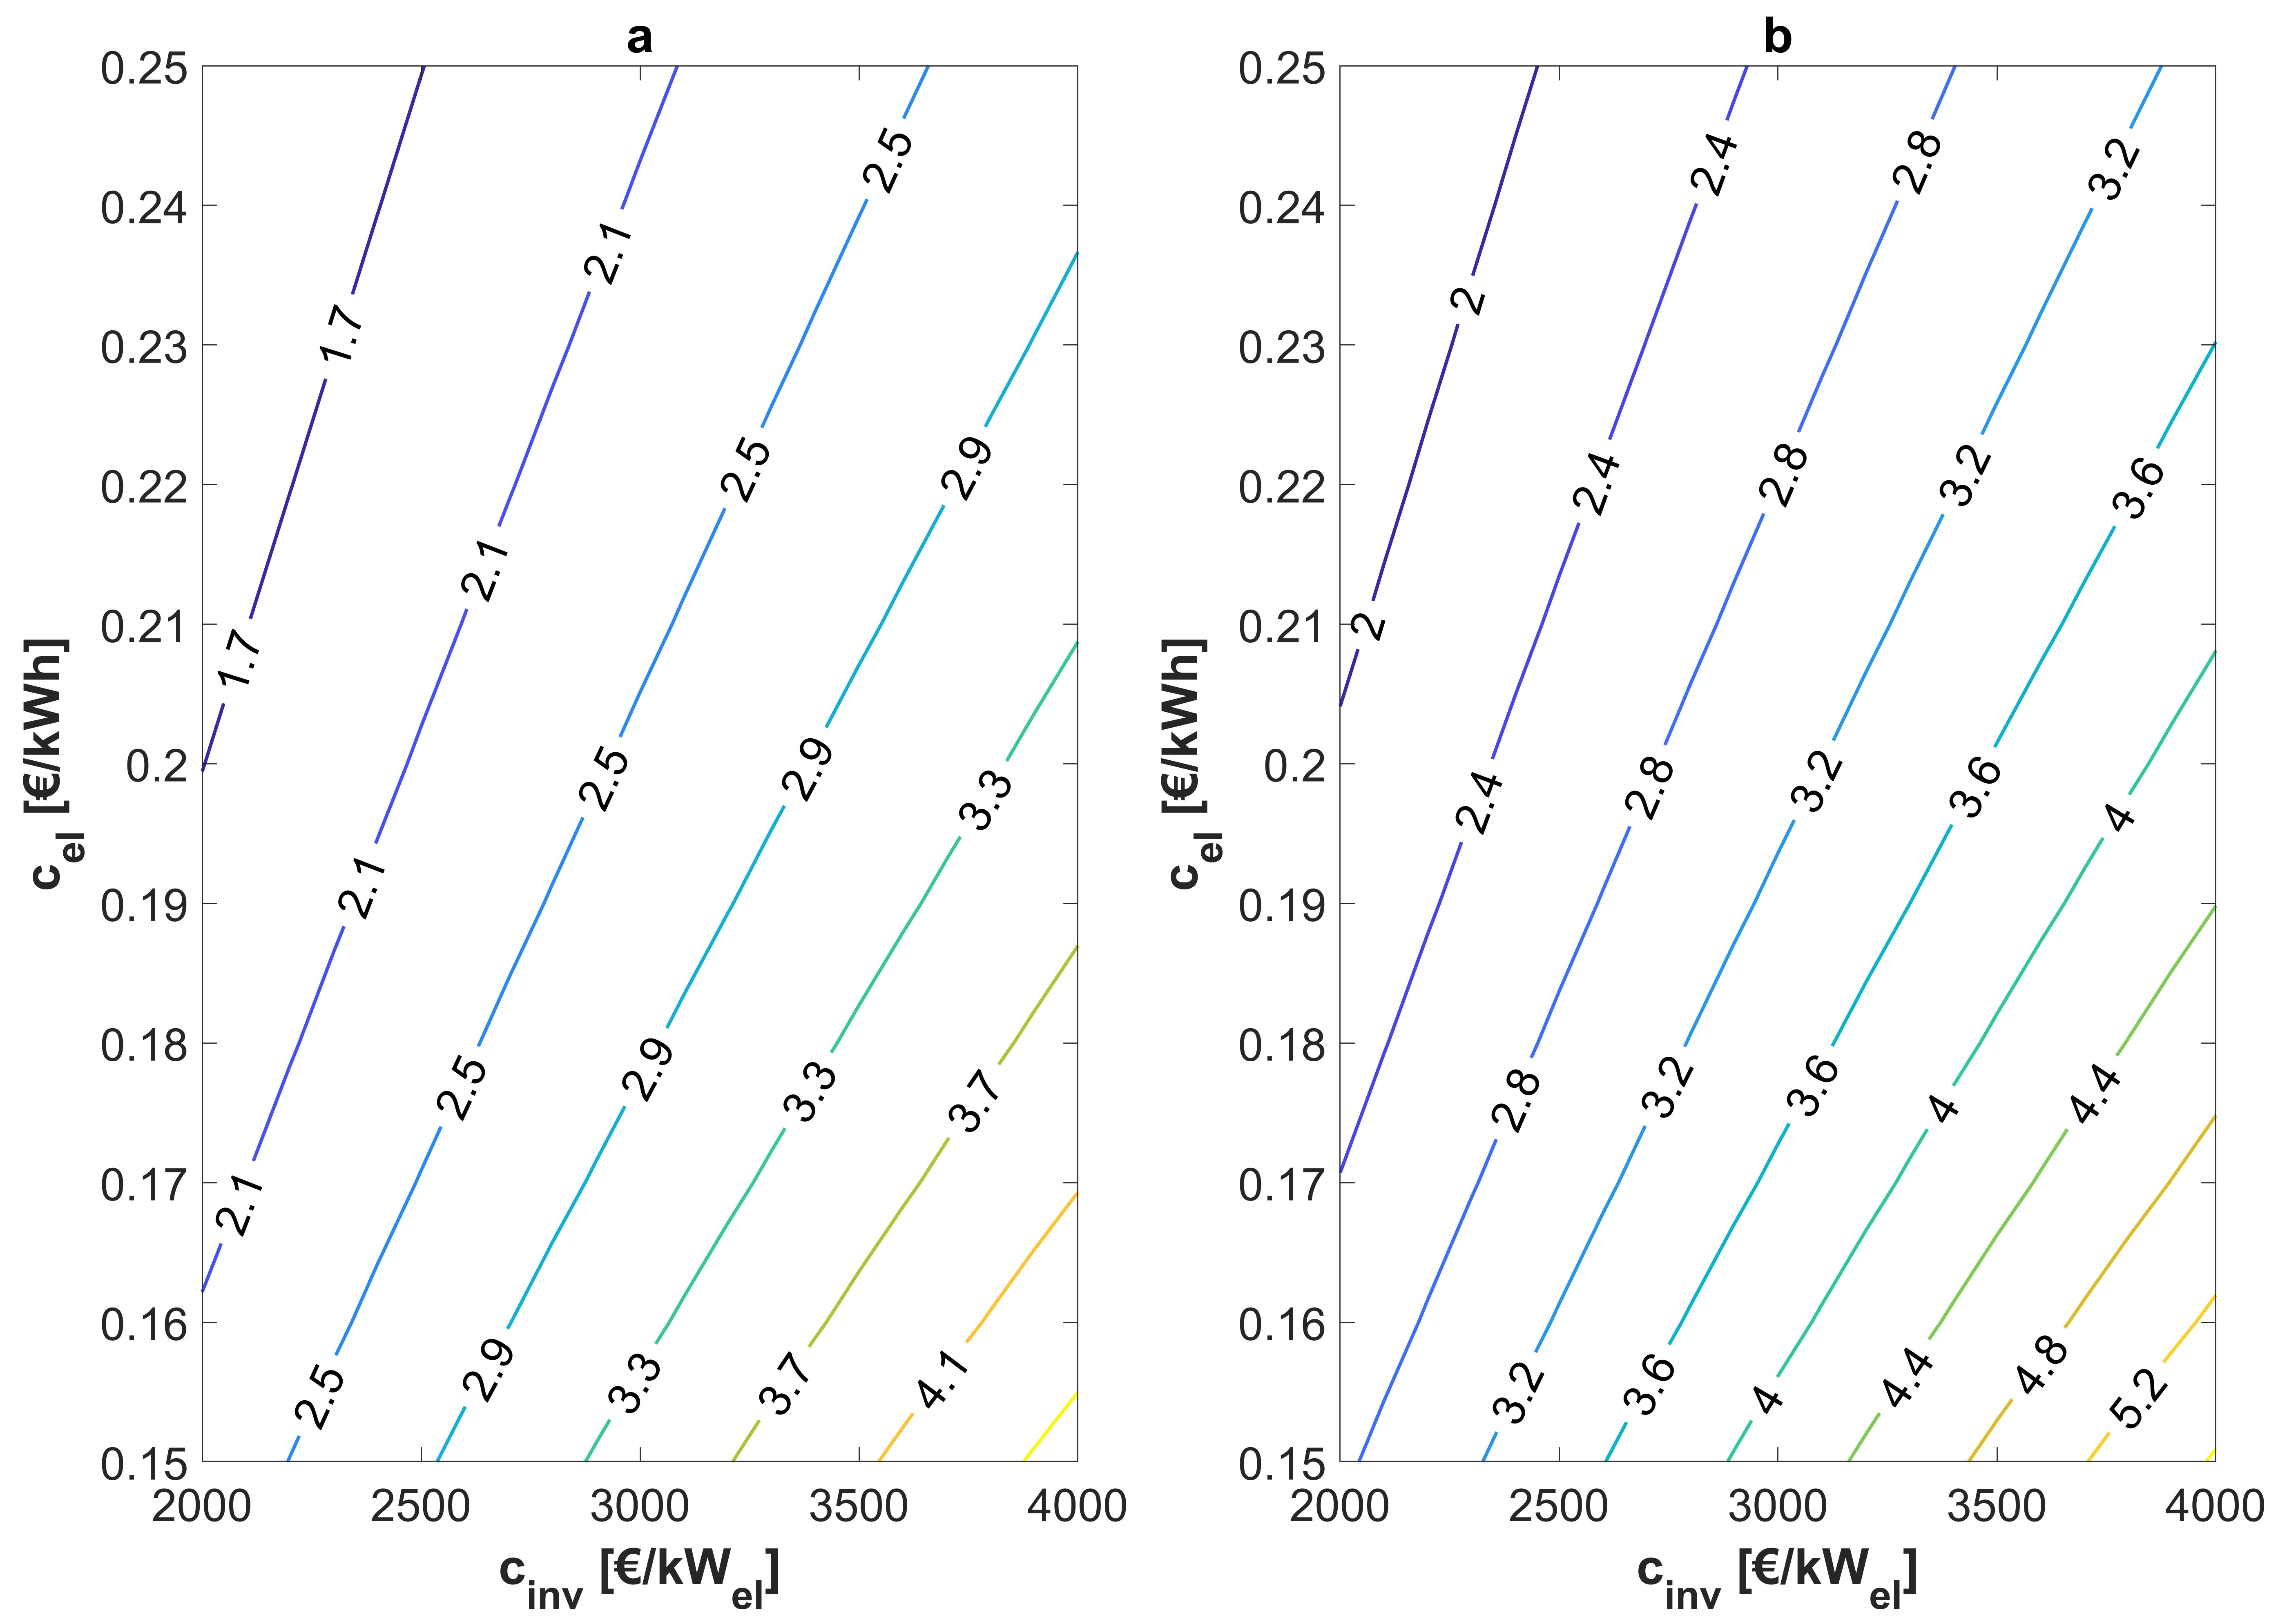
PBP contours in the cinv - cel plane are plotted in Figure 8a and Figure 8b for the PEORC and the ORC, respectively, considering that, indicatively, the total annual operating hours hr are 6000. Favorable PBP are expected for both power cycle architectures, even for increased values of cinv and cel prices rather high, compared to electricity prices in the energy market of most countries in the European Union. Its increased thermal efficiency leads to lower PBP for the PEORC, indicating it can become a competitive alternative to the ORC for low-temperature waste heat recovery. Overall, in the most adverse scenario, the anticipated PBP for the ORC and PEORC is expected to reach approximately 5.2 and 4.1 years, respectively.
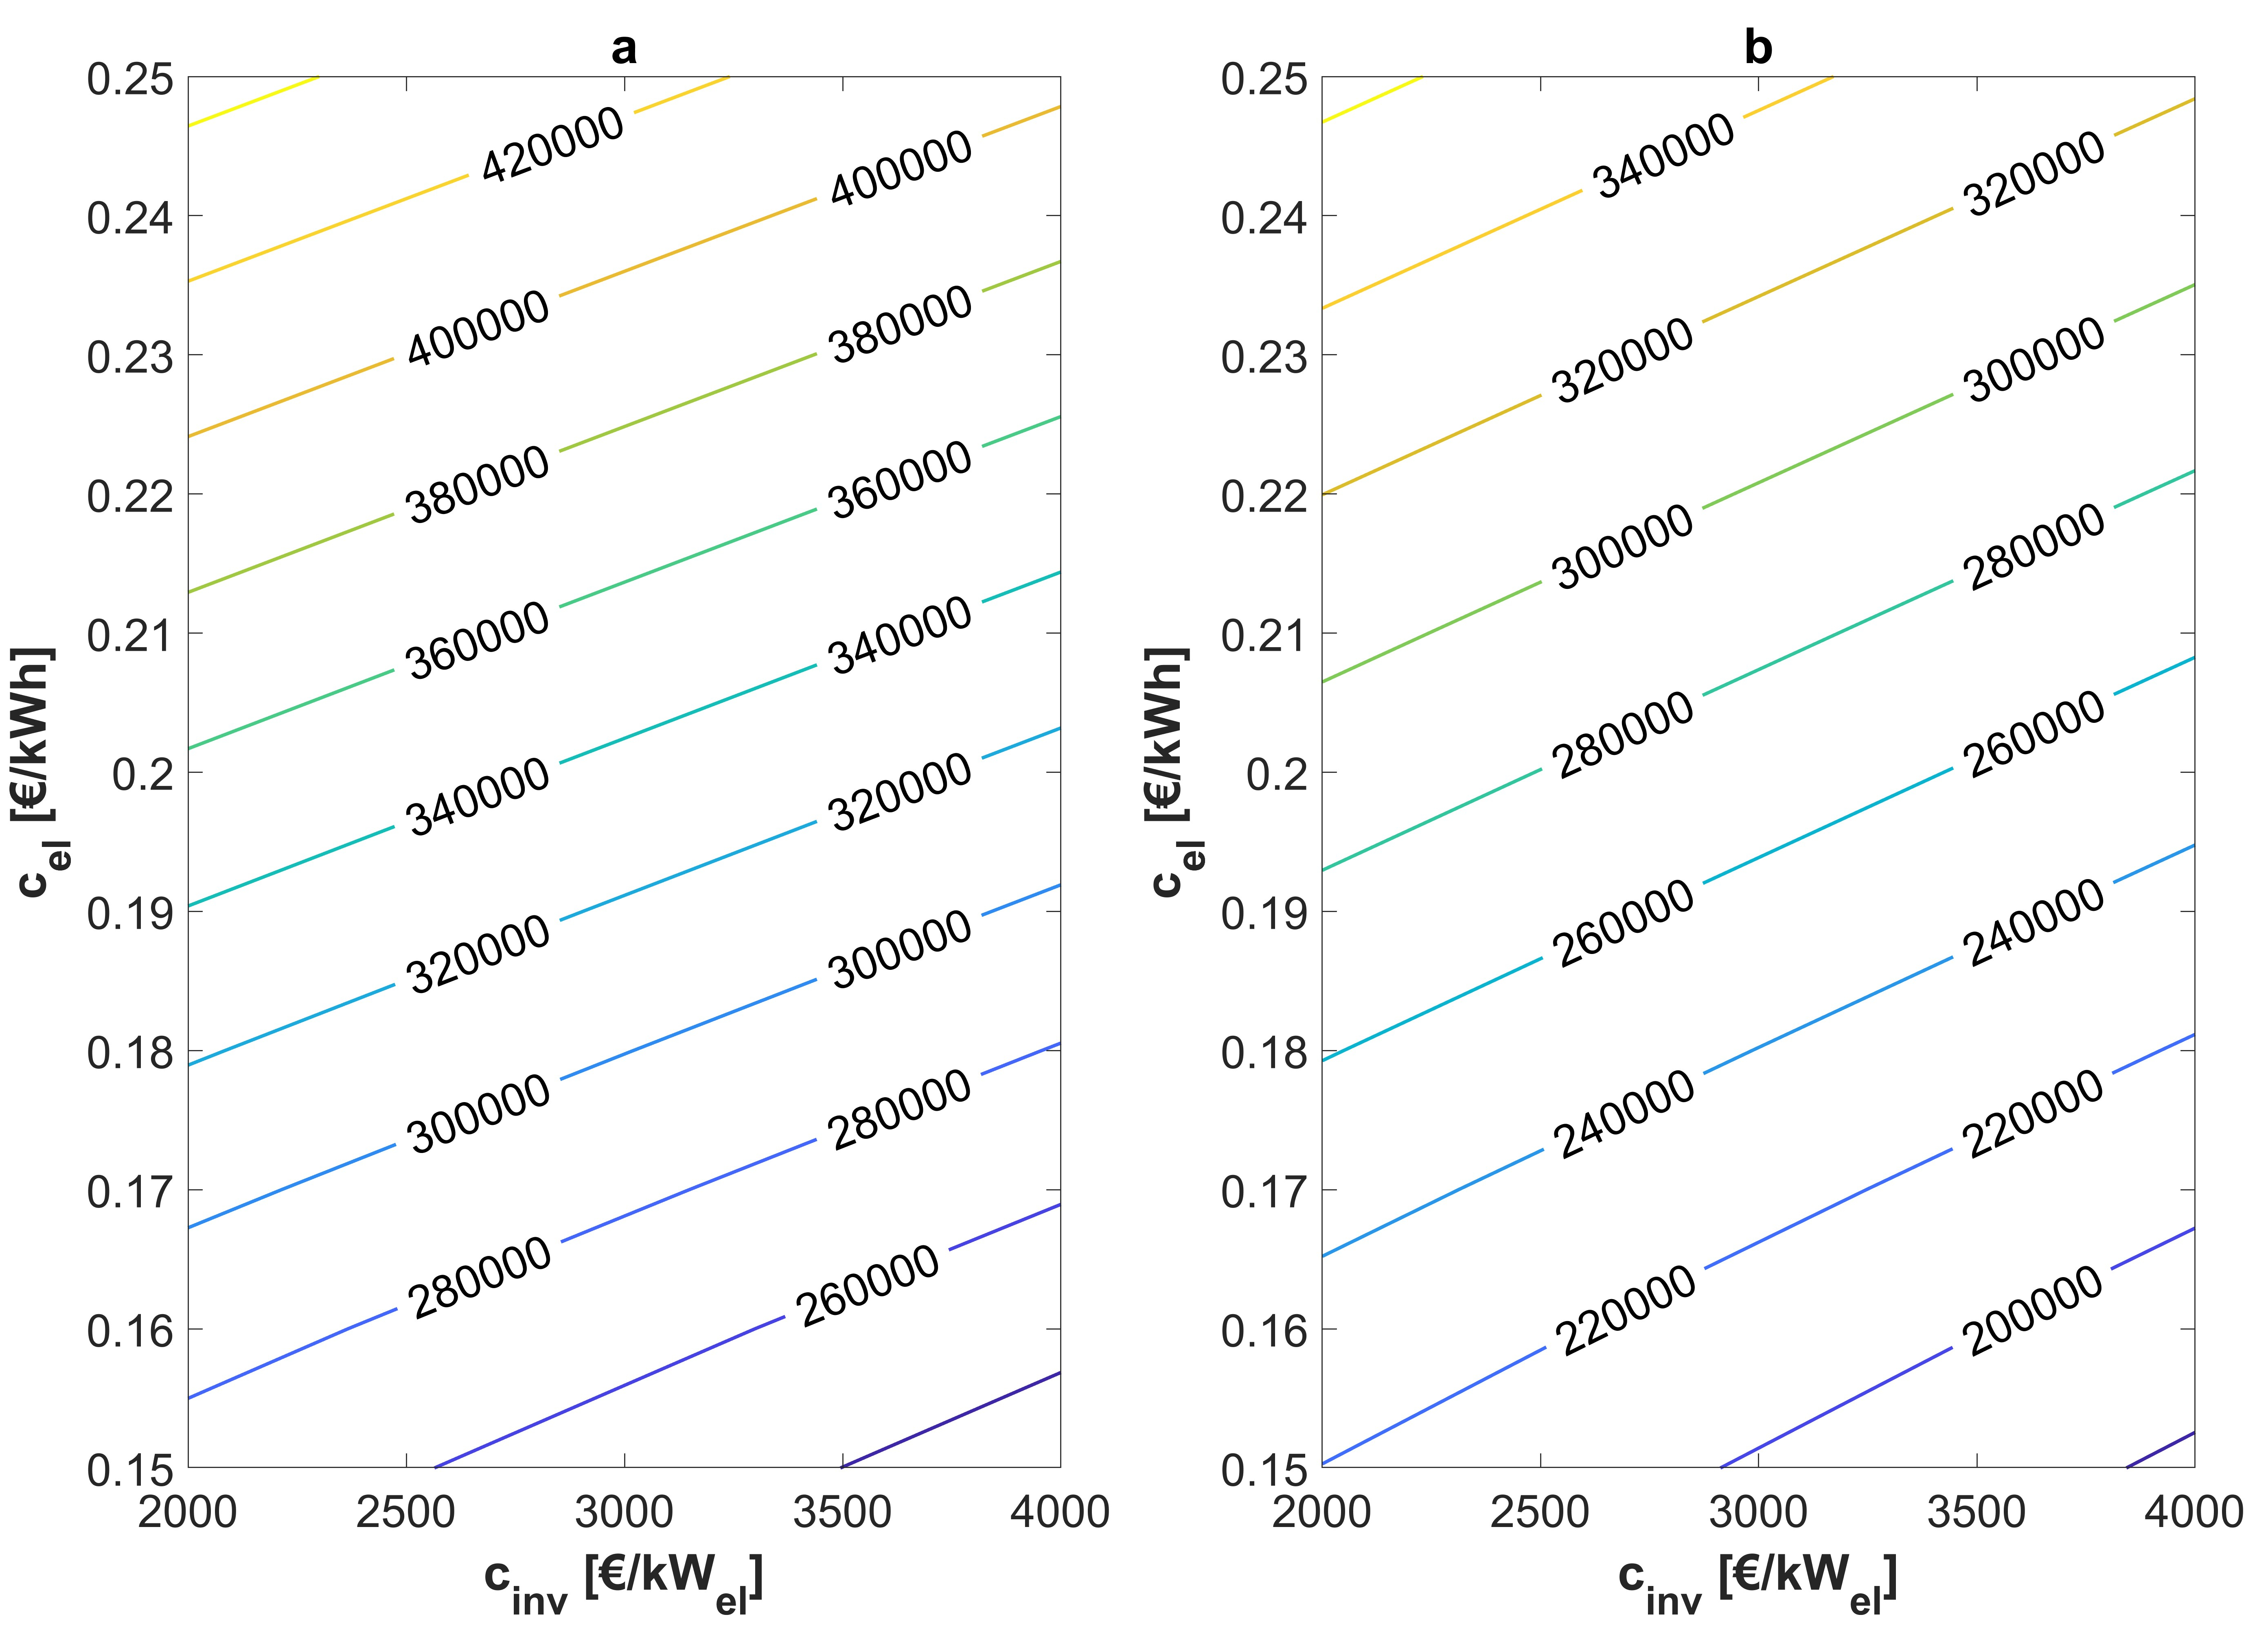
A clearer view of the financial benefit as a result of applying the PEORC instead of the ORC for waste heat recovery can be provided by estimating the NPV, because this index takes into account the time value of money as well. NPV as a function of cinv and cel is presented in Figure 9a and Figure 9b for the PEORC and the ORC, respectively. Again, 6000 annual operating hours hr were considered for the presented results. Positive NPV values are calculated for both the examined power cycles, regardless of the cinv and cel values, highlighting that they can be an attractive investment for energy efficiency improvement in the industrial sector. The PEORC appears as a more promising technological solution than the ORC in terms of the NPV, as previously shown for the LCOE and PBP indexes. The estimated NPV values are higher in the case of the PEORC by 18 to 23% because of the increased heat-to-power ratio its implementation induces. The superiority of the PEORC becomes more pronounced as cel becomes higher because the avoided annual cost RR for the industry is substantially increased.
5. Conclusions
AIn the present work, a techno-economic comparison between the PEORC and ORC power cycles for low-temperature waste heat recovery was performed, with operating scenarios relevant to the industrial sector. Numerical models of the two power cycle architectures were developed to simulate their operation for different WFs, temperatures of the heat source, and heat duties at the evaporator. The numerical expimeriments indicate that the PEORC performs better than the standard ORC under all the examined operating scenarios. The PEORC and ORC can achieve thermal efficiency values in the range of 2.28% to 7.75%, and 1.25% to 7.13%, respectively. Regarding the financial performance of the ORC and PEORC, the results indicate that both power cycles can be competitive technologies for industrial waste heat recovery. However, the PEORC outperforms the ORC because of the higher achievable heat-to-power values. In terms of LCOE, the PEORC can achieve values as low as 0.015 to 0.119 €/kWh, which are consistently higher, by 16-17%, than the values estimated for the ORC. Maximum PBP for the ORC and PEORC is expected to reach 5.2 and 4.1 years, respectively, whereas positive NPV values were calculated for all the examined scenarios. The financial performance of the power cycles improves as their annual operating hours and the cost of electricity from the power grid increase. Finally, it must be noted that additional PEORC experimental data are necessary to consolidate its superiority against the ORC, the performance of which is documented in the literature and real-world applications.
Acknowledgment
This research work was supported by the Hellenic Foundation for Research and Innovation (H.F.R.I.) under the “First Call for H.F.R.I. Research Projects to support Faculty members and Researchers and the procurement of high-cost research equipment grant” (Project Number: 1087, Acronym: SOL-art).
References
[1] C. Forman, I. K. Muritala, R. Pardemann, and B. Meyer, "Estimating the global waste heat potential," Renewable and Sustainable Energy Reviews, vol. 57, pp. 1568-1579, 2016, doi: 10.1016/j.rser.2015.12.192. View Article
[2] M. Papapetrou, G. Kosmadakis, A. Cipollina, U. La Commare, and G. Micale, "Industrial waste heat: Estimation of the technically available resource in the EU per industrial sector, temperature level and country," Applied Thermal Engineering, vol. 138, pp. 207-216, Jun. 2018, doi: 10.1016/J.APPLTHERMALENG.2018.04.043. View Article
[3] V. Lemort and A. Legros, "12 - Positive displacement expanders for Organic Rankine Cycle systems," E. Macchi and M. B. T.-O. R. C. (ORC) P. S. Astolfi, Eds., Woodhead Publishing, 2017, pp. 361-396. doi: https://doi.org/10.1016/B978-0-08-100510-1.00012-0. View Article
[4] B. F. Tchanche, G. Lambrinos, A. Frangoudakis, and G. Papadakis, "Low-grade heat conversion into power using organic Rankine cycles - A review of various applications," Renewable and Sustainable Energy Reviews, vol. 15, no. 8, pp. 3963-3979, Oct. 2011, doi: 10.1016/J.RSER.2011.07.024. View Article
[5] A. Schuster, S. Karellas, and R. Aumann, "Efficiency optimization potential in supercritical Organic Rankine Cycles," Energy, vol. 35, no. 2, pp. 1033-1039, Feb. 2010, doi: 10.1016/J.ENERGY.2009.06.019. View Article
[6] R. DiPippo, "Ideal thermal efficiency for geothermal binary plants," Geothermics, vol. 36, no. 3, pp. 276-285, Jun. 2007, doi: 10.1016/J.GEOTHERMICS.2007.03.002. View Article
[7] I. K. Smith, "Development of the trilateral flash cycle system: Part 1: Fundamental considerations," Proceedings of the Institution of Mechanical Engineers, Part A: Journal of Power and Energy, vol. 207, no. 3, pp. 179-194, 1993, doi: 10.1243/PIME_PROC_1993_207_032_02. View Article
[8] M. T. White, "Cycle and turbine optimisation for an ORC operating with two-phase expansion," Applied Thermal Engineering, vol. 192, p. 116852, 2021, doi: https://doi.org/10.1016/j.applthermaleng.2021.116852. View Article
[9] G. Bianchi, S. Kennedy, O. Zaher, S. A. Tassou, J. Miller, and H. Jouhara, "Numerical modeling of a two-phase twin-screw expander for Trilateral Flash Cycle applications," International Journal of Refrigeration, vol. 88, pp. 248-259, Apr. 2018, doi: 10.1016/J.IJREFRIG.2018.02.001. View Article
[10] H. Öhman and P. Lundqvist, "Experimental investigation of a Lysholm Turbine operating with superheated, saturated and 2-phase inlet conditions," in Applied Thermal Engineering, Pergamon, Jan. 2013, pp. 1211-1218. doi: 10.1016/j.applthermaleng.2012.08.035. View Article
[11] I. K. Smith, N. Stošić, and C. A. Aldis, "Development of the trilateral flash cycle system. Part 3: The design of high-efficiency two-phase screw expanders," Proceedings of the Institution of Mechanical Engineers, Part A: Journal of Power and Energy, vol. 210, no. 1, pp. 75-92, Aug. 1996, doi: 10.1243/pime_proc_1996_210_010_02. View Article
[12] S. Lecompte, M. van den Broek, and M. De Paepe, "Thermodynamic analysis of the partially evaporating trilateral cycle," 2nd International Seminar on ORC Power Systems, Proceedings, 2013, Accessed: Feb. 09, 2023. [Online]. Available: http://hdl.handle.net/1854/LU-4166776 View Article
[13] A. Skiadopoulos, G. Kosmadakis, S. Lecompte, M. De Paepe, and D. Manolakos, "Numerical modeling of flashing in TFC expanders for the efficient exploitation of low-grade heat," Thermal Science and Engineering Progress, p. 102171, 2023, doi: https://doi.org/10.1016/j.tsep.2023.102171. View Article