Journal of Fluid Flow, Heat and Mass Transfer (JFFHMT)
ISSN: 2368-6111

Volume 10 - Year 2023 - Pages 51-61
DOI: 10.11159/jffhmt.2023.008
Influence Of Catalyst On Producer Gas Quality In Fixed Bed Gasifier Using Lignite And Wood Feedstock
Darshit S Upadhyay1*, Amita Chaudhary2, Akshit Trada1, Dhruvil Patel1, Rajesh N Patel1
1Mechanical Engineering Department, Institute of Technology,
Nirma University, Ahmedabad
2Chemical Engineering Department, Institute of Technology, Nirma University, Ahmedabad
*Corresponding Author, darshitupadhyay@yahoo.com, +91 9428966766
Abstract - This paper deals with the experimental investigation of lignite (L) and wood (W) feedstock in a pilot-scale downdraft gasifier. The study aims to check the compatibility of CaMg(CO3)2 [dolomite (D)] catalyst, 5% (W/W), with lignite and wood (L+D, W+D) feedstock as an additive to enhance the performance of a 10 kWe atmospheric pressure downdraft gasifier system. Fuel consumption and gas flow rate were found to be 10.01-11.6 kg h-1 and 26.76-29.57 kg h-1, respectively, for lignite and wood feedstock (with and without catalyst). In lignite, CO and H2 concentrations were increased by 6.81 % and 4.9 %, respectively, whereas in wood, their concentrations were increased by 8.88 % and 5.1 % when the catalyst was employed with feedstock. The producer gas LHV and cold gas efficiency were increased by 6.02% and 5.75% in lignite and 6.97% and 6.61 in wood, whereas specific fuel consumption decreased by 5.92% (in L), 5.17 (in W) with dolomite feedstock. Tar and Total Particulate Matter (PM) concentrations in the producer gas were measured and found to have a noticeable decline with catalytic gasification for both feedstocks. The study concludes that adding dolomite offered better results in terms of higher efficiency and lower tar–PM concentrations.
Graphical Abstract:
Keywords: Dolomite, Gasifier, Lignite, Cold Gas Efficiency, Thermodynamic analysis
© Copyright 2023 Authors - This is an Open Access article published under the Creative Commons Attribution License terms Creative Commons Attribution License terms. Unrestricted use, distribution, and reproduction in any medium are permitted, provided the original work is properly cited.
Date Received: 2023-06-08
Date Revised: 2023-07-12
Date Accepted: 2023-07-20
Date Published: 2023-08-24
Abbreviation:
|
h |
Energy efficiency |
FC |
Fixed Carbon |
|
b |
correlation factor |
GC/MS |
Gas chromatography–Mass spectrometry |
|
y |
Exergy efficiency |
GHE |
Greenhouse emissions |
|
A,B,C,D,E |
specific heat constants |
H |
Hydrogen |
|
C |
Carbon |
H2 |
Hydrogen gas |
|
CH4 |
Methane |
H2% |
Mass fraction of hydrogen |
|
CH4% |
Mass fraction of methane |
HHV |
High Heating Value |
|
CO |
Carbon monoxide |
LHV |
Lower Heating Value (MJ kg-1) |
|
CO% |
Mass fraction of carbon monoxide |
MBC |
Mass balance closure |
|
CO2 |
Carbon dioxide |
MC |
Moisture content |
|
CO2% |
Mass fraction of carbon dioxide |
MJ |
Mega Joule |
|
Cp, feed |
Average specific heat of feed |
N |
Nitrogen |
|
DSC |
Differential Scanning Calorimetry |
N2% |
Mass fraction of nitrogen |
|
EBC |
Energy balance closure |
O |
Oxygen |
|
Ech |
chemical energy |
PM |
Total Particulate Matter |
|
Eph |
Physical energy |
R |
Gas constant |
|
Ex |
Exergy |
T0 |
Ambient Temperature |
|
Ex BC |
Exergy balance closure |
TGA |
Thermal gravimetric analysis |
|
ExCh |
Chemical exergy |
VM |
Volatile Matter |
|
ExPh |
Physical exergy |
|
|
1. Introduction
Cleaner power and electricity generation can be achieved by utilizing renewable and long-lasting energy sources such as wind, solar and biomass. In the technology and construction sector, biomass in the form of forestry wastes and agricultural residues offers a lot of potential for substantial energy production. Electrical energy, for example, is widely used in rural and urban regions for home, agricultural, and industrial purposes [1]. The current study focuses on energy generation from these resources to meet energy demands, particularly in rural regions, due to the wide and diversified regional biomass availability [2]. Biomass gasification is a thermochemical conversion process that converts biomass into producer gas. It is rich in CO and H2 and has a lower/medium heating value. This gas can be used for thermal power and electricity generation. Gasification generates producer gas by partially burning biomass under low oxygen (sub-stoichiometric) conditions. The major constituents of producer gas are H2, CO, and CH4, with traces of CO2 and N2. The leftover products of this gasification procedure include tar and ash. Gasification is one of the most effective ways to remediate low-quality feedstock. Generally, high-temperature slagging gasifiers perform best with high-rank, less reactive coals, whereas dry-feed gasifiers function well with low variety, high moisture coals. [1]. Higher ash and silicates in a feedstock (such as lignite) create clinkers which are responsible for interruption in continuous gasification operation [2], [3]. To overcome such a problem, researchers suggested different options such as co-gasification of feedstock [4], manipulating grate movement and changing air feed position [5], additional suitable catalyst [6], etc.
Tar and Total Particulate Matter (PM) are the major producer gas contaminants [7]. If the concentrations of such contaminants are higher, they create unacceptable maintenance downstream of the system [8]. Different methods to diminish Tar and PM include physical, non-catalytic, and catalytic processes. The catalytic approach is preferred over other methods due to its potential to boost conversion efficiency along with reducing pollutants. This procedure primarily entails tar removal, which involves a high-temperature reaction between hot gas and the catalyst. This approach chemically converts tar into light fraction gases [9]. Researchers used different catalysts such as clay minerals, calcined rocks, char, olivine, FCC (Fluid Catalytic Cracking), activated alumina, alkali metal-based, iron ores, transition metal-based catalysts, and other transition metal oxides.
Calcium oxide (CaO) is a relatively inexpensive ingredient (found in limestone or dolomite) that aids in the breakdown of tar compositions. Upadhyay et al. [6] experimented on a 10 kWe downdraft gasifier by varying the catalyst to lignite (C/L) ratio to investigate the clinker formation and gasifier performance. They observed that clinker formation was almost negligent, and tar – PM concentrations were within permissible limits at a 7% MgCO3 C/L ratio. In further studies, it was also investigated that the H2/CO ratio, gas yield, CGE, LHV, and exergy efficiency also improved by 9.94%, 2.52%, 20.24%, 22.22%, and 29.04%, respectively, with the same ratio when the catalyst was employed to the reactor. Chen et al. [9] employed Ni-loaded steel slag as a catalyst, which is high in metal oxides, to optimize syngas quality for sludge steam gasification. A catalyst loading of 20%, a steam flow rate of 1.0 g min-1, and a temperature of 900°C was the most effective condition for producing high-quality hydrogen-rich syngas. Zeng et al. [10] performed experiments on two-stage alkaline thermal gasification of cellulose with Ca(OH)2 sorbent and catalytic reforming with Ni/Fe dual-functional CaO-based catalysts. They achieved H2 yield (27.36 mmol g−1 cellulose), H2 concentration (79.22%), and H2 conversion (57.61%) at a 500 °C temperature. The literature shows a huge scope in the catalytic gasification process, especially in improving producer gas quality and reducing clinker formation
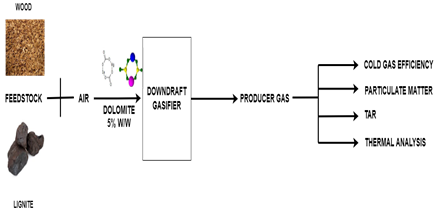
This paper deals with the experimental study of a gasification system with lignite and wood as fuels and dolomite as a catalyst. To check the compatibility of a catalyst with feedstock, the addition of 5% dolomite with lignite was selected based on the literature review. Gasifier performance, such as fuel flow rate, air-gas flow rate, producer gas concentration, cold gas efficiency, specific fuel consumption, tar, and PM in the producer gas, was measured for wood and lignite with and without using a catalyst. Thermodynamic analyses such as mass, energy, and exergy balance are also conducted in this study.
2. Materials and Methodology
2.1. Fuel
Lignite and scrap wood (Tectona grandis, teak wood) were selected as feedstock for the experimentation in the 10 kWe downdraft gasification system. Lignite and wood were procured from Rajpardi lignite mines (Gujarat, India) and a neighbouring furniture workshop.
Table 1. Characterization of wood and lignite.
|
Analysis |
Wood |
Lignite |
|
Proximate Analysis |
||
|
Volatile Matter |
73.40 |
42.09 |
|
Moisture |
6.70 |
11.77 |
|
Ash |
5.20 |
15.07 |
|
Fixed Carbona |
14.70 |
31.07 |
|
Ultimate Analysis |
||
|
Carbon |
40.30 |
37.78 |
|
Hydrogen |
5.37 |
4.95 |
|
Sulphur |
0.008 |
0.141 |
|
Nitrogen |
1.28 |
1.559 |
|
Oxygena |
46.35 |
40.50 |
|
Bulk Density (kg m-3) |
526 |
776 |
|
Heating Value (MJ kg-1) |
18.24 |
16.37 |
|
Particle size (mm) |
25*25*25 |
22-25 |
As reported earlier, lignite was crushed and screened to get in the desired size (22-25 mm) [2]. Wood was cut from a woodcutter in 25*25*25 mm size. The heating value, particle size, ultimate and proximate analysis and bulk density of lignite and wood were measured and mentioned in Table 1. Proximate and ultimate analysis was carried out with Leco TGA 701 (Test method: IS 1350 (Part I)-1984) and Leco ThuSpec CHNS (Dry basis). A digital bomb calorimeter (Instrument: Leco AC-350, Part II)-1970, Test method: IS 1350) was used to measure the heating values of the feedstock. Plastic air-tight containers were used to store the feedstock to preserve its composition and qualities throughout storage.
2.2. Catalyst
Dolomite CaMg(CO3)2 was used as a catalyst for this study. Lump dolomite was taken from Udaipur (Rajasthan, India) in a natural form. It was broken and sieved to maintain particle size between 22-25 mm. For experimentation, dolomite was added with the lignite or wood feedstock (5%, W/W). Dolomite was characterized to identify its behaviour with feedstock during the gasification process. The experiment used non-calcined dolomite, which contained 48.6 wt% CaO, 27.7 wt% MgO, 9.7 wt% SiO2, 6.2 wt% Fe2O3, 3.3 wt% Al2O3, and 3.6 wt% Cr2O3. Dolomites are considered to be the most well-thought and affordable catalyst for tar removal. The main accomplishment of gasification using dolomite is the reduction of tar, which improves the quality and yield of syngas [11]. Tar adhering to the catalyst surface in the downstream gasifier will reduce the catalyst's effectiveness. In addition, the downstream gasifier will corrode and develop blockages due to the tar particulate present in the produced gas [12].
2.2.1 Proposed mechanism of dolomite catalyst
As per the mechanism, the tar deposited on the dolomite catalyst's basic sites was thermally decomposed into coke, lighter hydrocarbons, and gaseous products. Further, lighter hydrocarbons decompose, and hydrogen gas is produced. This hydrogen gas facilitates the hydrogenation reaction of alkyl hydrocarbons, which results in the formation of methane. The methane under the dry reforming reaction reacts with carbon dioxide and produces a producer with a significant amount of hydrogen and some residual methane.
Main tar decomposition reactions at high temperatures using dolomite as a catalyst:
- Thermal cracking of tar
- Cracking of heavy tar
- Alkyl hydrogenation
- Dealkylation using produced hydrogen
- Dry reforming
- Carbon Formation
here m<x and n<y
2.2.2 XRF (X-ray fluorescence) Analysis
A solid dolomite and lignite ash sample is irradiated with high-energy X-rays from a controlled X-ray tube. A standard instrument, Rigaku X-Ray Spectrometer: Model-ZSX mini-II, is used to analyze dolomite Lumps (22-25 mm). The identification of major, minor, and accessory minerals in oxide states and their percentage is tabulated in Table 2.
The main constituents present in the dolomite lumps are CaO (48.67%) and MgO (27.77%), as mentioned in Table 2. As a result, this is believed to be pure dolomite. Several elements with 13 % content also had Al2O3, SiO2, Cr2O3, and Fe2O3.
Table 2. XRF composition of dolomite and lignite ash
|
1.2.1 Contents |
1.2.2 Dolomite Lump (%) |
1.2.3 Lignite Ash (%) |
|
MgO |
27.7705 |
2.627 |
|
Al2O3 |
3.2825 |
9.664 |
|
SiO2 |
9.7760 |
17.676 |
|
K2O |
0.1005 |
0.126 |
|
CaO |
48.6779 |
32.49 |
|
Cr2O3 |
3.5979 |
0.167 |
|
MnO |
0.2607 |
0.994 |
|
Fe2O3 |
6.2730 |
21.286 |
|
NiO |
0.2609 |
0.026 |
|
SO3 |
- |
12.375 |
2.2.3 XRD (X-ray diffraction) Analysis
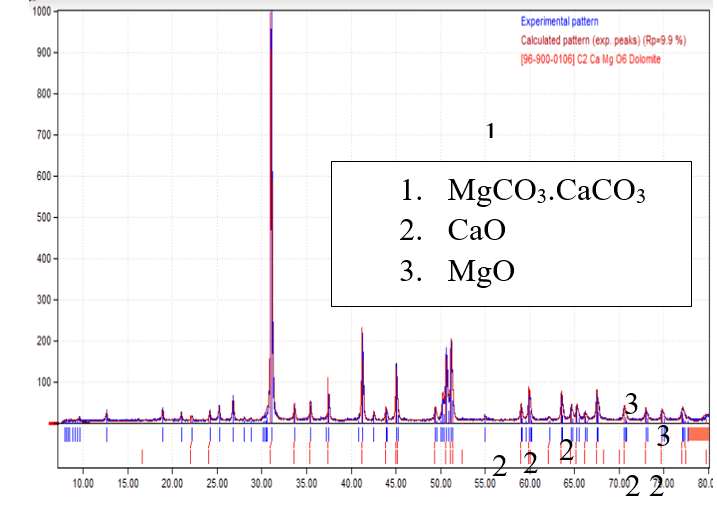
The crystalline structure of dolomite lumps was characterized by the XRD technique in a Philips X’PERT MPD X-ray diffractometer (UC Santa Barbara), with a source of Cu Kα (1.5405 Å). After various treatments, the XRD patterns of the calcined sample were recorded in a 2θ range between 10⁰ and 80⁰, with a rate of 4⁰/min. In the XRD analysis, the data were collected from 0 to 80 2θ. The highest peak was seen at 2θ 30⁰of calcite (CaCO3). These Sharp peaks of dolomite appear on 2θ 30.934⁰ and 41.108⁰ are resembled with rhombohedral crystal system, as shown in Figure 1. The obtained XRD of dolomite lumps was compared with the standard XRD of fresh dolomite. The weight % of calcium and magnesium oxide varies based on the dolomite source, and the weight % of calcium and magnesium oxide was a key determinant of dolomite effectiveness. The tar cracking efficiency was lowest in dolomites with lower CaO and MgO composition.
Brunauereemmetteteller (BET) and Barrett-Joyner-Halenda (BJH) analysis
Table 3. Surface area and pore volume of used catalyst before and after Used.
|
Parameters |
Raw Dolomite |
Used Dolomite |
|
Surface Area (m2g-1) |
19.86 0.27 |
11.29 |
|
BET |
||
|
Pore Volume (cm3g-1) |
0.0752 |
0.0654 |
|
Average Pore Diameter (4V/A) (Å) |
112.63 |
156.35 |
|
BJH |
||
|
Pore Volume (cm3g-1) |
0.073 |
0.064 |
|
Average Pore Diameter (4V/A) (Å) |
96.65 |
123.53 |
The active site of catalysts before and after use was characterised with Micromeritics ASAP 2010 using nitrogen adsorption/desorption isotherms, and results are tabulated in Table 3. Prior to characterization, the catalyst samples were degassed at 170℃ for 1 h. The adsorption and absorption isotherms provide the specific surface area as a function of the sample's relative pressure (P/P0). The catalyst's surface was observed to comprise two types of pores, i.e., macro-porous and micro/mesoporous. The specific surface area includes both external and pore areas in m2 g-1. The specific surface area of macro-pores is determined under BET analysis, whereas the pore volume and pore diameter of micro- and mesopores are determined using BJH. Above 700 to 900℃, the mesopores and macropores area increases due to the desorption of some gases, which was observed in TGA analysis in this temperature range. Secondly, the calcined dolomite has more macropores in comparison with raw dolomite. As a result, the average pore diameter has also increased.
2.2.7 Scanning electron microscope (SEM)
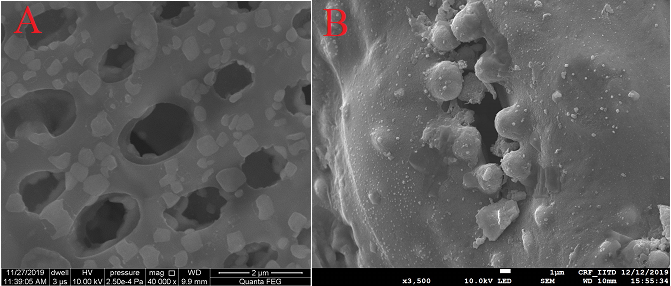
SEM analysis for surface morphology is shown in Figure 2 (A). It depicts that the unused catalyst shows high porosity due to the presence of micro and macro pores over the surface. In the used catalyst of Figure 2 (B), the ash or tar is deposited on its surface, which covers some of the catalyst's active sites and thus decreases surface area, which is also confirmed from BET analysis.
3. Experimental and Thermodynamic analysis
3.1 Experimental setup
The experiments were conducted in a 10 kWe atmospheric pressure downdraft gasifier with wood and lignite as fuel and dolomite lump as a catalyst. A representation of the gasification system diagram is illustrated in Figure 3. A vibration apparatus was mounted at the top side of the gasifier reactor to prevent the fuels from channelling or bridging inside the reactor. The water circulating pump, water tank, and water jet (nozzle) arrangement provided negative pressure for smooth gas flow. A wet scrubber, surge tank (sawdust-filled), and fabric filter were kept downstream of the gasifier to get a dust-free gas. The gas flow was observed using a calibrated orifice meter (with a U-tube manometer), and temperatures were measured using calibrated thermocouples (K type, Chromel-Alumel). Thermocouples were used to measure temperatures in the vertical direction inside the gasifier reactor in this investigation. A hotwire anemometer (Amprobe TMA-21HW) with a data logger and a Shimadzu 2010 gas chromatograph was used to evaluate air flow rate and producer gas concentrations, respectively. A Shin Carbon ST 100/120 micro-packed column and micro-thermal conductivity detector were used in a gas chromatograph. After the cold start, a flame is attained at the gas burner (15-20 min). The temperatures in the gasifier did not change significantly after the flame propagated. The experiments were conducted three times to check the repeatability of the results.
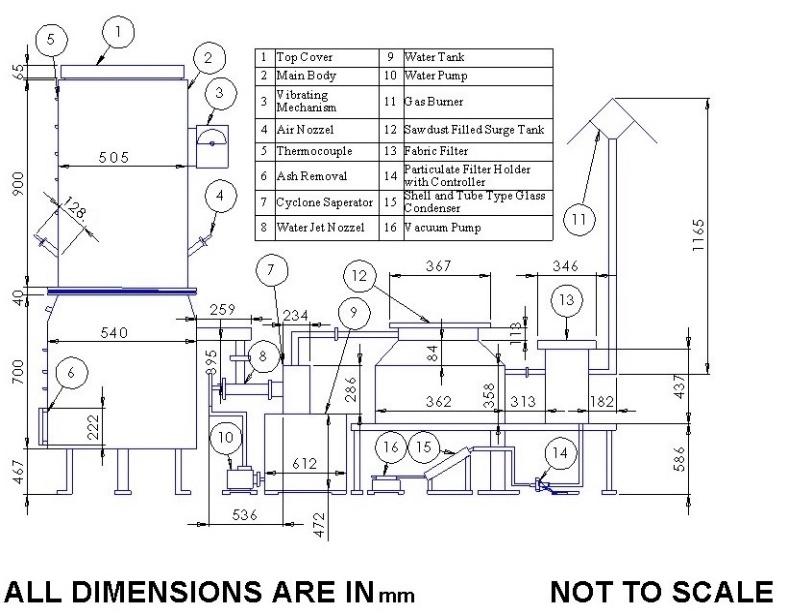
Total Particulate Matter (PM) and tar were measured as per the standard of the Ministry of New and Renewable Energy (MNRE), Government of India [13]. A setup was developed for measuring these contaminants: a PM holder with mica heater, shell and tube type glass condenser, chilling water arrangement with circulating pump and vacuum pump. Axiva makes glass fibre filter paper was used for collecting total particulate matter. The producer gas stream was taken from the mainline and diverted the producer gas in this system through a vacuum pump. The detailed working of the gasification system and tar-PM measurement can be found in the authors’ previous work [2], [6], [8], [14].
3.2 Thermodynamic Analysis
3.2.1 Mass Balance
This study aimed to conduct a mass balance analysis to determine the reliability of all the experiments conducted on the gasification of various feedstocks in the 10kWe gasifier. Mass conservation must hold for a control volume, i.e., the difference between input and output masses must equal zero. The feedstock and atmospheric air comprise the entire input mass, while the dry producer gas, char, tar, ash, and water vapours comprise the total output mass. Tar production was found insignificant in contrast to all other masses; thus, it was removed from the analysis [4].
For the gasification process, the following mass balance equation was used:
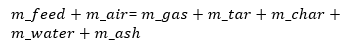
The mfeed and mair in the above equation represents the mass consumption rate of feedstock and mass flow rate of oxidizer in gasifier respectively while mgas, mash, mchar, mtar and mwater represent the mass flow rate of producer gas, ash, char, tar, and water formed in the process, respectively.
3.2.2 Energy Balance
For any thermal system, studying energy balance is critical since it can assist in reducing system losses. It is a crucial thermodynamic study that aids in improving the system's performance. The equation was used to calculate the energy balance.

where the energy rate of the feed (Efeed) and the energy content of the air entering Eair define the input energy. While the energy rates of producer gas (Egas), char (Echar), tar (Etar), ash (Eash), water (Ewater), and losses in the gasifier Elosses represent the output of the gasifier system.
3.2.3 Exergy Balance
The current study also included an exergy analysis of gasification with lignite as a fuel. The system's thermodynamic performance is revealed through an exergy study. The gasification energy balance can be expressed as (Eq. (3)):
 =
= 
Where ∅_(out ) and ∅_(in )are the output and input exergy, respectively, and I is the irreversibility that occurred during the conversion process. The change in enthalpy of a specific gas component from the reference state to the specified pressure and temperature is referred to as thermo-physical exergy. The normal chemical exergy mixing of all ingredients and the loss in entropy owing to the blending of different species of gases is referred to as the chemical exergy of the mixture. The ratio of the exergy of the producer gas to the sum of the exergy of the lignite and air is defined as exergy efficiency (Eq. (4)):

Detailed procedures for calculating mass, energy, and exergy analysis can be found in the authors’ previous work [6], [15], [16].
4. Results and Discussion
4.1 Temperature
Figure 4 indicates the drying, pyrolysis, combustion, and reduction zone temperatures for different feedstock. The temperatures range in pyrolysis and the drying zone were observed between 355°C-452°C and 150°C-178°C, respectively. Moreover, the temperatures range in reduction and the combustion zone were observed between 570°C-675°C and 840°C-973°C, respectively. It was observed that the temperature was found higher when dolomite was added with feedstock. The thermal decomposition of dolomite is an endothermic process; however, thermal energy used by dolomite catalyst was released afterwards and boosted the Water Gas Shift reaction [17]. It is responsible for increasing the temperature in the combustion zone. It was also determined that wood feedstock offered higher temperatures than lignite feedstock. It may be because the wood has higher volatile matters and lower moisture–ash contents which would help to boost the temperature.
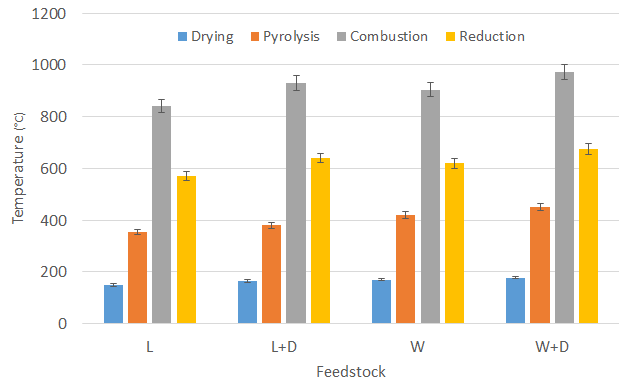
Figure 4 indicates the drying, pyrolysis, combustion, and reduction zone temperatures for different feedstock. The temperatures range in pyrolysis and the drying zone were observed between 355°C-452°C and 150°C-178°C, respectively. Moreover, the temperatures range in reduction and the combustion zone were observed between 570°C-675°C and 840°C-973°C, respectively. It was observed that the temperature was found higher when dolomite was added with feedstock. The thermal decomposition of dolomite is an endothermic process; however, thermal energy used by dolomite catalyst was released afterwards and boosted the Water Gas Shift reaction [17]. It is responsible for increasing the temperature in the combustion zone. It was also determined that wood feedstock offered higher temperatures than lignite feedstock. It may be because the wood has higher volatile matters and lower moisture–ash contents which would help to boost the temperature.
Clinker formation was observed to be very common with lignite feedstock. Due to the same, the gasifier couldn’t operate for a long time. It was found that after the addition of catalyst in the lignite, no clinkers were found during the 180 minutes of the experimental run. For wood feedstock also, no clinkers were observed.
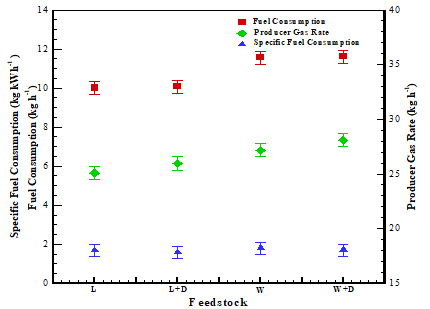
4.2 Fuel consumption rate and producer gas flow rate
Figure 5 includes each feedstock's fuel consumption, specific fuel consumption, and gas flow rate. Fuel and catalyst were weighed and blended before experiments started. The remaining fuel inside the gasifier reactor was measured after 3 hours of experimentation. The weight of the catalyst was found to be the same before and after the experiment. For selected feedstock, it was observed that fuel consumption was found in the range of 10.01 kg h-1 to 11.56 kg h-1. Adding the catalyst into feedstock increases the fuel consumption rate, as shown in Table 4. It may be due to the catalyst activity and rate of reactions [18]. The catalyst would boost the reaction rate in the gasifier reactor due to thermodynamically promoting the active phase [19]. The dolomite catalyst would also enhance conversion efficiency by offering a large reaction contact area, potentially leading to higher fuel consumption. By employing a catalyst with feedstock, carbon conversion efficiency improves, resulting in higher fuel consumption and gas flow rates.
As a result, heavy tar was converted into a gas, possibly increasing gas yields [20]. It is possible because the gas yield increases when a catalyst is fed to the feedstock. The specific fuel consumption (SFC) was evaluated, as mentioned by Karagiannidis [21]. SFC was calculated and found in the range of 1.79 kg kWh-1 - 1.92 kg kWh-1 for all selected feedstock, which aligns with the literature [21]. Catalysts offer lower SFC, hich shows their positive effect on the gasification system. Airflow and gas flow rates were also found to be incremental when the catalyst was employed in the reactor. The same trend aligns with fuel consumption, as mentioned in Figure 5.
4.3 Gas composition and LHV of producer gas
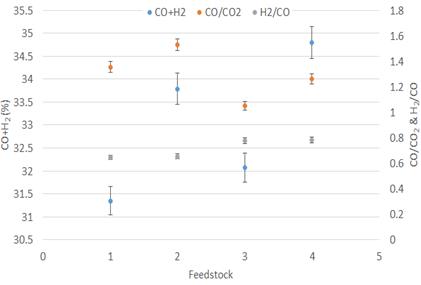
The combustible gases, dust, soot, tar, particulates, and other non-combustible are present in the producer gas. The gasifier generates combustible gases, including CO, H2, CH4, and other hydrocarbons and non-combustible gases, such as CO2 and N2. In contrast to H2 and CO, the concentration of CH4 in producer gas is substantially lower. Figure 6 shows the concentrations of the producer gas compositions determined by gas chromatography, with lignite and wood as feedstock, total combustible gas content (CO, H2, CH4) 25.07% & 25.96% and 29.35% & 29.69% for with and without using a catalyst, respectively. The maximum combustible gas concentrations were observed with the addition of a catalyst in a feedstock. It is because the boudouard reaction occurred at higher temperatures and a favourable catalyst reactively at a higher temperature. With the use of catalysts, the concentration of CO and H2 in the producer gas was found to be higher
Furthermore, the tar reforming reaction on the catalyst surface was enhanced by the extraction of carbon, which resulted in the production of a wide range of CO and H2 [22], [23]. With a catalyst, CO yield increased by 7.29% and 7.98%, respectively, when the catalyst was added to lignite and wood feedstock. The favourable Water Gas Shift (WGS) reaction at higher combustion zone temperatures resulted in a high H2/CO in the producer gas [24]. It was observed that the ratio of H2/CO in the producing gas increased with a catalyst, as mentioned in Figure 7. CO2 concentrations decreased significantly when the experiment was carried out with a catalyst. However, the CH4 content from all the feedstocks was almost constant.
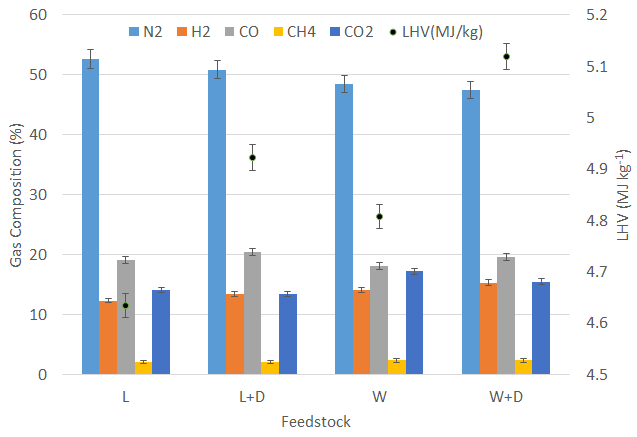
Reed et al. [25] suggested a method for calculating the producer gas Lower Heating Value (LHV). For calculating the LHV of the producer gas, combustible constituents such as H2, CO, and CH4 gases were used. Heavy hydrocarbons were ignored due to their least significant compared to the other gases mentioned above. The LHV was calculated and found to be higher when fuel was blended with a dolomite catalyst, which is consistent with studies by Appell et al. [26]. It has a similar trend of H2 and CO gases. The LHV remained between 4.63 and 5.11 MJ Nm-3 for all selected feedstock. The LHV of producer gas with different feedstock is shown in Figure 6. The LHV was alleged in an incremental direction as dolomite was added in the lignite.
4.4 Mass balance
Table 4 shows the mass balance for various feeds and catalysts. In the gasification process, the mass of fferent feed and air mixes was used as an input, while the mass generated dry gas, char, water, and ash was used as an output. The amount of tar content in producer gas is usually overlooked because of the low concentration of tar compared to other constituents in the output. A hydrometer was used to assess the total moisture present in the product gas with all feedstock. The ash pit was used to collect ash and char. The amount of ash in the output was solely affected by the volume of fuel used.
The char content was computed as a result of this. Because of the higher reaction temperatures, the char content decreased with the addition of the catalyst. Depending on output mass versus input mass, the Mass Balance Closure (MBC) was computed and found to be in the range of 1.02-1.04. The variability in MBC could be attributable to physical or measurement mistakes and uncertainty during the experiments.
Table 4. Mass Balance of different conditions.
|
Mass Balance (kg h-1) |
|||||||||
|
Feed |
Mass Input (kg h-1) |
Mass Output (kg h-1) |
MBC |
||||||
|
Fuel |
Air |
Total |
Gas |
Ash |
Char |
Water |
Total |
||
|
L |
10.01 |
17.07 |
27.08 |
25.07 |
1.24 |
0.24 |
1.09 |
27.64 |
1.021 |
|
L+D |
10.07 |
17.26 |
27.33 |
25.96 |
1.32 |
0.2 |
0.95 |
28.43 |
1.040 |
|
W |
11.56 |
17.79 |
29.35 |
27.16 |
0.60 |
1.09 |
1.39 |
30.24 |
1.030 |
|
W+D |
11.6 |
18.09 |
29.69 |
28.09 |
0.63 |
1.05 |
1.23 |
31 |
1.044 |
Table 5. Energy balance of different conditions.
|
Energy Balance (MJ h-1) |
|||||||||
|
Feed |
Energy Input (MJ h-1) |
Energy Output (MJ h-1) |
EBC |
||||||
|
EFuel |
EAir |
Total |
EGas |
EAsh |
EChar |
EWater |
Total |
||
|
L |
163.864 |
0.171 |
164.034 |
132.986 |
0.074 |
0.401 |
0.333 |
133.794 |
0.816 |
|
L+D |
164.846 |
0.173 |
165.019 |
137.738 |
0.079 |
0.334 |
0.290 |
138.441 |
0.839 |
|
W |
210.854 |
0.178 |
211.032 |
156.526 |
0.036 |
1.820 |
0.425 |
158.807 |
0.753 |
|
W+D |
211.584 |
0.181 |
211.765 |
162.076 |
0.038 |
1.754 |
0.376 |
164.243 |
0.776 |
4.5 Energy balance
Table 5 shows the input and output energies for various feedstock and the energy balance closure (EBC). Fuel energy is determined entirely by multiplying the LHV of fuel and the fuel consumption rate. Because the LHV per kg of feed remained constant, the energy rate of fuel is only dependent on fuel consumption. The airflow rate and temperature of air impact the energy of air. As multiple trials were conducted on different days, variations in air temperature were observed. The energy derived from ash was shown to be higher for lignite feedstock than wood feedstock due to the higher amount of ash content available in raw material. The trend of ash, char, and water in the energy balance is similar to the same mass balance for different feedstock. The ECB ratio was determined to be between 0.776 and 0.816.
4.6 Cold gas efficiency and Exergy analysis
Figure 8 shows cold gas efficiency and exergy efficiency for various feedstock. Both the terms are measured as mentioned in literature [6], [27], [28]. It is observed that the addition of catalysts would be favourable in terms of cold gas efficiency and exergy efficiency. It may be due to the catalyst's higher fuel conversion efficiency and reactivity. Lignite offered higher cold gas efficiency compared to wood. It is because lignite had lower fuel consumption and offered relatively good quality producer gas.
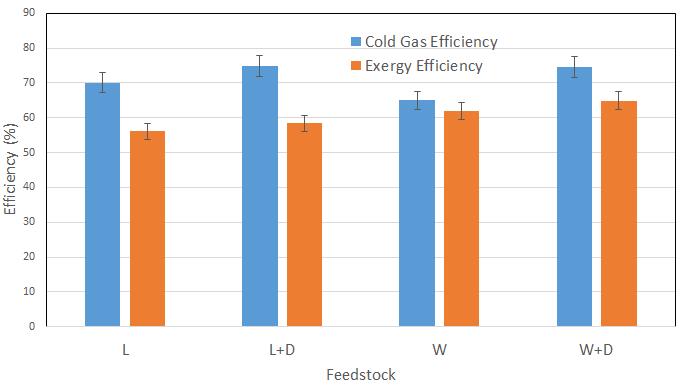
Exergy analysis was carried out as mentioned in section 3.2. The composition of the fuel determines exergy. Because the exergy of fuel is independent of the fuel composition and stayed relatively stable throughout the experimental run, the exergy was increased with different feedstock. It can be observed from Figure 8 that the exergy efficiency keeps on increasing with the catalyst. Exergy efficiency was calculated and found in the 56.10% – 64.92% range for selected feedstock.
4.7 PM and tar in the producer gas
The PM and tar content harm the downstream gasifier process equipment in the producer gas. For gas turbines and internal combustion engines, experts have established a tolerable range for tar and PM [28] [29]. The PM was measured after the proper cleaning, while tar was measured from the gasifier system at two points: 1) just after the gasifier reactor and 2) after the cleaning system (before the gas burner). Figure 9 depicts the amount of PM and tar in producer gas.
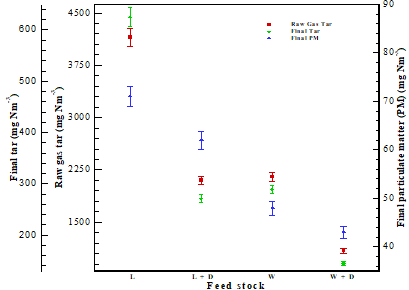
PM concentrations were measured after the cleaning system (before the burner) and found to be between 48.11 and 71.12 mg Nm-3. The use of a catalyst was shown to result in decreased PM levels in the producing gas. It's because, in the presence of a catalyst, a more significant temperature would transform huge PM into small particles. The concentrations of tar in producer gas immediately after the gasifier reactor and after the cleaning system were measured and found in the range of 1091 mg Nm-3- 4150 mg Nm-3 and 145 mg Nm-3- 625 mg Nm-3 for all selected (lignite and wood) feedstock. The dolomite played a significant role in destroying the tar in the producer gas. Reduction in tar is mainly due to catalyst activities inside the reactor and higher temperatures. Reduction in tar concentrations may increase the amount of combustible gases, improving the gasifier's overall performance. It was also observed that almost 85%-87% of tar is captured in the cleaning system compared to tar in raw gas measured immediately after the gasifier reactor.
4.8 Cost of energy and payback period
The current study considers lignite and wood as feedstock for energy generation via air gasification (catalytic). Here, only lignite calculation is presented. Similarly, the wood calculation can also be carried out. The actual cost of the material and cleaning system was mentioned for this calculation. However, it is a fact that the cost is reduced at an extended level if someone upscaled the gasification unit due to lower running costs. For raw material treatment, lignite cost and dolomite (5% wt. than lignite) cost were considered. As lignite and dolomite are available directly from the mines as a huge lump, sizing is required. The sizing of feedstock is considered in the electricity cost. Apart from that, commercial electricity cost is considered ₹8 per unit as per Gujarat State Electricity Corporation Limited. The gas cleaning system is majorly a combination of three units, 1) wet scrubber, 2) sawdust-filled filter (surge tank), and 3) bag-type fabric filter. A wet scrubber utilizes the water circulation pump, so the energy consumption of a centrifugal pump is considered. The remaining two systems' electricity consumption is not mentioned as per the reason mentioned in Table 6. Overhead changes and maintenance charges are also considered here. It was observed from Table 6 that electricity cost by the gasification system is more than which government supplied. Due to the same, this laboratory scale system could not be profitable to install where such electricity is available. However, for the interior part of the country, where the power grid is not available, or the cost of raw (feedstock) material is almost free of cost, this system is ideal to operate. An increment in auxiliary power consumption and reduction in running cost is generally expected for commercial gasification systems instead of this lab-scale system.
Table 6. Breakup of cost.
|
Cost factor |
Cost breaks down |
Total cost in ₹ |
|
Raw material treatment |
Raw material cost with transportation Lignite procured from a local supplier (1 kg) Dolomite procured from a local supplier (0.05 kg) |
5
1.5 |
|
Size reduction cost hours × units × per unit cost = 0.25 × 0.5 × 8 |
1 |
|
|
Gas treatment
|
Gas cleaning through a Sawdust filter is not considered as sawdust material collected free of cost from the local furniture industry. A fabric filter is washable, so its cost is not considered Gas cleaning through water scrubbing (hours × units × unit cost) = (1 × 0.25 × 8) |
Nil
Nil
2 |
|
Net cost |
9.5 |
|
|
Overhead charges |
10% of overall production cost = 0.1 × 9.5 |
0.95 |
|
Maintenance cost |
5% of 10% of overall production cost = 0.05 × 0.95 |
0.05 |
|
Total cost |
10.5 |
|
Table 7 Important parameters to be required for calculating payback period.
|
Parameters |
Values |
|
The capacity of the gasifier per hour |
10 kWe |
|
Gasifier unit cost with generator |
₹ 5,70,000/- |
|
Lignite production in Gujarat State (India) |
13.330 (MT) [29] |
|
Daily working hours |
20 h |
|
Daily maintenance hours |
4 h |
|
Gasifier feeding capacity |
10 kg h-1 |
|
Yearly running time |
300 days |
|
Syngas selling price |
₹ 25/- |
Total cost (as per Table 7) per year = Total cost per day × 300 = 3,00,000
Total Investment = Gasifier unit with Generator Cost + Total cost per year = 8,70,000
Total revenue generated = Electricity generated × Unit price = 3,67,301
Payback period = Total investment/ Total revenue
The payback period was calculated to inspect the economic feasibility of a gasification-based powerplant production system. This is the one of the most basic approaches for evaluating an investment proposal. It is basically the period during which the project's initial expenditure is recovered. The payback period is premeditated considering the upscaling of the gasification system of 10 kWe. The Table 7 demonstrates the values and parameters considered for the payback period. As per calculation, total investment and total revenue generated are ₹8,70,000 and ₹3,67,301, respectively. As per that, the payback period is around 2.37 years for an existing catalytic lignite gasification system, which is in line with the literature [30].
5. Conclusions:
Experiments were conducted with two feedstocks (lignite and wood feedstock) and a catalyst to check its feasibility and performance on a 10 kWe downdraft gasifier. Lump dolomite was used as a catalyst (5%, W/W). The employment of a catalyst was responsible for all zone temperatures for both fuels. The CO and H2 gas concentration was increased, whereas the CO2 gas concentration was decreased for catalytic gasification. The CH4 gas concentration was found to be almost constant. The fuel consumption, gas flow rate, and LHV of producer gas increased, whereas SFC decreased with the addition of a catalyst with fuels. Cold gas efficiency and exergy efficiency were calculated and found in the range of 62.60%-74.93% and 56.1%-64.9%. Mass balance closure (MBC) and Energy balance closure (EBC) were found in the range of 1.02 – 1.04 and 0.75 – 0.83, respectively for selected feedstock. 56.64% (L) and 49.83% (W) tar and 12.68% (L) and 10.42% (W) PM in the producer gas (collected after the cleaning system) were reduced when the catalyst was added in lignite and wood fuels, respectively. The major conclusion of this study is that adding a dolomite catalyst in lignite/wood feedstock improves the overall performance of the gasifier.
Acknowledgement:
The authors express sincere appreciation to the Nirma University, Ahmedabad (Project Grant No: NU/Ph.D./MRP/IT-ME/ 16e17/851) and Department of Science and Technology, New Delhi (Project Grant No: SR/S3/MERC-0114/2010) for the financial support. Dr Darshit S. Upadhyay expresses gratitude towards International Travel Support (File Number: ITS/2023/000740) from the Science and Engineering Research Board (Govt. of India) for giving financial aid to attend the 10th International Conference of Fluid Flow, Heat and Mass Transfer, Canada on 07 - 09 June 2023.
Disclosure statement
No potential conflict of interest was reported by the authors.
References
[1] J. Phillips, "Different Types of Gasifi ers and Their Integration with Gas Turbines 1.2.1-1 Introduction," Transport, pp. 67-77, 2004.
[2] V. R. Patel, D. S. Upadhyay, and R. N. Patel, "Gasification of lignite in a fixed bed reactor: Influence of particle size on performance of downdraft gasifier," Energy, vol. 78, pp. 323-332, 2014, doi: 10.1016/j.energy.2014.10.017. View Article
[3] D. S. Upadhyay, A. K. V Sakhiya, K. R. Panchal, and R. N. Patel, "Journal of Energy and Environmental Sustainability Thermodynamic Analysis of Lignite Gasification in the Downdraft Gasifier," pp. 58-64, 2018. View Article
[4] V. R. Patel, D. Patel, N. S. Varia, and R. N. Patel, "Co-gasification of lignite and waste wood in a pilot-scale (10 kWe) downdraft gasifier," Energy, vol. 119, pp. 834-844, 2017, doi: 10.1016/j.energy.2016.11.057. View Article
[5] H. Siddiqui, S. K. Thengane, S. Sharma, and S. M. Mahajani, "Revamping downdraft gasifier to minimize clinker formation for high-ash garden waste as feedstock," Bioresour. Technol., vol. 266, pp. 220-231, Oct. 2018, doi: 10.1016/J.BIORTECH.2018.06.086. View Article
[6] D. S. Upadhyay, A. Khosla, A. Chaudhary, and R. N. Patel, "Effect of catalyst to lignite ratio on the performance of a pilot scale fixed bed gasifier," Energy, vol. 189, 2019, doi: 10.1016/j.energy.2019.116229. View Article
[7] H. V Makwana, D. S. Upadhyay, J. J. Barve, and R. N. Patel, "Strategies for Producer Gas Cleaning in Biomass Gasification: A Review," in Conference Proceedings of the Second International Conference on Recent Advances in Bioenergy Research, 2018, pp. 115-127. View Article
[8] D. S. Upadhyay, H. V. Makwana, and R. N. Patel, "Performance evaluation of 10 kWe pilot scale downdraft gasifier with different feedstock," J. Energy Inst., vol. 92, no. 4, pp. 913-922, 2019, doi: 10.1016/j.joei.2018.07.013. View Article
[9] A. Chen, Z. Tian, R. Han, X. Wei, R. Hu, and Y. Chen, "Preparation of Ni-based steel slag catalyst by impregnation method for sludge steam gasification," Sustain. Energy Technol. Assessments, vol. 47, no. April, p. 101553, 2021, doi: 10.1016/j.seta.2021.101553. View Article
[10] X. Zeng et al., "Enhanced hydrogen production by the catalytic alkaline thermal gasification of cellulose with Ni/Fe dual-functional CaO based catalysts," Int. J. Hydrogen Energy, vol. 46, no. 65, pp. 32783-32799, 2021, doi: 10.1016/j.ijhydene.2021.07.142. View Article
[11] M. W. Islam, "A review of dolomite catalyst for biomass gasification tar removal," Fuel, vol. 267, p. 117095, 2020, doi: https://doi.org/10.1016/j.fuel.2020.117095. View Article
[12] M. Hervy et al., "Evolution of dolomite composition and reactivity during biomass gasification," Appl. Catal. A Gen., vol. 572, pp. 97-106, 2019, doi: https://doi.org/10.1016/j.apcata.2018.12.014. View Article
[13] Govt. of India, "Qualifying, Testing and Performance Evaluation of Biomass Gasifiers and Gasifier-Engine Systems, Gasifier Action Research," 2000.
[14] D. S. Upadhyay, K. R. Panchal, A. K. V. Sakhiya, and R. N. Patel, "Air-Steam gasification of lignite in a fixed bed gasifier: Influence of steam to lignite ratio on performance of downdraft gasifier," Energy, vol. 211, 2020, doi: 10.1016/j.energy.2020.118187. View Article
[15] D. S. Upadhyay, A. K. V Sakhiya, K. R. Panchal, and R. N. Patel, "Thermodynamic Analysis of Lignite Gasification in the Downdraft Gasifier," J. Energy Environ. Sustain., vol. 5, pp. 58-64, 2018. View Article
[16] A. Kumar et al., "Elemental and Heat Loss Analysis of Different Feedstock in Downdraft Gasifier," J. Energy Environ. Sustain., vol. 7, pp. 10-16, 2019, doi: 10.47469/jees.2019.v07.100070. View Article
[17] W. P. Walawender, D. A. Hoveland, and L. Fan, "Steam gasification of pure cellulose. 1. Uniform temperature profile," Ind Eng Chem Process Des Dev, vol. 24, pp. 813-817, 1985. View Article
[18] Harald Jüntgen, "Application of catalysts to coal gasification processes. Incentives and perspectives," Fuel, vol. 62, no. 2, pp. 234-238, 1983. View Article
[19] D. J.Marchand et al., "Physical and chemical changes of coal during catalytic fluidized bed gasification," Fuel Process. Technol., vol. 130, pp. 292-298, 2015. View Article
[20] K. Kumabe, T. Hanaoka, S. Fujimoto, T. Minowa, and K. Sakanishi, "Co-gasification of woody biomass and coal with air and steam," Fuel, vol. 86, no. 5-6, pp. 684-689, 2007. View Article
[21] K. Avraam, opportunities and challenges for developing and transition economies. View Article
[22] N. T. Thanasit Wongsiriamnuay, Nattakarn Kannang, "Effect of Operating Conditions on Catalytic Gasification of Bamboo in a Fluidized Bed," Int. J. Chem. Eng., pp. 1-10, 2013. View Article
[23] P. Basu, Biomass Gasification and Pyrolysis: Practical Design and Theory. Academic Press, Elsevier, 2010.
[24] Pfeifer P., "High-temperature/high-pressure water gas shift reaction to increase the H2/CO-ratio in syngas from biomass gasification.".
[25] S. Technical et al., Handbook of Biomass Downdraft Gasifier Engine Systems, no. March. SERI, 1988. doi: 10.2172/5206099. View Article
[26] H. Appell, I. Wender, and R. Miller, "Solubilization of Low Rank Coal With Carbon Monoxide and Water," Chem. Ind., vol. 1703, 1969.
[27] K. Sandeep and S. Dasappa, "First and second law thermodynamic analysis of air and oxy-steam biomass gasification," Int. J. Hydrogen Energy, vol. 39, no. 34, pp. 19474-19484, 2014, doi: 10.1016/j.ijhydene.2014.09.134. View Article
[28] D. S. Upadhyay, A. K. Sakhiya, K. Panchal, A. H. Patel, and R. N. Patel, "Effect of equivalence ratio on the performance of the downdraft gasifier - An experimental and modelling approach," Energy, vol. 168, pp. 833-846, 2019, doi: 10.1016/j.energy.2018.11.133. View Article
[29] "CEIC." https://www.ceicdata.com/en/india/lignite-production/lignite-production-annual-gujarat (accessed Jun. 26, 2023). View Article
[30] U. Kakati et al., "Sustainable utilization of bamboo through air-steam gasification in downdraft gasifier: Experimental and simulation approach," Energy, vol. 252, p. 124055, 2022, doi: 10.1016/j.energy.2022.124055. View Article