Journal of Fluid Flow, Heat and Mass Transfer (JFFHMT)
ISSN: 2368-6111

Volume 9 - Year 2022 - Pages 191-199
DOI: 10.11159/jffhmt.2022.023
Real-Time Measurement Technique for Slug Flow Characterisation
Seyyed Saeed Shojaee Zadeh1,2, Vanessa Egan1,2, Pat Walsh2
1CONNECT, Stokes Laboratories, Bernal Institute, School of Engineering,
University of Limerick, Ireland, V94T9PX
saeed.zadeh@ul.ie; vanessa.egan@ul.ie
2Bernal Institute, School of Engineering, University of Limerick, Ireland, V94T9PX
pat.walsh@ul.ie
Abstract - To achieve accurate slug lengths and velocities in a slug flow regime, monitoring of the droplet/bubble train is an essential stage which necessitates the use of proper techniques. In most experiments, the traditional measurement apparatus consists of a high-speed camera coupled to a microscope which are employed to characterize such flows in microchannels. However, when using these techniques, optical distortion caused by the curved channel walls can result in large measurement uncertainty which undermines the measurement accuracy. In this regard, this study introduces a novel technique to easily and reliably measure slug length and velocity. This automated, non-intrusive measurement technique allows for in-line high-frequency droplet/bubble detection and related physical properties based on changes in the light intensity caused by a phase shifting in liquid-liquid or liquid-gas flows.
Keywords: slug flow, non-intrusive technique, in-line, high-frequency.
© Copyright 2022 Authors - This is an Open Access article published under the Creative Commons Attribution License terms Creative Commons Attribution License terms. Unrestricted use, distribution, and reproduction in any medium are permitted, provided the original work is properly cited.
Date Received: 2022-09-09
Date Accepted: 2022-12-13
Date Published: 2022-12-20
1. Introduction
Slug flow, also commonly known as Taylor flow, consists of two immiscible fluids moving within a channel. One of the fluids, the carrier phase, wets the channel wall and entirely engulfs the second fluid known as the dispersed/droplet phase. The second phase is present as discrete slugs/droplets within the carrier phase. In microchannels, slug flows have the advantage of high surface-to-volume ratios and internal circulations which not only promote thermal transfer from the channel wall but also mass transfer between phases [1-3]. Numerous experimental and numerical studies have demonstrated higher heat transfer rates of up to 700% when compared to standard single phase flows [4]. Slug flows are also used in microreactors, microfiltration, and catalytic processes to increase mixing rates and efficiency [5-7].
Droplet-based microfluidic devices can now be employed in a variety of exploratory experiments, including those involving protein crystallization [8], DNA analysis [9] and polymer particle formation [10]. Such chemical reactions can be carried out in well-defined reaction volumes ranging from nanoliters to picoliters, thanks to the use of droplet-based microfluidic systems [11]. In this regard, numerous techniques for high – throughput analyses of droplet contents as well as techniques for generating and manipulating droplets in microfluidic devices have been developed [12-15]. The characterization of key variables such as the droplet size, velocity, and frequency is one of the primary concerns in the development of these microfluidic applications. Due to the small physical dimensions of such microfabricated devices, non-intrusive measurement techniques with high resolution are required to assess the flow properties. Non-invasive measurement techniques that have been previously used include optical techniques, using a high speed camera and a microscope [16], capacitance, using coplanar electrodes [17], and voltammetry, using two electrodes [18].
In recent decades, microchannel flows are commonly studied using imaging techniques. The most common method is optical microscopy, which involves illuminating the flow from underneath with a powerful light source and inspecting it from above with a short camera shutter length. This method typically requires complicated and expensive instrumentation, such as microscopes with integrated high-speed cameras and a powerful light source, restricting adaptability and providing only narrow-time assessments [19]. Furthermore, the accuracy of the data obtained is heavily reliant on the camera's resolution and the operator's skill. Optical distortion caused by curved channel walls or varying refractive index may also cause significant measurement inaccuracy. Particularly, in circular microchannels with extremely small radii, optical distortion is a major issue for flow imaging. In addition, this technique does not allow in-line assessment and to obtain results, post processing of images is necessary.
In an effort to overcome some of the difficulties associated with measurements obtained using imaging techniques, Jakiela, et al. [20] employed a linear camera to only capture the channel's centreline. This method enables in-line measurements of droplet length and velocity by collecting necessary data and accelerating data processing by simply identifying the front and rear caps of the droplet. However, this method still requires a microscope with an integrated high-speed camera, which brings considerable uncertainty to the measurements.
In addition to optical methods, there are also other methods based on changes in a fluid's electrical characteristics caused by the presence of a second phase. Differences in the electrical resistances of the phases involved, means that resistive approaches are often utilized in cytometry to detect the presence of the droplets [21]. However, this technique cannot provide an exact measurement of droplet length due to the low sensitivity of the technique. A capacitive measurement technique was also developed by Niu, et al. [22], which detects the passing of a droplet and determines its velocity by means of a suitable signal post-processing. However, this approach gives less accurate length measurements as a result of signal convolution. Capacitive sensors are generally used in microelectromechanical systems (MEMS), commonly to sense pressure and acceleration [23, 24]. It is crucial to keep in mind that each of these electrical approaches requires intricate microfabrication and electrode implantation within the channel.
It is also possible to explore the instantaneous flow conditions by means of tracer-based measuring techniques such as particle image velocimetry (PIV) or light-induced fluorescence (LIF). Unfortunately, adding tracers inevitably contaminates the fluidic system, which results in disrupted local hydrodynamics and triggered chemical reactions. Additionally, this technique requires bulky and expensive equipment to perform the measurements and laborious procedures to extract the data.
Thus, researchers have found it challenging to develop precise and suitable apparatus for in-line assessment and manipulation of flow characteristics in microscale two-phase flows. Research in this area is motivated by the need to establish ultrasensitive detectors that can extract the most information about the flow characteristics and enable instant modifications to the flow.
In this regard, the current study proposes a novel measurement technique for investigating flow properties in both liquid-liquid and liquid-gas slug flow regimes. Regardless of channel shape, this non-intrusive approach allows in-line measurements of both carrier and dispersed phase length and velocity with excellent precision. This measurement methodology will aid in the determination and analysis of two-phase flow configurations in transparent microchannels, allowing for a better comprehension of the experimental data.
2. Experimentation
The main goals of the experiments are to measure the droplet length and velocity in a two-phase flow regime. This requires an experimental test bed to create and move a slug train within a tubing of precisely defined dimensions and the ability of the setup to automatically detect a phase shift.
2. 1. Droplet Generation and Transport
In microfluidic applications, syringe pumps are the preferred option as they offer sufficiently stable and reliable volumetric flow rates. In the current experiment, a Harvard Pico Plus Elite syringe pump, with an accuracy of ±0.35%, was used to pump the fluid through the tubing. This programmable pump provides improved flow performance with extreme precision and a smooth flow range of 0.54 pl/min to 11.70 ml/min. Glass syringes with a high accuracy of nominal diameter were used to minimize any uncertainty due to deformation of the barrel and piston during the experiments. Therefore, the pump setup can provide a precise flow rate.
Before generating droplets, the tubing was first primed with the carrier liquid. Then, with the syringe pump at one end of the tube in withdraw mode, the two liquids were drawn into the tube while simultaneously vertically sliding a custom designed traverse/dipping stage into a reservoir containing both immiscible fluids. As the tubing's tip enters the target liquid, the pump draws in a desired amount of that liquid. This requires knowledge of which phase is denser and the precise location of the interface between fluids to be input to the traverse programme. To prevent drawing the incorrect fluid, the dipping height must be adjusted according to interface position within the reservoir. By means of G-Code programming, the traverse system and syringe pump can generate droplets with different lengths. This technique enables a high precision and a significant high degree of freedom in terms of the droplet and the carrier phase lengths.
2. 2. Tubing Diameter Measurement
Droplets were generated in FEP Teflon tubes (Cole ParmerTM) with the nominal inner diameter of 0.8mm and the total length of 5.70m. Knowing the exact cross-sectional area of the channel with the least amount of uncertainty is essential when working with microfluidics systems. In experimental trials, the nominal sizes of the channels, as given by the manufacturers, are typically considered in calculations. However, there is often a mismatch between the nominal and actual dimensions.
Particle Image Velocimetry (PIV) is a commonly used measurement technique in the literature to determine the actual channel’s cross-sectional area. In this measurement technique, the analytical solution for the velocity profile across the tube, given by the Navier-Stokes equations for a laminar flow regime, can be employed to determine the tube diameter at specific locations. To precisely determine the bi-dimensional velocity profile in different planes of the microchannel, the actual shape of the section must first be determined. Therefore, microscopic techniques such as SEM are usually needed to accurately define the cross-section’s shape. Typically, the cross-section's shape does not match the manufacturer's data sheet exactly. For example, according to the data sheet provided by a manufacturer, the channel’s cross-section must be perfectly square, although it may be somewhat trapezoidal and the angles may not be exactly right-angles but rather have a rounded layout. This can significantly affect the accuracy of the velocity measurements determined by means of PIV. Therefore, it is relatively challenging to precisely determine the cross-sectional area of a microchannel using PIV/µPIV. Moreover, variations in dimensions along the channel length are not included in this measurement technique as it is a local velocity measurement at a specific distance along the tubing length. A method that provides an averaged value of the diameter is more desirable.
Measuring the pressure drop along a specific length of the channel is another method for determining the cross-sectional area of a microchannel. In the case of circular cross-sections, the capillary diameter can be determined by measuring the pressure drop of a laminar flow along the tubing and applying Hagen-Poiseuille’s equation (D4=128μLQ⁄π∆P) [25]. This method delivers the averaged value of a tubing diameter and is noticeably simpler than using PIV. However, its accuracy can be considerably impacted by uncertainties imposed by the pressure sensor and the fluid viscosity. Furthermore, there are no well-established equations that can be used to precisely calculate the theoretical pressure loss for channels that are not circular in shape.
To avoid the aforementioned challenges, this study offers a new technique to accurately measure the averaged diameter of tubing. The inner diameter of the tubing is obtained by filling a certain length of the tube at a certain flow rate (Q) and measuring the time (∆t) it takes for the phase to shift from air to liquid. Two photodiode sensors, one meter apart, were used to determine the exact phase changing time. The following subsection outlines the detailed procedures to precisely detect the phase change. Knowing the tube length (l), phase shifting time (∆t) and the filling flow rate (Q), the tube diameter (D) can be calculated by the following equation:

In the current study, the actual diameter was measured to be 6% less than nominal diameter given by the manufacturer. It is important in this procedure to use a tube that has not been used before as any trace of liquid within the tube results in a smaller diameter than the actual value. With any cross-sectional geometry, this method can be used to precisely measure the average channel area.
2. 3. Droplet Detection
In this study, the automation of droplet recognition and related physical features such as droplet length and velocity are based on the difference in light transmission through a tube caused by phase shifting in liquid-liquid flows. In this regard, a reliable light source that delivers a steady amount of light orthogonal to the length-axis of the tubing, as well as a sensor sensitive to light intensity, are required to identify the fluctuation in transmitted light caused by phase shifting. In the current investigation, standard white LEDs with a maximum Voltage of 3.4V and a maximum current of 50mA were employed as a light source and Burr-Brown photodiodes with an integrated amplifier, model OPT301M, were utilized to detect the transmitted light with the frequency of 4 kHz. To keep system noise to a minimal level, the electrical hosing was grounded by a differential ground and shielded cables were used.
Figure 1 shows the assembly configuration of the light sensor. A holder was designed, and 3D printed from PLA to accurately locate the LED and photodiode at a specific axial location along the tube and orthogonal to the tube axis. The holder also shielded the photodiode from outside light.
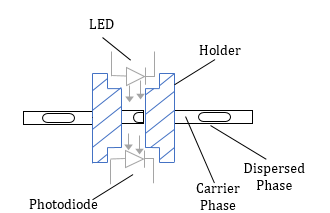
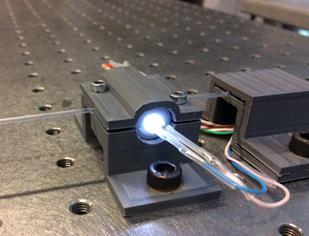
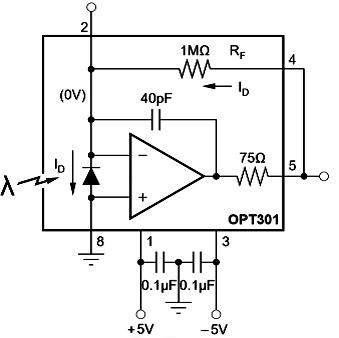
Figure 2 illustrates the general wiring setup of the photodiodes. A symmetric power source that provides a ±5V voltage range feeds the amplifier. Two different power supply units (PSU) were used to deliver a symmetric power supply. The positive output of PSU_1 is linked to the input_1 of the photodiode/amplifier, the negative exit of PSU_2 is connected to the input_3, and the short-circuit voltage level between both power supplies is connected to the input_8 of the photodiode which serves as a differential ground. Two 0.1 μF capacitors are placed between the positive/negative power supply and the grounding (see Figure 2) as recommended in the data sheet. According to this layout, the sensor's outputs are pins 2, 4, and 5 with a resistor being placed between pins 4 and 5 to change the sensors' sensitivity. Also, in order to minimize the noise level, it's critical to ground the reader's housing with a differential ground.
The photodiode only determines the amount of light being received and delivers a specific voltage in accordance with the light intensity. Therefore, a procedure is required to extract the physical characteristics of the flow from the light sensor's output voltage. An example of an output signal from the photodiode is shown in Figure 3. In this case, water and AR20 are the dispersed and continuous phases respectively with results shown for two droplets.
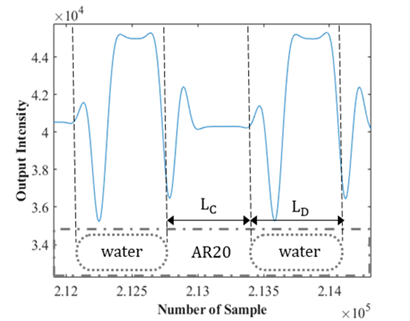
The variation in light intensity recorded by the photodiode can be attributed to two factors. The first is due to a difference in the light transmission coefficient between the fluids. In liquid-liquid flows, due to the comparable refractive indices of the liquids, the change in light transmission is expected to be minimal. The second and more important effect is the dispersion caused by light refraction and reflection at the interface between the dispersed and carrier liquids. Although this technique can be used in both liquid-liquid and liquid-gas flows, the current study focuses on liquid-liquid flows to analyse the worst-case scenario in which there is a small difference in refractive index between the liquids. In this study, two different fluid combinations, AR20-water and HFE7500-AR20, were analysed within a circular capillary with an inner diameter of 0.75mm. In AR20-water, AR20 with refractive index of 1.44 carries water droplets with refractive index of 1.33 while, in the second fluid combination, AR20 is dispersed within HFE7500 with refractive index of 1.29.
To better comprehend the signal post-processing and how droplet length was determined, Figure 4 displays a sample of the output signal from an individual water droplet as well as a schematic graph demonstrating the reflection effects.
(Ⅰ) The droplet front cap has yet to be introduced, the light is perfectly aligned, and the signal intensity remains constant.
(Ⅱ) Light reflection towards the photodiode, caused by the front cap, can explain the partial rise in light intensity. This light cannot travel through the light channel towards the photodiode in an undisturbed situation.
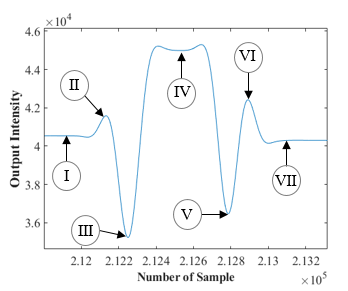
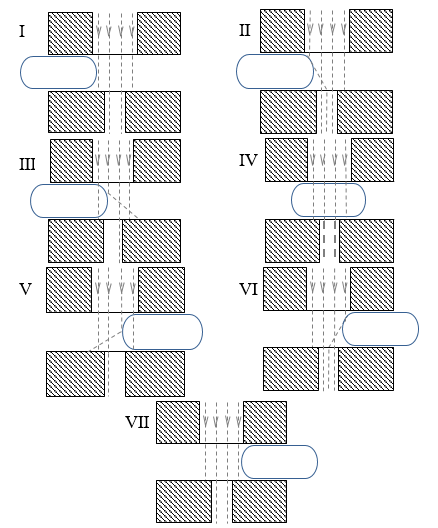
(Ⅲ) As the droplet advances, the front cap reflects a significant quantity of light that would otherwise be transmitted to the photodiode. Additionally, due to the lower refractive index of water and cap curvature, a portion of the aligned-light is deflected towards the outside of the sensor window.
(Ⅳ) Beyond the caps, when the center of the droplet is aligned with the LED and sensor, there is a difference in the voltage output compared to the carrier fluid. The difference is due to the fluid’s transparency, with water being more transparent than AR20.
(Ⅴ) Light scattering caused by the rear cap results in a lesser amount of incoming light to the photodiode.
(Ⅵ) Similar to Ⅱ, reflection effect of the rear cap on non-aligned light can explain the rise in light intensity.
(Ⅶ) Similar to (Ⅰ), the droplet has passed the light window.
The analogy to a sideward exposed hemispherical lens, which bundles or scatters light depending on the position of the light beam, explains why the cap surfaces have such a strong influence. Several images were taken using a high-speed camera from droplets of various lengths to confirm the accuracy of the signal processing.
It is also worth noting that different fluid combinations, as well as changes in the holder, tubing diameter, and light intensity, result in slightly different recorded signals. Figure 5 presents a sample of output signal from HFE7500-AR20. Unlike to the signal from AR20-water (see figure 3), when the center of the droplet is aligned with the LED and sensor, the voltage output is lower than the carrier fluid. This is due to the fluid’s transparency, with HFE7500 being more transparent than AR20.
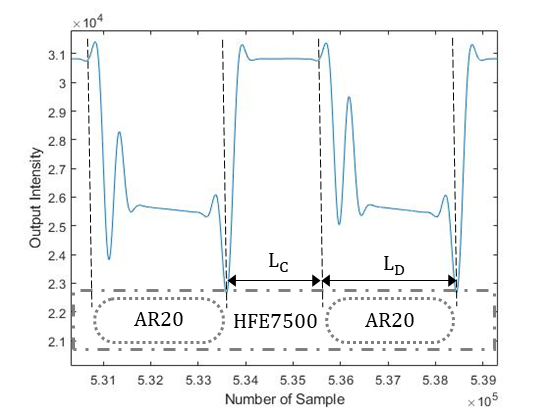
Once the front and rear caps of the droplets have been detected, the velocity of each droplet can be simply determined by measuring the time it takes for the droplet to travel from one sensor to the next when placed at a specific distance (l) apart. The elapsed time (t) is determined based on the sample frequency (f) and number of recorded samples (n). In this study, two photodiodes were set at one meter apart and data was recorded at a frequency of 4 kHz. The length of a droplet (LD) can be calculated using the droplet velocity (UD) and the time it takes for the droplet to pass a single sensor. As a result, the length of the continuous phase (LC) can be determined by knowing the times assigned to the back cap of one droplet and the front cap of the following droplet.


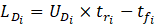

tr and tf are the times assigned to rear and front caps respectively.
A data acquisition unit was set up to collect the data from two photodiodes and a custom MATLAB code was written for post-processing of the output signal. This system setup allows for an in-line evaluation over the flow characteristics, as well as the storage of data on an SD memory card for subsequent analysis.
3. Validation of the Technique
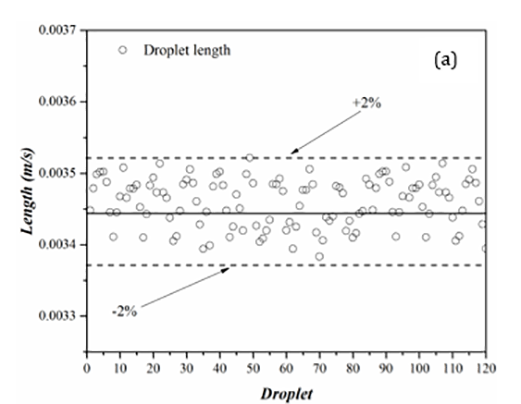
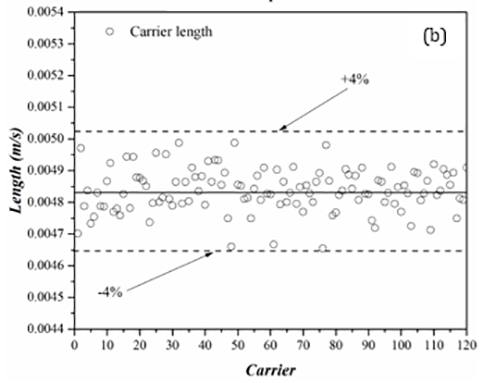
Figure 6 presents results from length measurements for the dispersed (droplet) and carrier phases for a trial with 120 water droplets in AR20. In these graphs, the solid-lines present the mean value while the dashed-lines are deviations from the mean value.
With the largest deviation from the average being 2% for the droplet (figure 6(a)) and 4% for the carrier phase (figure 6(b)), the results of the length measurements demonstrate an excellent consistency in both droplet and carrier lengths. Such low standard deviations show that the majority of the data is tightly packed around the mean value and the carrier and dispersed phases have consistent lengths. In comparison to the carrier phase, the droplet length data displays less deviations in the length measurements. During the droplet generation, the oil phase (AR20) with an almost equal and finite volume, separates the droplets from one another. As a droplet moves within a channel, depending on the flow hydrodynamics, the oil phase can travel from one side to the other side of the droplet through a thin film that separates the droplet from the capillary wall. The carrier phase length fluctuates throughout the experiment as a result of this phenomenon. A number of factors, including the presences of surfactants and pressure changes along the tubing could also intensify the fluctuations in the carrier length.
 (b)
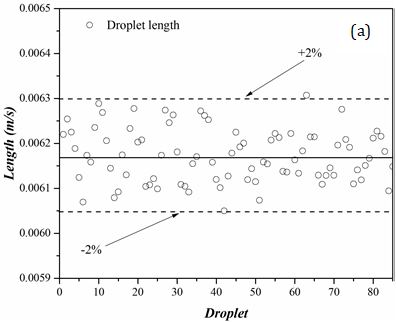
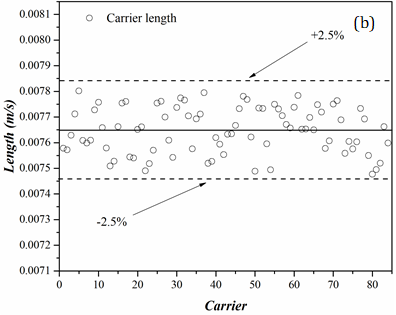
(b)Figure 7 presents results for the droplet and carrier phases of an 85-droplet train. In this example, AR20 droplets are dispersed in HFE7500. According to the data, the carrier and dispersed phases are consistent in length, and the majority of the data is tightly clustered around the mean value. Also, the carrier phase illustrates a lower maximum deviation (2.5%) in comparison to the experiment with AR20-water (4%).
4. Conclusion
This study presents a novel measurement technique to determine droplet and carrier length and velocity for slug flows within macro and micro transparent channels. This non-intrusive method provides an in-line high-frequency platform for measuring flow characteristics of two-phase flows in channels of any cross-sectional geometric shape. The measurement technique can be used for rapid in-situ experimental modifications due to its real-time nature. The contrast in index of refraction that enables the phase detection, suggests that this detector might also serve as a preliminary step for probing the chemical composition of droplets. Additionally, this methodology enables a cheap and reliable framework to determine the inner diameter of microchannels with a high precision.
5. Acknowledgements
This research is conducted with the financial support of Science Foundation Ireland (SFI) under Grant Number 13/RC/2007 through the SFI Research Centres Programme CONNECT.
References
[1] A. Abdollahi, S. E. Norris, and R. N. Sharma, "Fluid flow and heat transfer of liquid-liquid Taylor flow in square microchannels," Applied Thermal Engineering, vol. 172, p. 115123, 2020. View Article
[2] M. N. Kashid, A. Gupta, A. Renken, and L. Kiwi-Minsker, "Numbering-up and mass transfer studies of liquid-liquid two-phase microstructured reactors," Chemical Engineering Journal, vol. 158, no. 2, pp. 233-240, 2010. View Article
[3] M. T. Kreutzer, F. Kapteijn, J. A. Moulijn, and J. J. Heiszwolf, "Multiphase monolith reactors: chemical reaction engineering of segmented flow in microchannels," Chemical Engineering Science, vol. 60, no. 22, pp. 5895-5916, 2005. View Article
[4] M. M. G. Eain, V. Egan, and J. Punch, "Local Nusselt number enhancements in liquid-liquid Taylor flows," International Journal of Heat and Mass Transfer, vol. 80, pp. 85-97, 2015. View Article
[5] J. Burns and C. Ramshaw, "The intensification of rapid reactions in multiphase systems using slug flow in capillaries," Lab on a Chip, vol. 1, no. 1, pp. 10-15, 2001. View Article
[6] A. Cybulski and J. A. Moulijn, Structured catalysts and reactors. CRC press, 2005. View Article
[7] G. Qian, J. Zhou, J. Zhang, C. Chen, R. Jin, and W. Liu, "Microfiltration performance with two-phase flow," Separation and purification technology, vol. 98, pp. 165-173, 2012. View Article
[8] C. Devos, T. Van Gerven, and S. Kuhn, "A review of experimental methods for nucleation rate determination in large-volume batch and microfluidic crystallization," Crystal growth & design, vol. 21, no. 4, pp. 2541-2565, 2021. View Article
[9] M. Adampourezare, G. Dehghan, M. Hasanzadeh, and M.-A. H. Feizi, "Application of lateral flow and microfluidic bio-assay and biosensing towards identification of DNA-methylation and cancer detection: Recent progress and challenges in biomedicine," Biomedicine & Pharmacotherapy, vol. 141, p. 111845, 2021. View Article
[10] M. Seo et al., "Continuous microfluidic reactors for polymer particles," Langmuir, vol. 21, no. 25, pp. 11614-11622, 2005. View Article
[11] A. Huebner et al., "Development of quantitative cell-based enzyme assays in microdroplets," Analytical chemistry, vol. 80, no. 10, pp. 3890-3896, 2008. View Article
[12] T. Thorsen, R. W. Roberts, F. H. Arnold, and S. R. Quake, "Dynamic pattern formation in a vesicle-generating microfluidic device," Physical review letters, vol. 86, no. 18, p. 4163, 2001. View Article
[13] S. L. Anna, N. Bontoux, and H. A. Stone, "Formation of dispersions using "flow focusing" in microchannels," Applied physics letters, vol. 82, no. 3, pp. 364-366, 2003. View Article
[14] H. Song and R. F. Ismagilov, "Millisecond kinetics on a microfluidic chip using nanoliters of reagents," Journal of the American Chemical Society, vol. 125, no. 47, pp. 14613-14619, 2003. View Article
[15] D. R. Link et al., "Electric control of droplets in microfluidic devices," Angewandte Chemie International Edition, vol. 45, no. 16, pp. 2556-2560, 2006. View Article
[16] E. Weber, D. Puchberger-Enengl, F. Keplinger, and M. J. Vellekoop, "In-line characterization and identification of micro-droplets on-chip," Optofluidics, vol. 1, no. 2013, pp. 11-18, 2013. View Article
[17] P. K. Isgor, M. Marcali, M. Keser, and C. Elbuken, "Microfluidic droplet content detection using integrated capacitive sensors," Sensors and Actuators B: Chemical, vol. 210, pp. 669-675, 2015. View Article
[18] Y. Gu and A. C. Fisher, "An ac voltammetry approach for the detection of droplets in microfluidic devices," Analyst, vol. 138, no. 16, pp. 4448-4452, 2013. View Article
[19] M. Robert de Saint Vincent, S. Cassagnère, J. Plantard, and J.-P. Delville, "Real-time droplet caliper for digital microfluidics," Microfluidics and nanofluidics, vol. 13, no. 2, pp. 261-271, 2012. View Article
[20] S. Jakiela, S. Makulska, P. M. Korczyk, and P. Garstecki, "Speed of flow of individual droplets in microfluidic channels as a function of the capillary number, volume of droplets and contrast of viscosities," Lab on a Chip, vol. 11, no. 21, pp. 3603-3608, 2011. View Article
[21] T. Sun and H. Morgan, "Single-cell microfluidic impedance cytometry: a review," Microfluidics and Nanofluidics, vol. 8, no. 4, pp. 423-443, 2010. View Article
[22] X. Niu, M. Zhang, S. Peng, W. Wen, and P. Sheng, "Real-time detection, control, and sorting of microfluidic droplets," Biomicrofluidics, vol. 1, no. 4, p. 044101, 2007. View Article
[23] C. Berggren, B. Bjarnason, and G. Johansson, "Capacitive biosensors," Electroanalysis: An International Journal Devoted to Fundamental and Practical Aspects of Electroanalysis, vol. 13, no. 3, pp. 173-180, 2001. View Article
[24] W. P. Eaton and J. H. Smith, "Micromachined pressure sensors: review and recent developments," Smart Materials and Structures, vol. 6, no. 5, p. 530, 1997. View Article
[25] E. Walsh, Y. Muzychka, P. Walsh, V. Egan, and J. Punch, "Pressure drop in two phase slug/bubble flows in mini scale capillaries," International Journal of Multiphase Flow, vol. 35, no. 10, pp. 879-884, 2009. View Article