Journal of Fluid Flow, Heat and Mass Transfer (JFFHMT)
ISSN: 2368-6111

Volume 9 - Year 2022 - Pages 148-156
DOI: 10.11159/jffhmt.2022.018
Experimental Study of Flow Boiling Heat Transfer at Low Heat Fluxes
Ernest Gyan Bediako1*, Petra Dancova1, Tomas Vit1
1Technical University of Liberec
Department of Power Engineering Equipment, Faculty of Mechanical Engineering, Technical University of Liberec, 461 17 Liberec, Czech Republic
ernest.gyan.bediako@tul.cz ; petra.dancova@tul.cz, tomas.vit@tul.cz
Abstract - This study presents an experimental investigation of heat transfer characteristics at low heat flux conditions. The focus is to compare experimental findings with qualitative descriptions of heat transfer coefficient reported in literature. The study also compares the experimental results with 3 correlations developed based on different theories. For the experimental conditions, R134a was the refrigerant used, heat fluxes ranged from 4.6-8.5 kW/m2 and mass flux from 200-300 kg/m2s. The experimental heat transfer coefficient results were also compared with Wojtan et al flow patterns map to determine the flow patterns observed during the study.
In covering heat transfer coefficient over a broad range of vapor qualities, the findings revealed that, the qualitative descriptions proposed by different authors do not entirely validate the actual representation of heat transfer coefficient within the experimental conditions considered. At vapor qualities around zero (0), heat transfer coefficient rises to a maximum peak and decreases to a local minimum before increasing as vapor quality increases until it reaches dry-out. The flow pattern predicted are slug flow at low vapor-quality region, intermittent flow at mid vapor quality region and annular, dry-out and mist flow at high vapor quality region.
None of the flow boiling correlations considered in this study was able to accurately predict the heat transfer data within a mean absolute error (MAE) of ± 30%.
Keywords: heat transfer coefficient, mass flux, heat flux, vapor quality, flow pattern.
© Copyright 2022 Authors - This is an Open Access article published under the Creative Commons Attribution License terms Creative Commons Attribution License terms. Unrestricted use, distribution, and reproduction in any medium are permitted, provided the original work is properly cited.
Date Received: 2022-09-20
Date Accepted: 2022-10-15
Date Published: 2022-10-23
1. Introduction
For some years now, flow boiling heat transfer has remained an important area of research due to its relevance in thermal management systems.[1],[2]. Understanding flow boiling heat transfer phenomenon helps to accurately determine and predict heat transfer coefficient, pressure drop, flow patterns and the predominant mechanisms controlling the heat transfer process. It also helps to optimally design thermal management systems.
Two mechanisms are generally considered to influence heat transfer during flow boiling. These are convective boiling and nucleate boiling. These mechanisms are related to heat transfer coefficient and flow patterns significantly [3], [4].
Because of the relevance of heat transfer coefficient [5], several qualitative descriptions and maps of flow regimes spanning from subcooled liquid region to superheated vapor region have been proposed by different authors. Popular among these descriptive maps are Collier (1981), Collier and Thome (1994) and Kandlikar (1991) [6]– [8]. According to Barbosa (2005) [9] and Hewitt (2000) [10] these descriptions have been the basis for design calculation and formulation of various flow boiling correlation for many years. Because of the relevance of this parameter, various flow regimes and transition schemes have been suggested by different authors to represent the characteristics of this parameter during flow boiling under different conditions. These suggested descriptions and maps of flow boiling heat transfer coefficient have been employed in the development of predictive tools and for the understanding of heat transfer phenomena as fluid flows within a heated tube. According to Kandlikar (1991) [7], qualitative descriptions of flow boiling provide an important guide to represent the complex interrelations among variables that control heat transfer in different regions.
Collier (1981) [6] developed a qualitative description of flow boiling heat transfer for a single value of mass flux at low pressures. Kandlikar (1991) [7] challenged the description of flow regime map developed by Collier (1981) in that, according Collier (1981), heat transfer coefficient for vapor quality below zero (0) region is assumed to be a linear increase. According to Kandlikar (1991), the linear increase is not an accurate representation of heat transfer coefficient in the negative quality region. He also tested the validity of Collier’s schematic representation of heat transfer coefficient from vapor quality of zero (0) to one (1). He observed that, the trend of constant heat transfer coefficient in the nucleate boiling regime and an ever-increasing heat transfer coefficient with vapor quality for convective boiling is not entirely accurate. Kandlikar (1991) developed a flow boiling schematic description and map for heat transfer coefficient from negative quality to vapor quality of 0.8. His work considered varying parameters such as heat flux and mass flux which was not the case of Collier (1981) and Collier and Thome (1994) where only the effect of heat flux was considered. However, the schematic description of heat transfer coefficient by Kandlikar (1991) does not consider the effect of critical heat flux and dryout conditions.
Although several authors have adopted these descriptive flow boiling maps and mostly within vapor quality of zero and one, no experimental studies to the best of the authors knowledge, have been reported for heat transfer coefficient from subcooled region through two-phase saturation to superheated vapor region, with the goal of validating qualitative descriptions of flow boiling as described above upon which several theories and predictions have been developed.
Several correlations are reported in literature for predicting flow boiling heat transfer in small diameter tubes which indicates the lack of consensus on the actual mechanism responsible for controlling the heat transfer [11]. These correlations are designed on the basis of different theories with many adjusting parameters and assumptions [12]. Fang (2013) [13] evaluated different correlations for flow boiling heat transfer in horizontal smooth tubes and concluded that most of the available correlations in literature inaccurately predict experimental data investigated for different combinations of saturation conditions, mass fluxes, heat fluxes and vapor qualities.
The main goal of this research is to experimentally study the entire flow boiling process of R134a refrigerant in a single horizontal circular stainless-steel smooth tube with an internal diameter of 5 mm and validate the results with descriptive models proposed for flow boiling under low heat fluxes which finds its application in refrigeration systems. Flow patterns observed are predicted with Wojtan et al. map. Statistical analysis on the performance of three correlations selected on the basis of pool boiling theory (Cooper) and asymptotic theory (Liu and Winterton, and Wattalete et al.) was performed on the experimental data.
2.0 Experimental Set-Up And Method
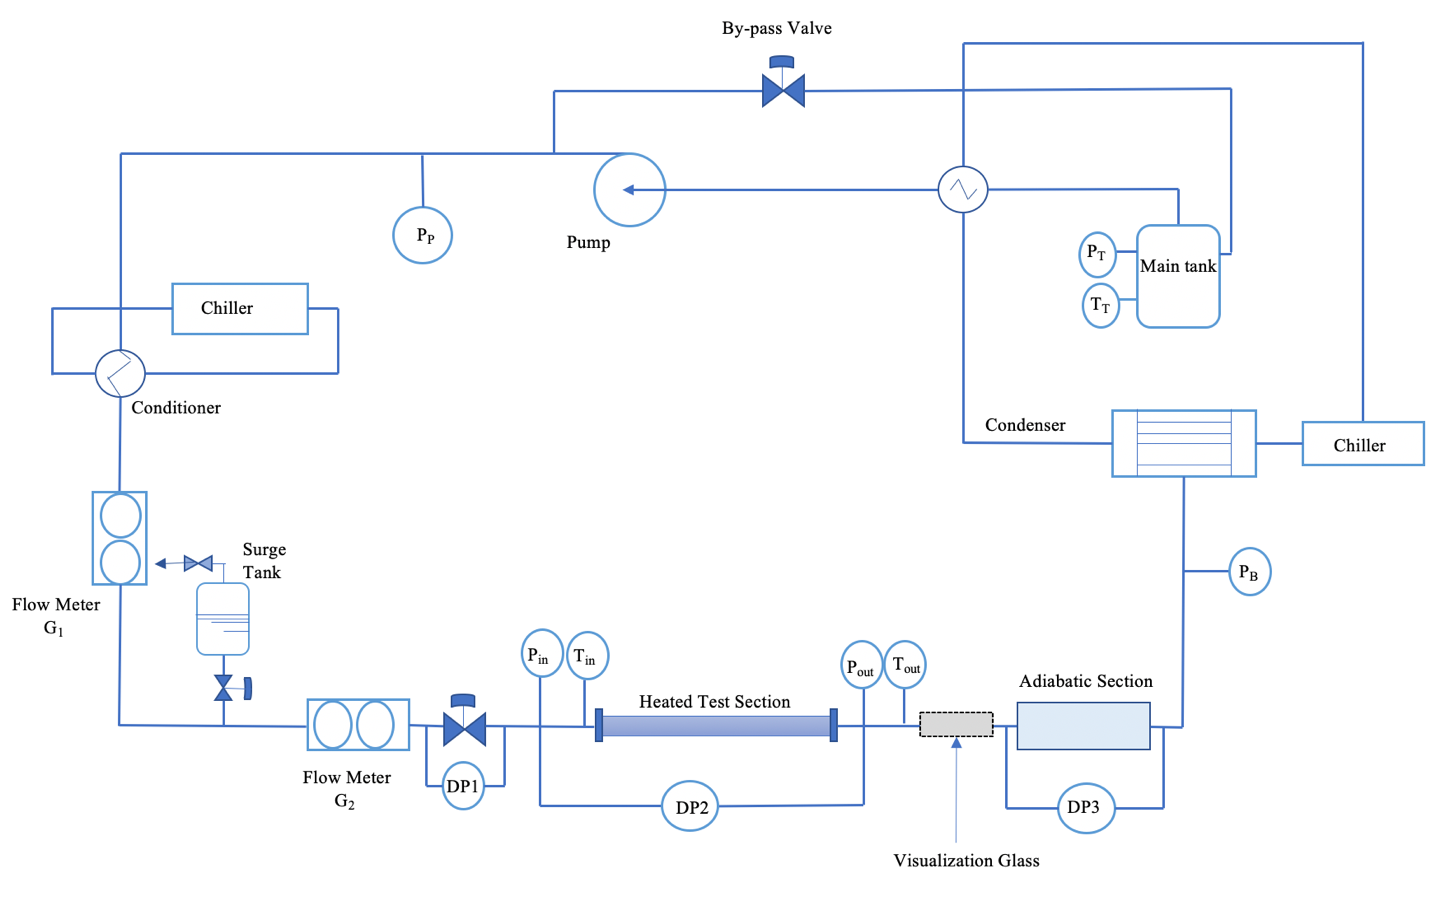
The experimental study was conducted at the Two-Phase Flow Instability facility of Norwegian University of Science and Technology (NTNU). Figure 1 represents the experimental test rig for this study. It is a closed loop system that consist of a condenser, a pump, a horizontal glass test section, a Coriolis flow meter for measuring flow rate, a visualization glass and a tank with R134a refrigerant. The saturation conditions of the tank are adjusted to control the pressure whereas a shell and tube type heat exchanger is used to control the inlet temperature of the working fluid. The test section has a length of 2035 mm, internal diameter of 5 mm and an outer diameter of 8 mm. It is divided into 5 sections where each section can be heated by joule’s effect independently. A controller and a rectifier circuit convert the AC power to the test section into DC. The voltage and the current supplied to the heated section is used to calculate the total power input. To avoid heat losses, proper insulation was applied to the outer surface of the test section. Seventeen (17) thermocouples are fixed at bottom and upper part of the outside wall of the tube. For internal flow temperature within the tube, another set of thermocouples are fixed at top, bottom and sidewalls at locations 1117 mm and 1917 mm. LabVIEW National Instrument data acquisition system was used to record the experimental data. All measurement variables were recorded at a frequency of 10Hz.
For recording the experimental data, the facility is heated up to a desired power. When the desired power is reached, each data is recorded by decreasing the applied electrical heat input systematically. This process avoids a jump in the wall temperature at the onset of nucleate boiling and ensures that the experiment can be repeated for the same conditions studied.
2.1 Data Reduction
Due to heat losses, the applied heat may differ from the electrical power input. The heat losses may be generated by convection or conduction through the surrounding, through cables and even through the thermocouples installed. By accounting for the heat losses, the total heat supplied is given by:

where V is voltage, I is the current supplied and Qloss is the heat loss obtained during calibration
The heat flux is thus obtained by:

where q" is the heat flux, di is the inner diameter and L is the length of the heated section of the tube.
Because the diameter of the tube is small, it is difficult to take direct temperature readings from the inner wall. Therefore, the temperature on the outer wall diameter of the tube is recorded and a correction factor of the thermal resistance of the pipe is applied. The correction is considered by applying heat conduction equation on a cylindrical wall for a constant heat flux. The temperature distribution after the correction is given by:
where Tdo (x) is the outer wall temperature, do and di are the outer and inner wall diameters respectively, kglass is the thermal conductivity of the glass.
From the balance of energy in the tube, the temperature of the fluid is given by:
here, Tfluid,inlet is the inlet temperature of the fluid, is the mass flow rate and cp is the specific heat.
The temperature of the fluid is assumed equal to the saturation temperature for instances where two phase flow occurs in the heater.
The local heat transfer coefficient is then calculated as:
2.2 Data Validation
The reliability of the experimental facility was conducted by comparing single phase heat transfer coefficient data from the facility with Dittus Beolter correlation which is given as:

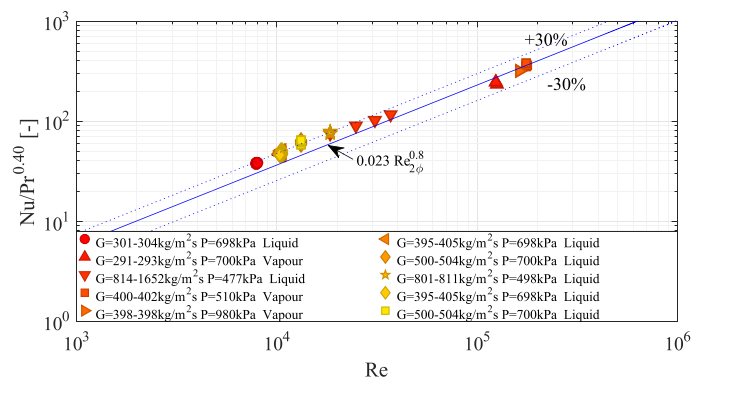
Here, Nu represents Nusselt number, Re represents Reynolds number and Pr represents Prandtl number. It can be observed in Figure 2 below that, the single-phase heat transfer results were well predicted within a margin of ±30%.
3.0 Results and Discussion
In order to validate the qualitative description of heat transfer coefficient proposed by different authors and the flow patterns observed, a plot of experimental heat transfer coefficient as function of vapor quality and the flow patterns observed as predicted by Wojtan et al is shown in Figures 3-6 below.
In Figure 3, for mass flux of 200 kg/m2s and heat flux of 4.6kW/m2, the trend of heat transfer coefficient increases from the subcooled region to a maximum peak near vapor quality of zero. As vapor quality increases further, the heat transfer coefficient deteriorates to a local minimum before it begins to increase again until dryout is reached where the heat transfer coefficient sharply deteriorates to a bare minimum. For this low heat flux condition, the flow patterns observed as predicted by Wojtan et al are slug at low vapor qualities, intermittent flow patterns (between 0.2<x<0.34), annular flow pattern (between 0.34<x<0.98) and dryout and mist flow pattern beyond vapor qualities of one (1).
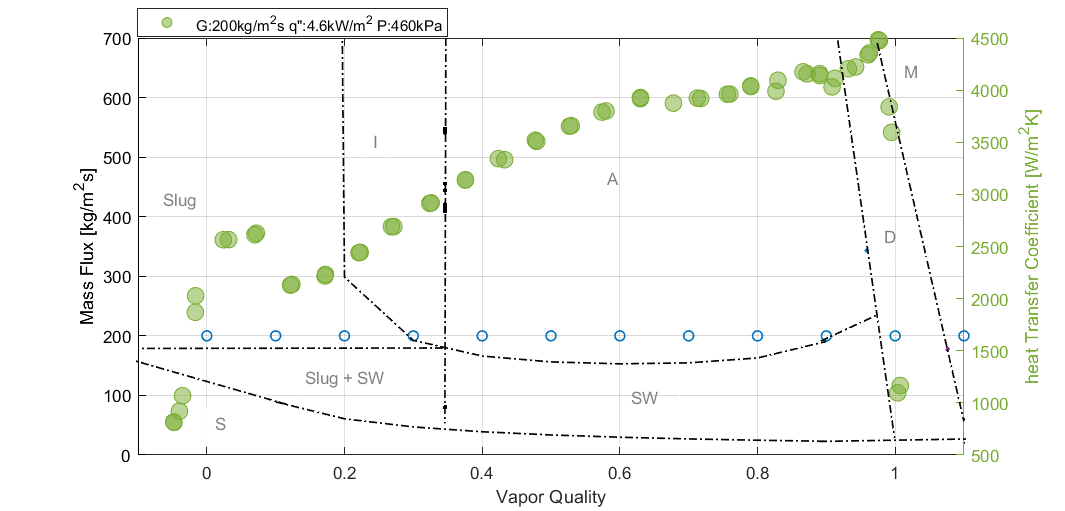
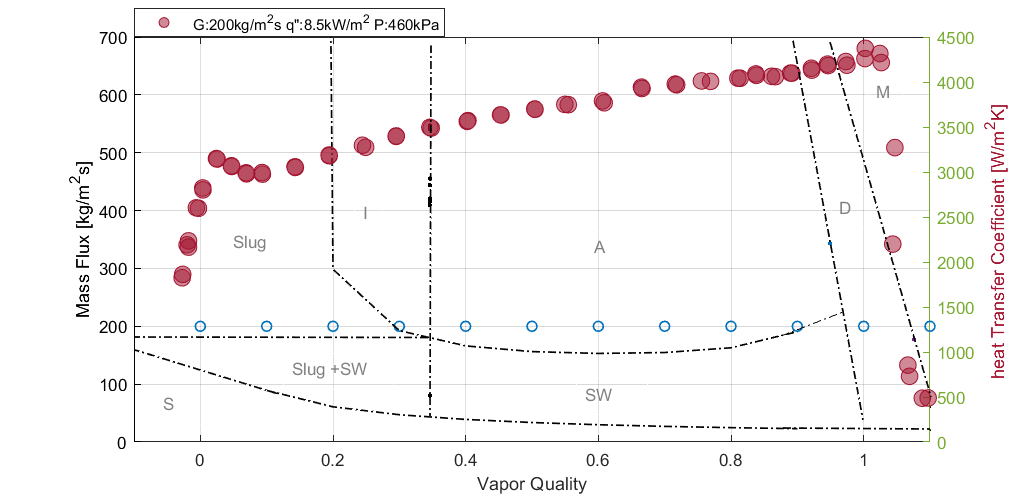
Figure 4, depicts the trend of heat transfer coefficient behavior for mass flux of 200 kg/m2s but with an increase in heat flux to 8.5 kW/m2. With similar trend to Figure 3, heat transfer coefficient increases to a maximum peak. As vapor quality increases, the heat transfer coefficient deteriorates slightly to a minimum before increasing steadily until dryout is reached where the HTC declines to a minimum. The flow patterns observed are slug flow in the low vapor quality region, intermittent and annular as vapor quality increases. At higher vapor quality around 0.9 and beyond 1, the observed flow patterns are dryout and mist flow as predicted by Wojtan et al.
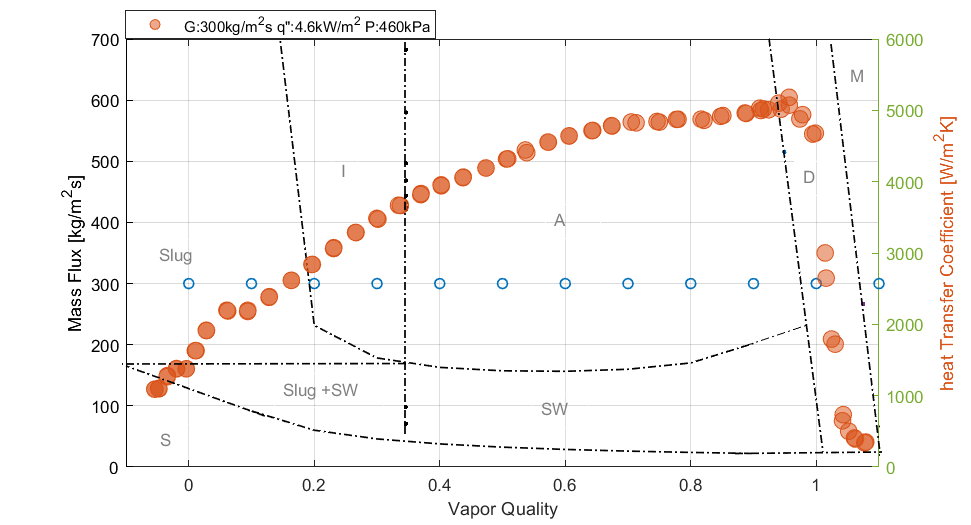
In Figure 5, for an increased mass flux of 300 kg/m2s but a low heat flux of 4.6 kW/m2, the heat transfer coefficient increases steadily over wide range of vapor qualities until dryout is reached where the heat transfer coefficient sharply deteriorates. For this condition, there was no observed sharp rise of heat transfer coefficient at near zero vapor quality. There was no observed decline of heat transfer coefficient as depicted in the other figures. The flow patterns observed as predicted by Wojtan et al were slug, intermittent, annular, dryout and mist flow as the vapor quality increases.
In Figure 6, at mass flux of 300 kg/m2s for an increased heat flux of 8.5 kW/m2; heat transfer coefficient increases from subcooled region to a peak at near zero vapor quality. The heat transfer coefficient then deteriorates slightly to a minimum as vapor quality further increases. After the local minimum, the heat transfer coefficient increases steadily until dryout is reached at high vapor qualities. The flow patterns observed as predicted by Wojtan et al were slug flow at low vapor qualities, intermittent at vapor qualities between 0.2 and 0.34, annular flow between vapor quality of 0.34 to 0.99. Beyond this range is dryout and mist flow.
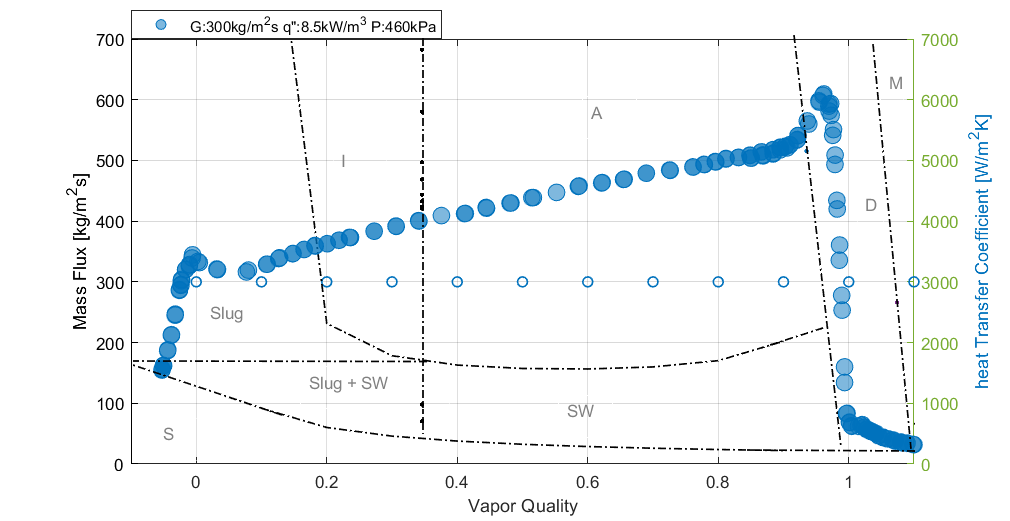
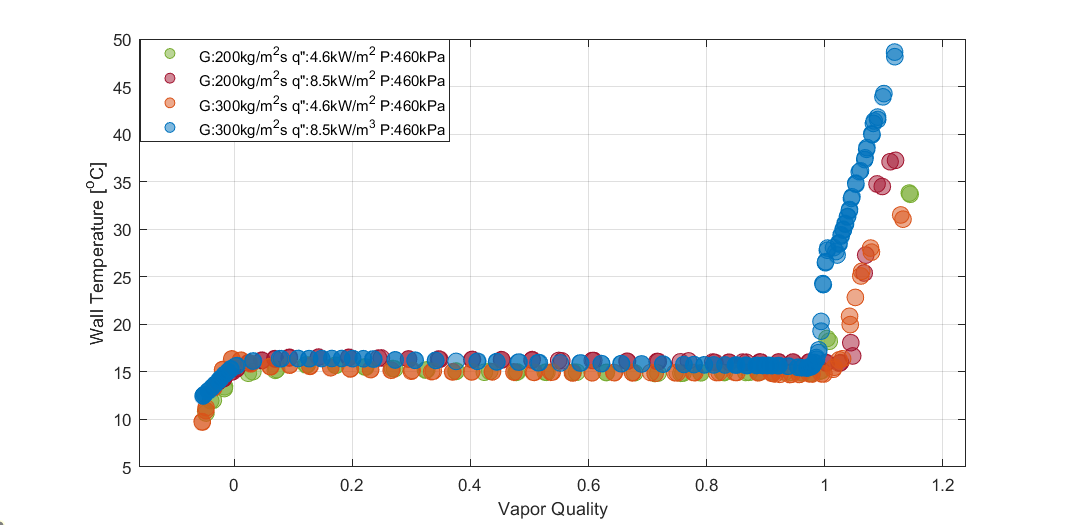
Figure 7 shows a change of inner wall temperature as a function of vapor quality during the boiling process for all the experimental conditions described in figures 3-6 above. The temperature of the wall increases in the subcooled region region until saturation begins. As vapor quality increases, the temperature of inner tube gradually decreases slightly until dryout is reached. After the dryout, the wall temperature abruptly rises.
3.1 Comparison of experimental heat transfer coefficient results with qualitative description of heat transfer coefficient
The experimental heat transfer coefficient results were compared and validated with qualitative description of heat transfer coefficient by Collier and Thome [8] and Kandlikar [7]. The first departure of our results from qualitative description of heat transfer coefficient at low heat flux conditions was the occurrence of heat transfer coefficient peaks near zero vapor quality region as observed figures 3,4 and 5. These peaks were not indicated and described by the classical description of Collier, Collier and Thome and Kandlikar in their flow boiling maps for similar conditions. Interestingly, these near zero vapor quality peaks were also observed in the experimental study by Kandlbinder (1997) and Urso et al (2002) [14], [15] for vertical tubes at similar low heat flux and pressure conditions. A possible explanation for the observed peak in heat transfer coefficient near zero vapor quality, is that, during flow boiling, as the liquid is being heated in the subcooled region, poor vapor nucleation as a result of low heat flux causes the tube walls and the fluid adjacent to it to heat up gradually. Because of this, once initial bubbles nucleate, they expand quickly and transfer the heat energy within the liquid around to the bulk liquid flow. This thus causes an increased formation of vapor as a result of the gradual overheat of the walls and the fluid around it and thus enhancing high heat transfer coefficient.
The second departure of qualitative description of heat transfer coefficient at low heat flux and pressure conditions from our experimental results is the decrease in heat transfer coefficient in the nucleate boiling region with quality after the near zero peak. According to Collier and Thome, this region of nucleate boiling dominance in the low vapor quality region is a trend of constant heat transfer coefficient. This was not the case in our experiment since we observed a deterioration in the heat transfer coefficient to a minimum peak before an increasing trend. Similar deterioration of heat transfer coefficient at low quality was reported by Barbosa (2005), Kandlbinder (1997) [14], [16].
Another deviation observed was the characteristics of heat transfer coefficient at high quality regions before dryout incipience. In this region, the heat transfer coefficient increases sharply to a maximum before a sudden decline (as seen in figure 3 and 6) or the heat transfer coefficient declines sharply to dryout without a sharp rise in the dryout incipience (as seen in figure 2 and 4). These characteristics of the dryout incipience is not described by the classical qualitative descriptions by various authors.
Assessment of Experimental results with 3 correlations
Statistical assessment was performed by comparing the experimental results with three different correlations developed on the basis of pool boiling and asymptotic theories.
Table 1 summarizes the comparison results where MRE is the mean relative error, MAE is the mean absolute error calculated by:

hpred and hexp are the predicted and experimental heat transfer coefficient respectively. N is the number of data points collected.
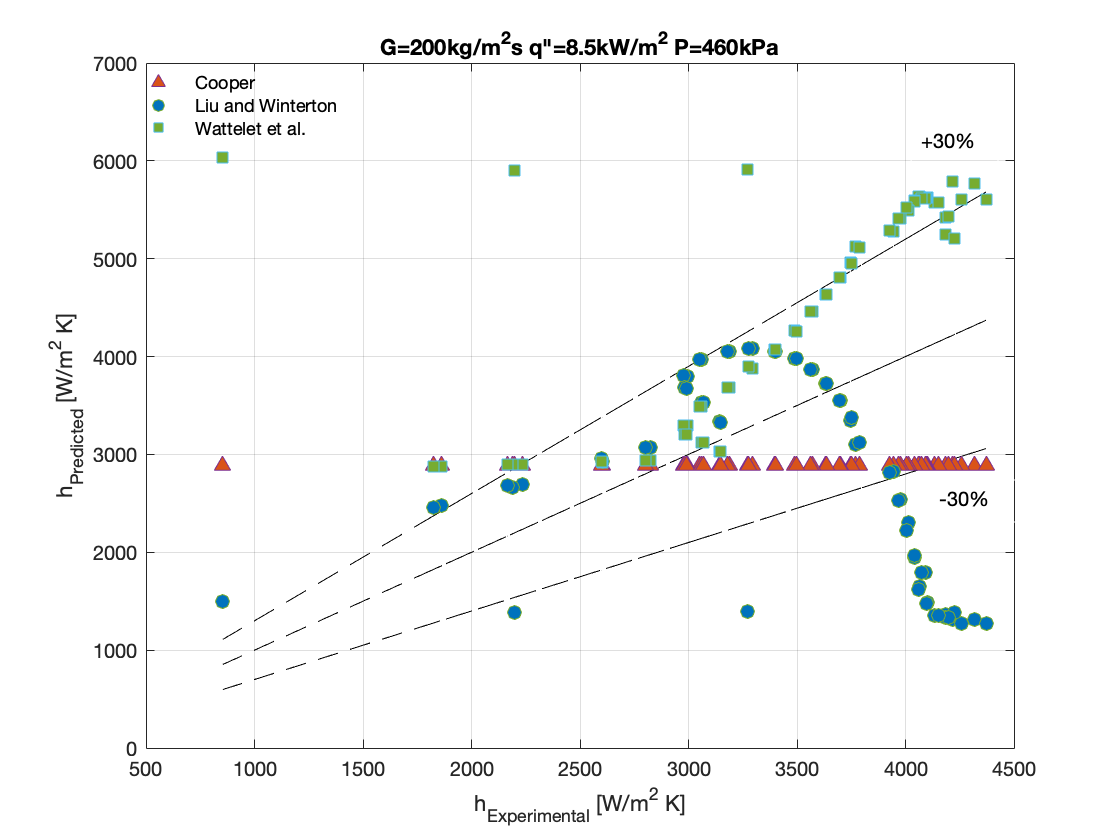
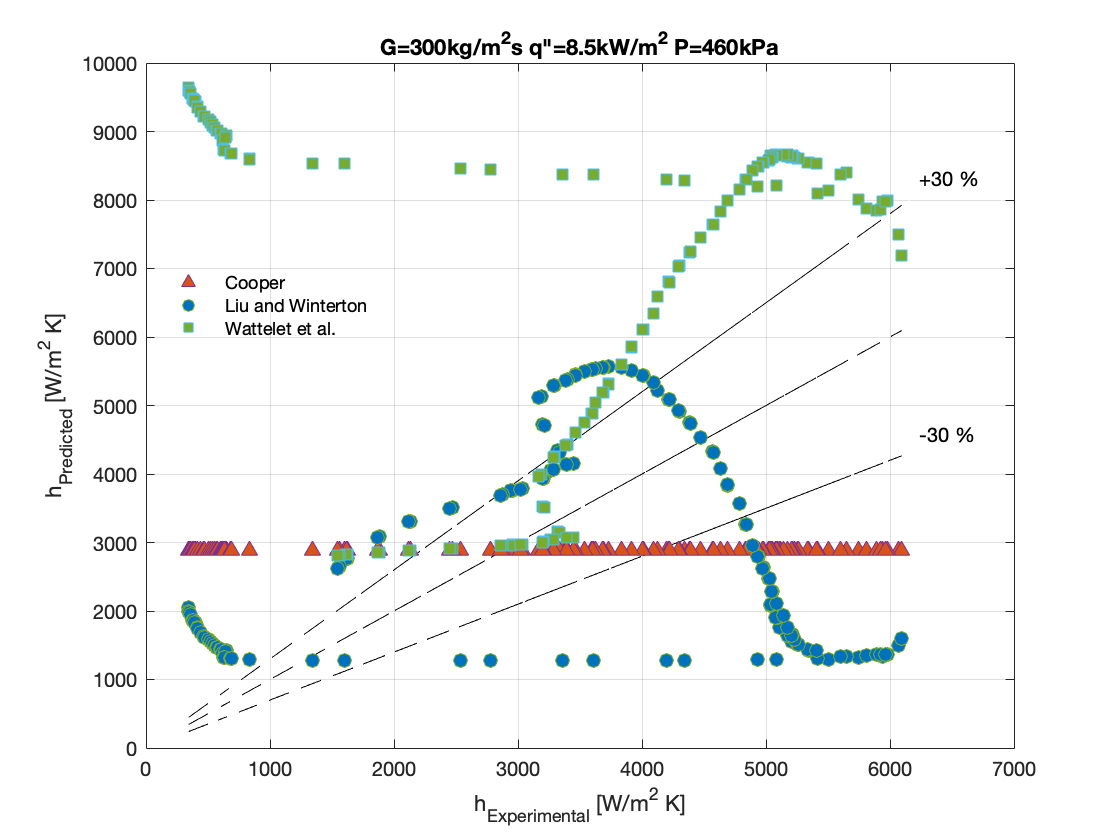
Figure 8a-8d show the graphical representation of the comparison between each experimental result and the calculated heat transfer coefficient developed based on different theoretical assumptions.
It can be observed that, apart from the correlation of Liu and Winterton that was able to predict the experimental data at conditions of mass flux (G) 200kg/m2s, heat flux (q”) 4.6kW/m2 and saturation pressure of 460 kPa with a MAE of 7.2869 %, the correlations could not accurately predict the rest of the experimental data below 30%.
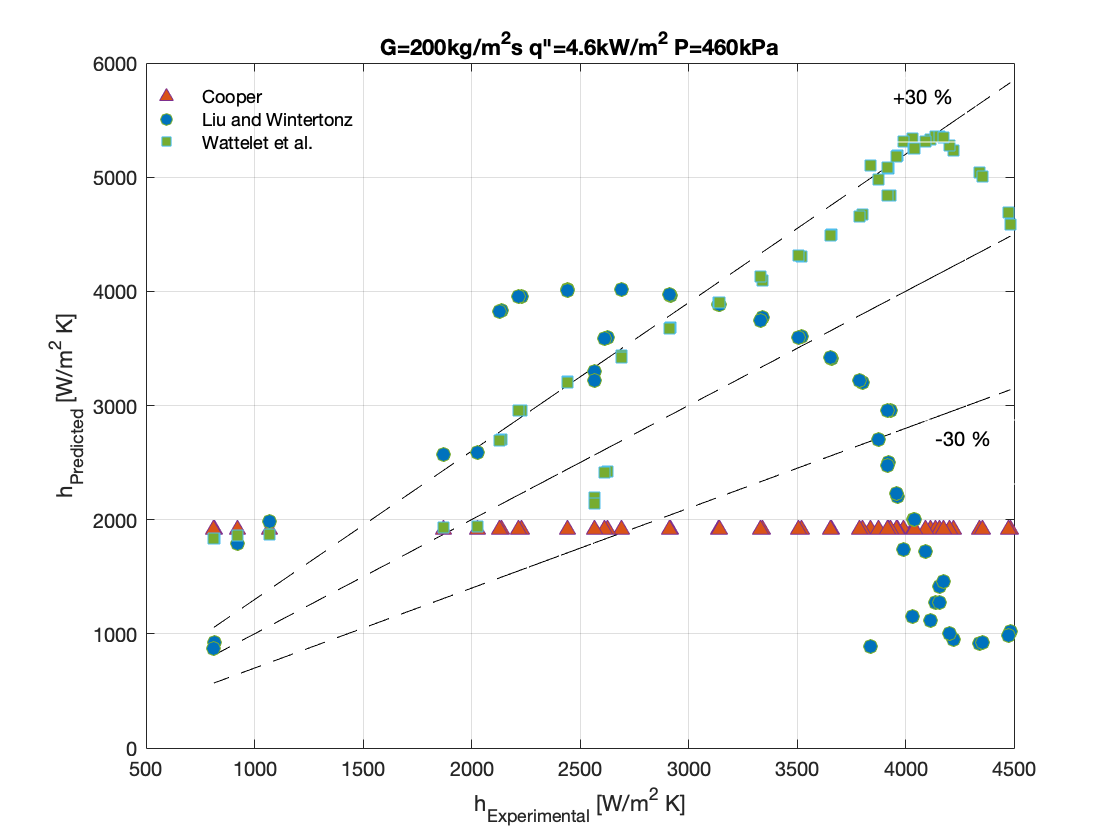
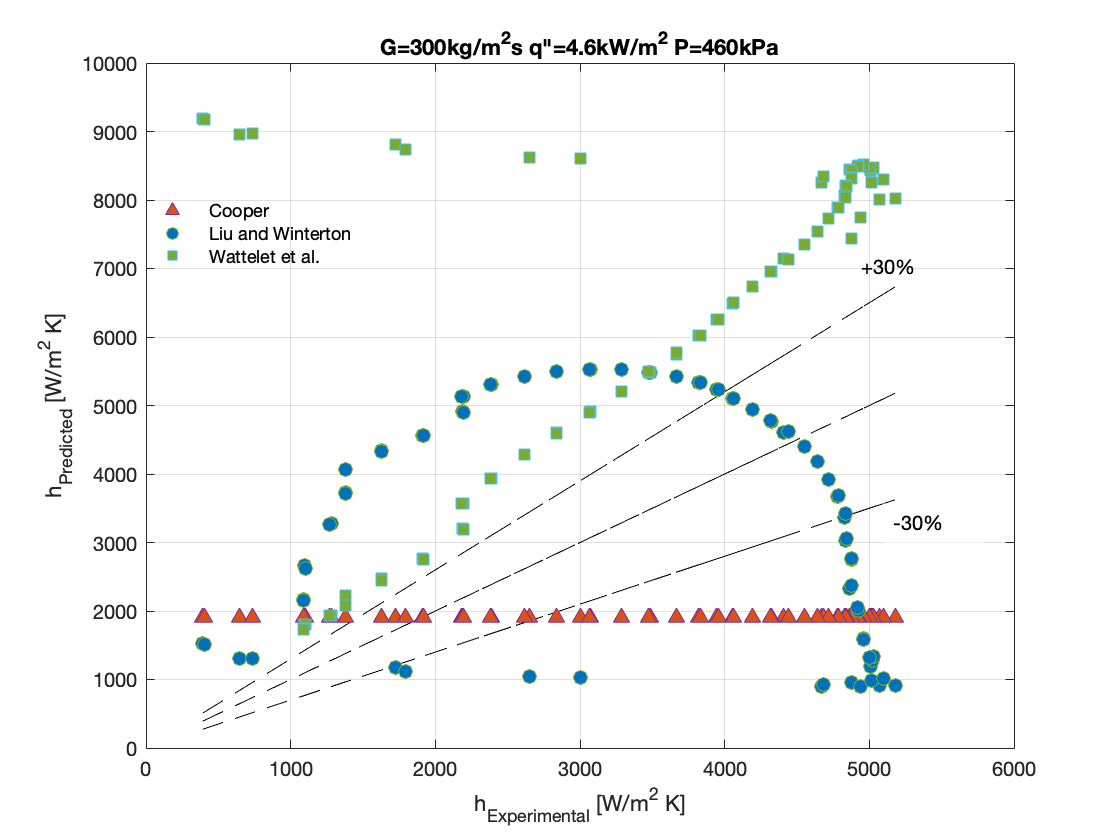
Table 1: Summary of statistical assessment of experimental results and predicted results
|
Experimental Condition
|
P460kPa G200 kg/m2s q”4.6 kW/m2 |
P460 kPa G200 kg/m2s q”8.5 kW/m2
|
P460 kPa G300 kg/m2s q”4.6 kW/m2
|
P460kPa G300 kg/m2s q”8.5kW/m2
|
All data at 460kPa |
|
|
Cooper |
MRE % |
-29.668 |
-9.4698 |
-17.735 |
89.801 |
8.2321 |
|
MAE % |
134.91 |
57.939 |
75.198 |
86.242
|
88.5722 |
|
|
Liu and Winterton |
MRE % |
-6.8746 |
-13.655 |
35.38 |
44.611 |
14.8653 |
|
MAE % |
7.2869 |
34.776 |
96.866 |
69.717 |
52.1615
|
|
|
Wattelet et al |
MRE % |
28.12 |
38.064 |
151.11 |
434.36 |
162.9135 |
|
MAE % |
126.03 |
57.829 |
64.447 |
81.861
|
297.5765 |
|
5. Conclusion
In this paper, experimental results of heat transfer coefficient during flow boiling of R134a at low heat fluxes (4.6 – 8.5 kW/m2) which finds its application in refrigeration systems was investigated and compared with classical descriptions of heat transfer coefficient upon which many theories and design calculations are based. The observed flow patterns were predicted with Wojtan et al. flow pattern map. The experimental findings were compared with three correlations developed based on pool boiling and asymptotic theories formulated by Cooper, Liu and Winterton and Wattalete. The major findings of this study are:
- At low heat flux conditions studied, there is an observance of a local peak near zero vapor quality which is not described by the classical qualitative description of heat transfer coefficient by Collier and Thome and that of Kandlikar. The heat transfer slightly decreases to a minimum before increasing as vapor quality increases.
- The flow pattern observed in this low vapor quality region is slug where nucleate boiling dominates the heat transfer.
- The decrease in heat transfer coefficient to a local minimum is not described by classical descriptions of heat transfer coefficient for the conditions studied
- Generally, the major flow patterns predicted by Wojtan et al for the studied conditions are slug, intermittent, annular, dryout and mist flow
- The correlations assessed could not accurately predict the entire experimental data investigated with enough accuracy
Acknowledgements
This research was funded by SGS project at the Technical University of Liberec with grant number SGS 20225007
References
[1] S. Mortada, A. Zoughaib, C. Arzano-Daurelle, and D. Clodic, "Boiling heat transfer and pressure drop of R-134a and R-1234yf in minichannels for low mass fluxes," International Journal of Refrigeration, vol. 35, no. 4, pp. 962-973, 2012, doi: 10.1016/j.ijrefrig.2012.03.004. View Article
[2] K. W. Hwang, D. E. Kim, K. H. Yang, J. M. Kim, M. H. Kim, and H. S. Park, "Experimental study of flow boiling heat transfer and dryout characteristics at low mass flux in helically-coiled tubes," Nuclear Engineering and Design, vol. 273, pp. 529-541, 2014, doi: 10.1016/j.nucengdes.2014.03.046. View Article
[3] R. Charnay, "Experimental study of flow boiling in horizontal minichannels at high saturation temperature," 2015.
[4] C. Romain, "EXperimental Study of Flow Boiling in Horizontal," 2014.
[5] A. J. N. Khalifa, "Natural convective heat transfer coefficient - a review: I. Isolated vertical and horizontal surfaces," Energy Convers Manag, vol. 42, no. 4, pp. 491-504, Mar. 2001, doi: 10.1016/S0196-8904(00)00042-X. View Article
[6] J. G. Collier, "Convective Boiling and Condensation ," McGraw-Hill, Maidenhead, United Kingdom, 1981.
[7] S. G. Kandlikar, "Development of a flow boiling map for suboooled and saturated flow boiling of different fluids inside circular tubes," J Heat Transfer, vol. 113, no. 1, pp. 190-200, 1991, doi: 10.1115/1.2910524. View Article
[8] "Convective Boiling and Condensation - John G. Collier, John R. Thome - Google Books."(accessed Oct. 26, 2021). View Article
[9] J. R. Barbosa, "Two-phase non-equilibrium models: The challenge of improving phase change heat transfer prediction," Journal of the Brazilian Society of Mechanical Sciences and Engineering, vol. 27, no. 1, pp. 31-45, 2005, doi: 10.1590/s1678-58782005000100003. View Article
[10] G. F. Hewitt, "DEVIATIONS FROM CLASSICAL BEHAVIOUR IN VERTICAL CHANNEL CONVECTIVE BOILING," Multiphase Science and Technology, vol. 13, no. 3 & 4, pp. 161-190, 2001, doi: 10.1615/MULTSCIENTECHN.V13.I3-4.60. View Article
[11] M. M. Mahmoud and T. G. Karayiannis, "International Journal of Heat and Mass Transfer Heat transfer correlation for flow boiling in small to micro tubes," Int J Heat Mass Transf, vol. 66, pp. 553-574, 2013, doi: 10.1016/j.ijheatmasstransfer.2013.07.042. View Article
[12] R. Charnay, R. Revellin, and J. Bonjour, "Flow boiling heat transfer in minichannels at high saturation temperatures: Part II - Assessment of predictive methods and impact of flow regimes," Int J Heat Mass Transf, vol. 87, pp. 653-672, 2015,doi:10.1016/j.ijheatmasstransfer.2015.03.080. View Article
[13] X. Fang, "A new correlation of flow boiling heat transfer coefficients based on R134a data," Int J Heat Mass Transf, vol. 66, pp. 279-283, 2013, doi: 10.1016/j.ijheatmasstransfer.2013.07.015. View Article
[14] T.Kandlbinder,"EXPERIMENTAL INVESTIGATION OF FORCED AND BOILING OF HYDROCARBONS MIXTURES," no. November, 1997.
[15] M. Urso, … V. W.-I. H. T., and undefined 2002, "Flow boiling at low mass flux," ihtcdigitallibrary.com, Accessed: Oct. 31, 2021. [Online].Available: View Article
[16] M. Wettermann and D. Steiner, "Flow boiling heat transfer characteristics of wide-boiling mixtures," International Journal of Thermal Sciences, vol. 39, no. 2, pp. 225-235, Feb. 2000, doi: 10.1016/S1290-0729(00)00241-6. View Article