Journal of Fluid Flow, Heat and Mass Transfer (JFFHMT)
ISSN: 2368-6111

Volume 9 - Year 2022 - Pages 10-22
DOI: 10.11159/jffhmt.2022.002
Flow Resistance of Randomly Packed Beds of Crushed Rock and Ellipsoidal Particles using CFD
Jaap Hoffmann1, Tapiwa Manatsa1, Jeroen Houtappels2
1Stellenbosch University, Department of Mechanical & Mechatronic Engineering
c/o Banhoek Road & Joubert Street, Stellenbosch, Western Cape Province, South Africa, 7602
hoffmaj@sun.ac.za; 21076103@sun.ac.za
2Eindhoven University of Technology, Department of Mechanical Engineering
Building 155, Groene Loper, Eindhoven, The Netherlands, 5612
j.g.f.houtappels@student.tue.nl
Abstract - Rock bed thermal energy storage is a cost-effective solution to store waste heat from a solarized Brayton cycle for use in a Rankine cycle after sunset. However, rock bed thermal energy storage systems for utility scale concentrated solar power are huge and require multiple air inlets and outlets. As a result, the flow inside the bed is fully three dimensional and deviates considerably from plug flow conditions usually encountered in chemical reactors. Designing a rock bed thermal energy storage system for the minimum capital cost and pumping power depend on reliable predictions of the fluid flow paths and temperature profiles in the bed. Particle size and shape have a significant influence on how the particles will pack down, which in turn influences the flow pattern in the bed, and hence the pressure drop and heat transfer characteristics of the bed. In this work, we discuss the characterization of crushed rock particles and concluded that there are benefits in approximating particles by mono-dispersed ellipsoids. We used discrete element modelling to generate packed beds of the ellipsoidal particles, and computational fluid dynamics to model the flow in the interstitial voids. This way, we successfully captured the directional effect of the flow resistance for ellipsoidal particles in terms of sphericity, y, porosity e, particle diameter Dve, and particle Reynolds number Re
Our current model under-predicted the pressure drop across a packed bed of crushed rock particles.
Keywords: Computational fluid dynamics, thermal energy storage, crushed rock, particle characterization, packed bed pressure drop.
© Copyright 2022 Authors - This is an Open Access article published under the Creative Commons Attribution License terms Creative Commons Attribution License terms. Unrestricted use, distribution, and reproduction in any medium are permitted, provided the original work is properly cited.
Date Received: 2021-08-24
Date Accepted: 2021-11-30
Date Published: 2021-02-01
1. Introduction
Rapid depletion of fossil fuel resources and greenhouse gas emissions from their combustion spurred a drive towards renewable energy over the last two decades. Currently, wind-, hydro-, solar- photovoltaic (PV) and solar thermal energy are all commercially available technologies that compete for a share in the renewable energy market. Solar thermal energy already benefits from large scale thermal energy storage [1] but it is more expensive than its competitors. In arid regions, the potential for hydro energy is limited, whilst wind- and solar PV energy require massive battery storage to before they can be considered fully dispatchable. There is a considerable drive worldwide to develop cheap battery storage on a utility-scale [2] with limited commercial success thus far.
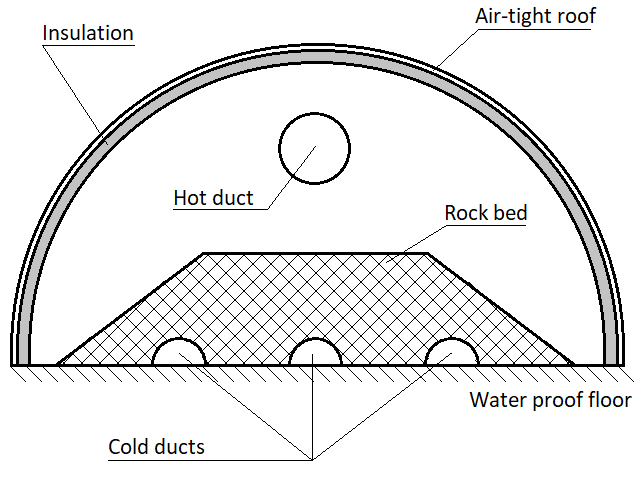
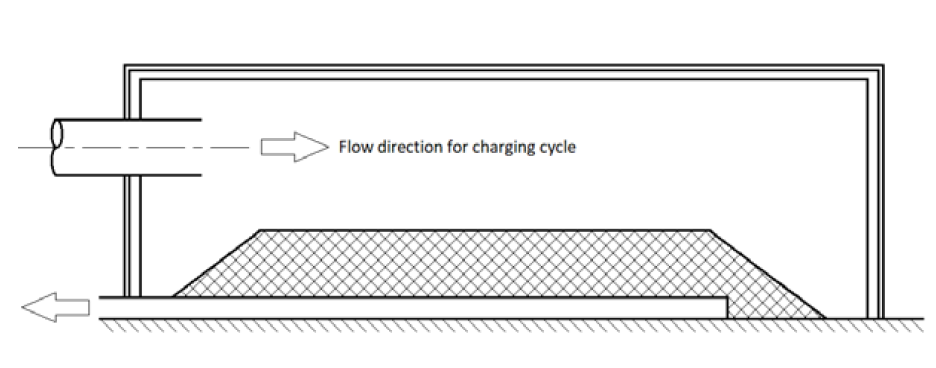
One way to drive the cost of solar thermal energy down, is to tap into the high temperatures and high thermal efficiency associated with central receiver systems and solarized Brayton cycles [3]. One suggested cost-saving is to make use of rock bed thermal energy storage, rather than a molten salt system for solarized Brayton cycles. Allen [4] estimated that the cost of a rock bed thermal energy storage system for a solarized Brayton cycle could be an order of magnitude lower than that of a comparable molten salt thermal energy storage system. He also estimated that the required volume of a rock bed capable of providing 12 hours thermal energy storage for a 50 MWe solar power station to be about 26 600 m3 (62 m × 62 m × 7 m). A concept design of the rock bed thermal energy storage system for a utility-scale solarized Brayton cycle plant [4] is shown in figure 1. One can deduct from the figure that the flow through the rock bed will be fully three dimensional. A proper understanding of the 3D flow through the bed is required to minimise bed size and pumping power, something that plug flow approximations fail to capture.
Rock bed energy storage is still in the experimental phase, and test facilities [4] – [6] usually comprise small, prismatic beds subject to near plug flow conditions. Plug flow is predominantly encountered in chemical reactors as well. Researchers present their results in terms of easily determined variables such as the packing density and volume equivalent spherical particle diameter. These models fail to capture the anisotropic nature of a rock bed, and the directional nature of the pressure drop through it. Most of the work in this field follow the lead of Ergun [7], who approximated the flow through a packed bed as flow through parallel tubes, with the hydraulic diameter of the tube derived from particle size and packing density. Some researchers [8 - 10] amended Ergun’s model to compensate for wall channelling effects.
Allen [4] observed that the flow resistance in the pour direction of crushed rock particles differs from that in the other directions, and concluded that it can be attributed to the way irregular particles pack down. Barnea and Mednick [11] argued that a discrete particle model, corrected for particle interactions, is superior to Ergun’s approach. Following a similar line of thought, Di Felice [12] suggested that pressure drop should be correlated in terms of the packing density and the drag coefficient of the particles in a free stream. Hölzer and Sommerfeld [13] offer a simple correlation for the drag coefficient of irregular particles that depend on particle orientation that can be used in Di Felice’s formulation. This approach is similar to the representative unit cell formulation suggested by Du Plessis and Woudberg [14].
To compensate for the higher pressure drop through packed beds of irregular particles than for spheres, a particle shape factor is introduced, of which sphericity is the most common [15]. Shape factor alone do not explain significant deviations from plug flow conditions.
Prescribing an ellipsoidal shape [16] – [18] to crushed rock particles has met with some success in capturing anisotropy in the flow field, but tend to under-predict the pressure drop. With the advance in computational power, pore-scale modelling of packed beds has become feasible [18] – [20], and the challenge has shifted to the proper characterization of irregular particles.
In this work, we essentially follows Ergun’s approach, but determine the pressure drop through the bed numerically by modelling the flow at pore scale. Our results are presented in a way that can easily be implemented in porous media models in computational fluid dynamics (CFD) codes.
2. Related Work
Particle characterization is seen as a necessary precursor to successful modelling of packed beds, which will lead in turn to better bed design in solar thermal power applications. Taylor [21], Bagheri et al [22] and Diogaurdi and Mele [23] describe two-dimensional protocols for particle characterization. From their work, particles can be described by representative monodispersed ellipsoids, as this shape best capture the effect of its orientation relative to the flow through the bed, as suggested by Li et al [16].
Particle shape classification is an important topic, but it seems no consensus on the best shape descriptors has been reached [24]. Galindo-Torrez et al [25] state that the tortuosity tensor is a complex function of particle morphology, and implore researchers to pay attention to it. They introduced anisotropy into their packing by varying particle aspect ratio. Du et al [26] found a strong correlation between particle sphericity and void size distribution that by implication should influence pressure drop through a packed bed. Li et al [16] pointed out that particle orientation has a “profound effect” on pressure drop, something that sphericity on its own fails to capture. Schultze et al [27] found that polydisperse particles pack down with higher packing densities than monodisperse particles and that the larger the ratio between the largest and smallest particles in the sample, the higher the packing density. Radoicic et al [28] observed that small particles in a quartz sand sample (0.8 mm < Dve < 1.25 mm) has higher sphericities (~ 0.85) than large particles (~ 0.7). Dve is the volume equivalent particle diameter. They manually sorted particles into compact and elongated groups. Coetzee and Nel [29] proposed four groups, namely equant (cubic) particles (LL ≈ LI ≈ LS), elongated particles (LL » LI ≈ LS), flattened particles (LL ≈ LI » LS) and intermediate particles that do not fit any of the other groups. LL, LI and LS are the long, intermediate and short axes of the particle. LL, LI and LS are orthogonal to each other. In a later paper, Coetzee [30] proposed spherical (21 % of the sample), elongated (42 % of the sample) and tetrahedral (37 % of the sample) particles, based on laser scans of about 300 crushed rock particles up to 40 mm in size. These choices were informed by the capabilities of the discrete element (DEM) code PFC3D, where the shapes were formed by single spherical particles (spheres), a clump of two spheres joined to each other (elongated) and a clump of four spheres at the corners of the tetrahedron. Coetzee [30] found that by using more spheres to capture the shape of irregular particles, his DEM model’s accuracy in predicting the bulk density of a packed bed of crushed rock increases.
Extracting detailed information of the experimental bed structure and local flow velocities using techniques such as X-Ray tomography and particle image velocimetry was beyond our means, and will not be discussed further.
Reports of CFD simulations of pore-scale flow in porous media is on the increase, as computational power increases. Early attempts focused on solving the Reynolds averaged Navier-Stokes (RANS) equations using finite volume methods for a few spherical particles in a structured packing [31]. RANS simulations have since expanded to beds of a few hundred particles [32], non-spherical particle shapes [16] – [18] and random packings [18] – [20]. Most of these simulations were driven from chemical and/or nuclear reactor applications, and are mostly concerned with plug flow. Pore-scale turbulence in packed and fluidized beds is also attracting interest by researchers using direct numerical simulation (DNS) [32] or lattice Boltzmann methods [33]. The high computational cost of DNS and LBM simulations meant that most of the work reported so far were for representative unit cells only.
Jobic et al [33] deviated from the plug flow approach and extracted the permeability tensor for low Reynolds number flow through porous rocks and a Kelvin type foam with a repeating structure. They varied their porosity by changing either the strut diameter (of a Kelvin type foam) or stretching their computational domain in one direction and shrinking it in the orthogonal directions. Their permeability tensor has constant coefficients and is different for each porous material. They linked permeability to the porosity of the bed, but not to particle shape.
Hoffmann & Lindeque [18] modelled isothermal flow through randomly packed beds of ellipsoidal particles for Reynolds numbers in the turbulent region, resulting in a resistance tensor with constant coefficients. Their work was validated for flow in three orthogonal directions, and captured only the diagonal elements of the resistance tensors in equation (1).
Modelling packed beds usually rely on representing irregular particles by one or at most a few representative particle shapes and/or sizes, of which spheres are the most popular. To model heat transfer and pressure drop accurately, it is required that the representative particles capture the ratio between actual particle volume and surface area faithfully.
3. Theory
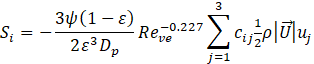
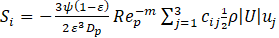
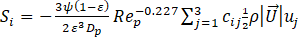
The pressure drop across an anisotropic porous medium is introduced through momentum sink terms Si in CFD [34]
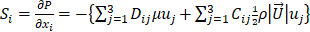
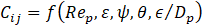
In equation (1), P is the pressure, μ viscosity and ρ the density of the fluid and uj the velocity components and ![]() the velocity magnitude. Equation (1) is very similar to the Ergun equation, except that the coefficients Dij and Cij are tensors, not constants.
the velocity magnitude. Equation (1) is very similar to the Ergun equation, except that the coefficients Dij and Cij are tensors, not constants.
From dimensional analysis, one would expect the coefficients Dij and Cij in equation (1) to depend on particle Reynolds number, Rep, void fraction ε, a particle shape factor ψ (we selected sphericity for its relevance to heat transfer via the Biot number), particle orientation with flow direction, described by the particle elevation and azimuthal angles Θ and Φ, the bed to particle characteristic length ratio Db/Dp and particle relative roughness . For Rep » 1, the viscous contribution to bed pressure drop captured in Dij can be ignored. Wall channelling is important for small bed-to-particle diameter ratio’s and can be ignored for Db/Dp > 10 [10], [27], [35]. That leaves one with
For the Reynolds number, we adopted the superficial particle Reynolds number, given by

with Us the superficial velocity. According to Allen [4], the pressure drop per unit length through the bed is given by
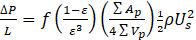
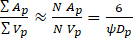
f is the Darcy a friction factor and Ap and Vp are the surface area and volume of the particles respectively. It can be shown that for N irregular particles in a unit cell
The friction coefficient for flow in pipes can be written as [36]

Substituting equations (5) and (6) into equation (4) leads to
A similar equation was derived for plug flow by Trahan et al [37], who replaced the tensor cij by a scalar. The resistance tensor cij accounts for the particle orientation relative to the flow direction. Equation (2) is now resolved for all dimensionless variables except the relative surface roughness ![]()
The next task is to determine the equivalent diameter as shape factor (sphericity) of the particles.
4. Methodology
Figure 2 depicts the workflow, using a combination of discrete element modelling (DEM) and computational fluid dynamics (CFD), that we followed in designing packed beds of crushed rock particles as thermal energy storage for solar thermal power plant. The DEM model gives one individual particle positions and orientations, whilst the CFD model allows one to calculate the heat transfer and pressure drop. Choosing a spherical container allows one to change the azimuth and elevation angle of flow direction easily in the CFD model and validation tests.
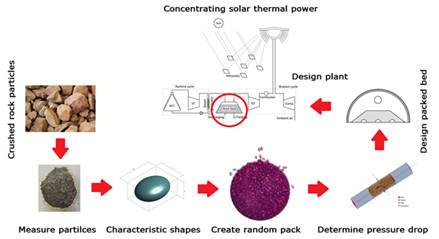
After validation, the wall affected region is identified, and removed from the CFD model to get a more representative value for the pressure drop through a large packed bed.
4.1 Particle characterization
Dolerite is imminently suited for rock bed thermal energy storage. Allen [4] has shown that after 1 500 thermal cycles, where the temperature was changed at a rate of 2 °C/min between 350 °C and 530 °C, dolerite shows no physical deterioration, except for some discolouration. Allen also mentioned that Dolerite deposits largely overlap the region with the best solar resource in South Africa.
The rock samples considered in this paper were randomly selected by hand from a 20-ton pile of crushed dolerite rock in a size range from 53 mm to 75 mm. The rock pile has been exposed for more than five years to the elements, and most dust was washed away by rain. Operator A [18] selected 120 particles (sample I) and operator B (current work), 254 particles (sample II). A subset of 18 particles from sample II was selected for 3D scans (sample III). Particle mass was measured to within 0.01 g using a digital scale.
For sample I, only the minimum bounding box (LL × LI × LS) was measured to within 0.1 mm using a Vernier calliper [18]. For the second batch of rocks (sample II), we adopted a 2D projected area protocol suggested by Bagheri et al [22]. Three orthogonal images of the particles were processed with Image-J. Surfaces of the particles from sample III were 3D scanned using an HP 3D Structured Light Scanner S3 Pro. The averaged results are given in tables 1 and 2.
Table 1. Mean particle aspect ratio for all samples.
|
|
Sample I |
Sample II |
Sample III |
|
Elongation (LL/LI) |
1.479 |
1.480 |
1.465 |
|
Flatness (LS/LI) |
0.630 |
0.639 |
0.616 |
|
Equivalent diameter |
57.7 |
51.0 |
53.0 |
Table 2. Comparison of mean particle parameters of crushed rock and equivalent ellipsoids.
|
Crushed rock |
Ellipsoid |
|
|
LL [ mm ] |
80.5 |
78.1 |
|
LI [ mm ] |
55.2 |
53.6 |
|
LS [ mm ] |
34.0 |
33.0 |
|
SA [ mm2 ] |
11 235 |
9 687 |
|
ψ |
0.779 |
0.892 |
The 2D projections were validated against 3D scans. The error in volume between the 3D scans (reference) and weight-based measurements ranged from -3.8 % and +2.5 % (average -0.01 %), whilst the error in surface area ranged from -14.0 % to +9.1 % (average -3.2 %). Errors in sphericity ranged from -16.0 % to +7.5 %, with an average error of -3.7 %. Our sphericities were in the range 0.6 – 0.9, that overlaps the measurements of Okonta and Magagula [38] for a dolerite aggregate from a South African quarry. We did not observe the increase in sphericity with decreasing particle size, reported by Radoicic et al [28].
4.2 Discrete element modelling
We opted for discrete element modelling (DEM) since it is easy to extract particle position and orientation data from the DEM code. This information is required to determine the mean particle orientation with the airflow direction through the bed. It is very difficult and expensive to obtain such detailed information experimentally. An added benefit is that one can remove the wall affected region from the domain for CFD simulations after completion of the validation work; something that is impossible to do experimentally.
DEM is a numerical method that considers contact and friction forces between a large number of particles and between particles and containment walls in a gravity field to simulate the bulk behaviour of granular materials. Spherical particles are preferred since it is easy to determine which particles are in contact. Non-spherical particles can be created by either bonding several spheres together to get the shape of the approximate particles or using faceted particles. Contact detection between faceted particles is time-consuming, as facet-to-facet, facet-to-line, facet-to-point, line-to-line, line-to-point and point-to-point contacts need to be considered [39]. Computation time increases as the number of facets used to describe the particle increases.
Hlosta et al [40] found that porosity is a weak function of particle shape and size distribution, whilst both are computationally expensive. In contrast, they found that contact stiffness, which is expensive to calculate for hard particles due to the small time steps required, has a negligible influence on porosity. Lommen et al [41] suggested that if one reduces contact stiffness by a few orders of magnitude, the influence on porosity will be insignificant, whilst computational time reduces significantly. According to Hlosta et al [40], static friction between particles has a weak influence on porosity. In contrast, its influence on granular flow is strong. Based on the above, the porosity of a static bed in a closed container would be almost independent of the mechanical properties of the dolerite particles. The properties of dolerite are used in the DEM simulations without calibration. Particle stiffness was reduced by two orders of magnitude to speed up the simulations. We validated our DEM model by comparing the porosity predicted by our model (0.389) to that recorded during the experiments (0.415).
We created a randomly packed bed of monodispersed spherical particles, by dropping particles into a 1.142 m diameter spherical container. The size of the container was chosen such that

...with L the height and width of the cross-section of our wind tunnel. It gives us a ratio of L/Dve ≈ 20, at which wall effects on the overall flow should become insignificant [10]. The spherical shape allowed us to evaluate the flow through the bed at different azimuthal and elevation angles relative to the original position.
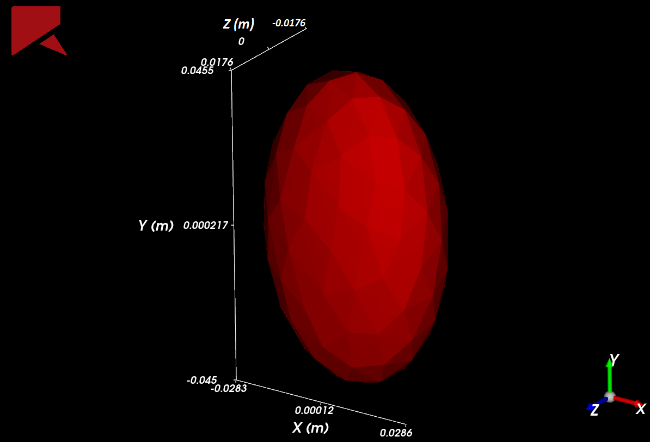
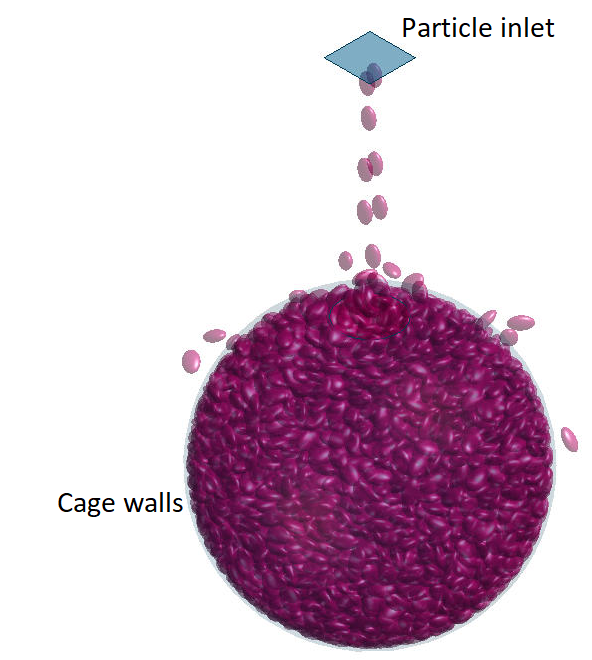
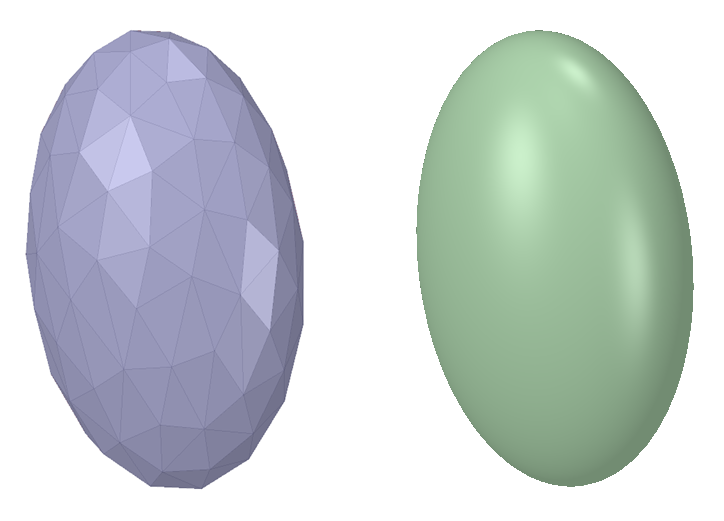
Ellipsoidal particles with LL/LI = 1.59, and LS/LI = 0.62 and Dve = 56.8 mm were created in the commercial DEM code Rocky 4.3. Particles were faceted, with 120 facets {figure 3 (top)} per particle, and were released from a height of 2 m above the datum plane {figure 3(bottom)} and allowed to drop through a 0.3 m diameter hole at the top of the spherical container. Double the amount of particles required to fill the container based on an estimated bulk porosity of 0.4 was released, such that the container overflows. The kinetic energy of falling particles hitting the particles already in the cage allows particles to rearrange themselves into a more or less close random packing. At the end of the DEM simulation, the position vector of the particle centroid, the rotation vector (i.e. the vector around which the particle is rotated) and the rotation angle are written to a csv file. Further processing of particle data was done in either Microsoft Excel or ANSYS.
Particle data was read from the csv file, and converted into a Python script. The script is read by SpaceClaim that was used to replicate the packed bed for the CFD simulations. First, an ellipsoidal particle is created at the global origin. A copy of the ellipsoid is then rotated by the rotation angle around a local coordinate system that has the local x-axis pointing in the direction of the rotation vector. Finally, the rotated particle is translated in the global coordinate system to its final position. After all the particles were copied, the master particle is deleted.
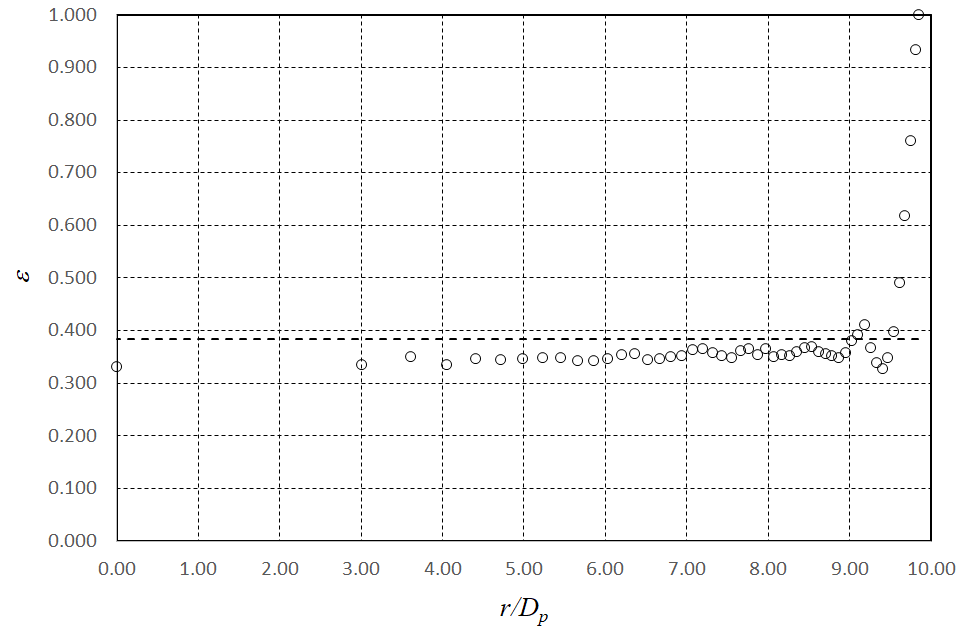
In the next step, the particle volume was subtracted from the container volume to get the bulk void fraction of the bed. To get an indication of the void fraction distribution, layers of equal volume were shaved off the bed, and the porosity of each layer evaluated. In figure 4, the porosity distribution for the DEM generated packed bed is shown. The general behaviour is in line with what other researchers reported for packed beds of spheres in cylindrical and cubic containers [42]. To the best of our knowledge, no data on the porosity distribution of ellipsoids in a spherical container has been published. The peaks and troughs in the porosity distribution are not as pronounced as reported by others, but it may be an artefact of the relatively small number of layers we used (50). From figure 4, we conclude that we can eliminate wall effects from our CFD model if all particles within an outer shell 2Dve thick are removed.
4.3 Computational fluids dynamics modelling
4.3.1 Mesh generation
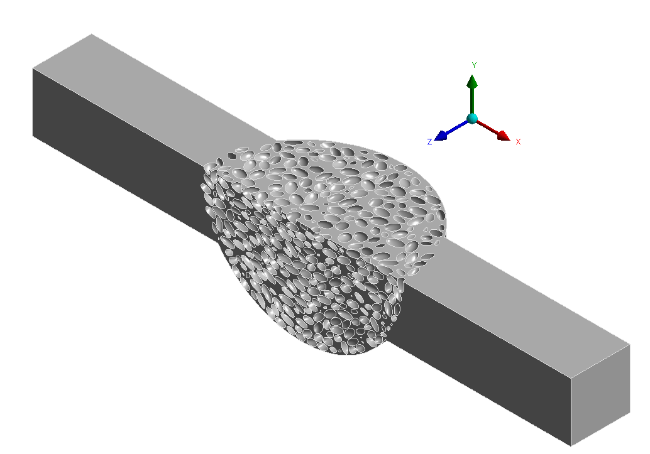
The cage walls reduce the packing density close to the walls, and influence the orientation of particles next to the wall. Both these effects are present in the experimental set-up, but not in the real world applications we wish to model. For validation purposes, we simulated our experimental set-up, which included wall effects. Ellipsoids were created in the ANSYS pre-processing software SpaceClaim as described before. The ellipsoids were subtracted from the inside of the wind tunnel to yield the interstitial volumes between particles, as shown in figure 5. Due to hardware constraints, only the lower quadrant of the wind tunnel was modelled for validation tests.
For all pressure drop simulations not done for validation purposes, the wall affected region, corresponding to a layer of 2Dve thick on the outside of the bed, was removed from the domain. To simulate the flow at various particle orientations, a square section of 6Dve × 6Dve was cut through the centre of the wind tunnel. The random nature of the particle packing prevented the use of periodic boundaries; slip walls were used on the section planes. Repeating the simulations for sections 4Dve × 4Dve, and 8Dve × 8Dve had a negligible effect (0.8 % between 4Dve × 4Dve and 6Dve × 6Dve domain, and 0.3 % between 6Dve × 6Dve mesh and 8Dve × 8Dve domain) on the pressure drop through the bed.
A large number of particles penetrate each other by a small amount, firstly due to inter-particle contact forces. More significantly, in the DEM model, faceted particles were modelled, whereas, in the CFD model, they were modelled as smooth ellipsoids. For convex particles, vertices will fall on the surface of the particle, but edges and faces fall inside the curvature of the particle, as shown in figure 6. Meshing near the contact surfaces is problematic due to the acute angles, resulting in poor mesh quality (4.7 × 10⁻⁴ % of cells have an orthogonal quality ≤ 0.01) near contact surfaces. The average orthogonal quality for the entire domain is 0.763.
Particles were shrunk by 2.5 %, which allowed us to obtain meshes of reasonable orthogonal quality with one prismatic layer on the solid surfaces. The shrinkage is higher than the 1 - 2 % recommended by Dixon et al [43], [44] for point contacts between spherical particles, but less shrinkage resulted in close proximity between particles and invariably highly skewed meshes. The remaining contact surfaces between particles were identified, and bridged by inserting a sphere with a radius of order (d « Dve) at the centre of the contact surface, and subtracting it from the interstitial volume. This opened up the angles between touching particles, but a few highly skew mesh cells persist where particles are in close proximity to each other. We had to revert to a “cheat” available in ANSYS Fluent where flow variables in highly skewed cells are calculated from averaging values in neighbouring cells, rather than from gradients and/or fluxes across cell faces.
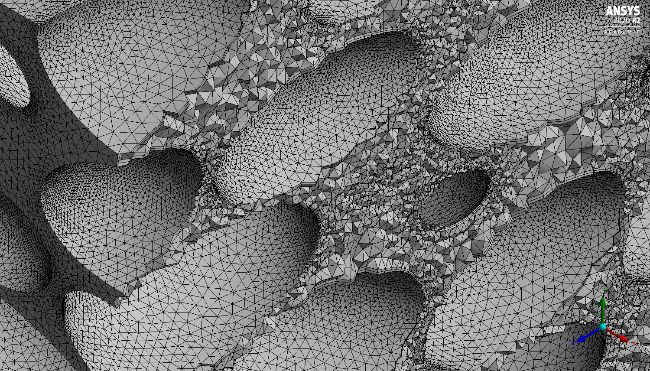
We used curvature and proximity size functions, with a minimum mesh size of about Dve/150, growing to a maximum size of Dve/5 at a cell-to-cell growth rate of 1.2. This resulted in meshed of about 200 million tetrahedral cells. The courser mesh was mostly confined to the free run of the wind tunnel upstream and downstream of the bed. The average non-dimensional wall distance, y+, 2.68 for Rep ≈ 3 000, but it reached a local maximum of 30.
4.3.2 Mesh independence study
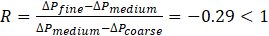
We had access to a dual Xeon workstation with 16 cores and 256 GB RAM for mesh generation. That theoretically allowed us to build meshes of up to 250 million tetrahedral cells, following the rule of thumb that 1 million cells require about 1 GB RAM. Hardware constraints prevented us from doing a comprehensive mesh independence study. By coarsening and refining the mesh by 20 %, we could show that the convergence rate R
Thus we have oscillatory convergence. Some parameters of the mesh independence study is given in table 3, with the grid convergence index (GCI) [45] given by
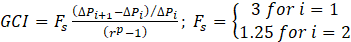
and p = 2 for second order discretization schemes.
Table 3. Mesh independence parameters.
|
Mesh |
Δ x |
Δ P |
ε |
GCI |
|
Coarse |
0.012 |
155.74 |
- |
- |
|
Medium |
0.010 |
156.36 |
0.63 |
2.73 % |
|
Fine |
0.008 |
156.18 |
-0.18 |
0.33 % |
4.3.3 Mathematical formulation of the problem
The flow was assumed to be steady, isothermal, incompressible and turbulent. All physical properties of the fluid (air) were kept constant. As a result, the continuity, Navier-Stokes and Reynolds-averaged equations for the turbulent kinetic energy, k and its specific dissipation rate ω , are solved [46].
4.3.4 Simulation set-up
We prescribed a constant velocity at the inlet since the wind-tunnel is equipped with a bell mouth that should ensure a uniform velocity profile, wall boundaries for the particles, slip-walls on the sides of the domain and a pressure outlet boundary where the flow leaves the domain.
We adopted the k-ω turbulence model since it is suited for flows with high streamline curvature and strain rates [46], and its greater flexibility in dealing with wall functions.
We used the SIMPLE scheme for pressure velocity coupling, and second order upwind schemes for all other flow variables. An under-relaxation factor of 0.2 was set for the pressure equations, 0.5 for the velocities and 0.6 for turbulence.
Normalized residuals were set at 10-3, and the pressure drop (our key performance indicator) across the domain, as well as the maximum velocity inside the domain was monitored. The solution is declared converged if the residuals drop below 10-3 and the pressure drop and maximum velocities remain constant over the last 250 iterations. This was usually achieved within 5 000 iterations.
4.4 Experiments
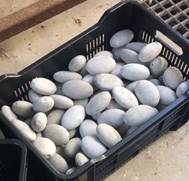
Cement casts of the ellipsoidal particles were made using a 50/50 mixture of sand and cement. Twelve particles were cast per mould, and moulds were clamped overnight to allow cement time to set. A vent hole at the top allowed excess cement to escape when the two halves of the moulds are clamped together. The excess was required to ensure a strong bond between the two halves in the cast. Measurements on a sample of 50 casted particles yield LL = 87.4 ± 1.12 mm, LI = 58.7 ± 0.57 mm and LS = 39.4 ± 1.12 mm, compared to target dimensions of LL = 87.7 mm, LI = 59.2 mm and LS = 37.7 mm. The largest average deviation was recorded for LS, which can be attributed to a thin layer of cement trapped between the two faces of the mould, even when clamped tightly together.
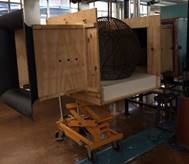
Particles were poured into a spherical cage, made of flattened expanded metal screens stretched over a steel frame. The frame was created by first tessellating the surface of a sphere in 20 equilateral spherical triangles, and the links correspond to the sections of a great circle connecting the corners of the triangles. Porosity was determined by counting particles in the cage and subtracting the volume of the particles from the inside volume of the cage. Using this method, an average porosity of 41.5 % was obtained. To reduce wall leakage, the wind tunnel section around the cage was enlarged, and Styrofoam inserts were used to prevent flow leaking around the outside of the cage. This way, flow near the cage walls is forced along a longer path.
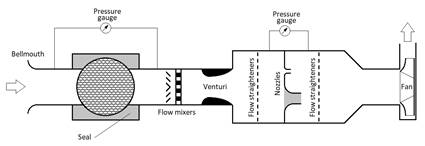
Tests were conducted in a low-speed wind tunnel in our heat transfer laboratory, as shown in figure 7. The pressure drop across the bed, as well as across the elliptical nozzle(s) were measured by Endress & Hauser pressure transducers. Both were calibrated against a Betz micro-manometer before the tests. The air temperature was measured by six thermocouples at the inlet of the wind tunnel, whilst the atmospheric pressure was measured using a mercury manometer mounted on the laboratory wall.
At first, the pressure drop across the empty cage was measured at five different flow rates. The flow rate was varied by stepping up the frequency of the variable speed controller on the fan by intervals of 10 Hz, from 10 – 50 Hz, and down again. The symmetrical nature of the cage design should result in the resistance across the cage showing very little directional effects. The cage was then filled with particles, and the flow resistance across the filled spheres tested at the same series of fan speeds. Upon completion, the test section was opened, and the cage turned to increase the elevation angle by 30°, whilst keeping the azimuthal angle at 0°. After covering the full range of elevation angles (0 – 90°), the azimuthal angle was changed in intervals of 30° for each elevation angle. Finally, the cage was emptied and refilled with particles to get a different random packing, and the whole range of tests repeated. In a control experiment, the same tests were repeated with crushed rock particles.
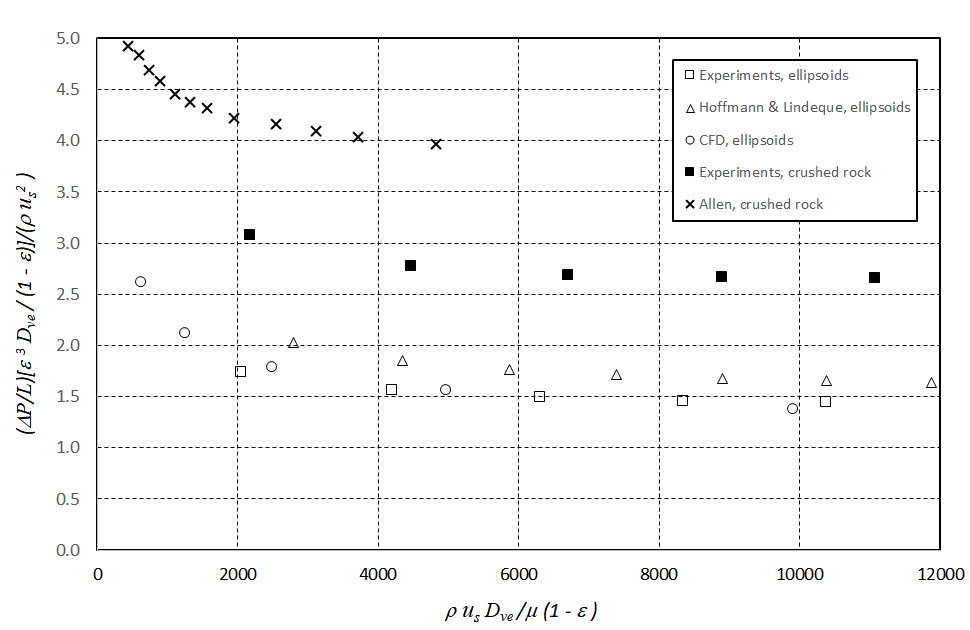
Test data for azimuthal angle 0° and elevation angles 0° (horizontal flow) and 90° (vertical flow) are shown in figures 8 and 9 respectively. Agreement between our experimental data and that of Hoffmann and Lindeque [18] for the same particles in a cubic container is within 12.5 %. Our test data also agrees within 9 % with our CFD simulation results for ellipsoidal particles.
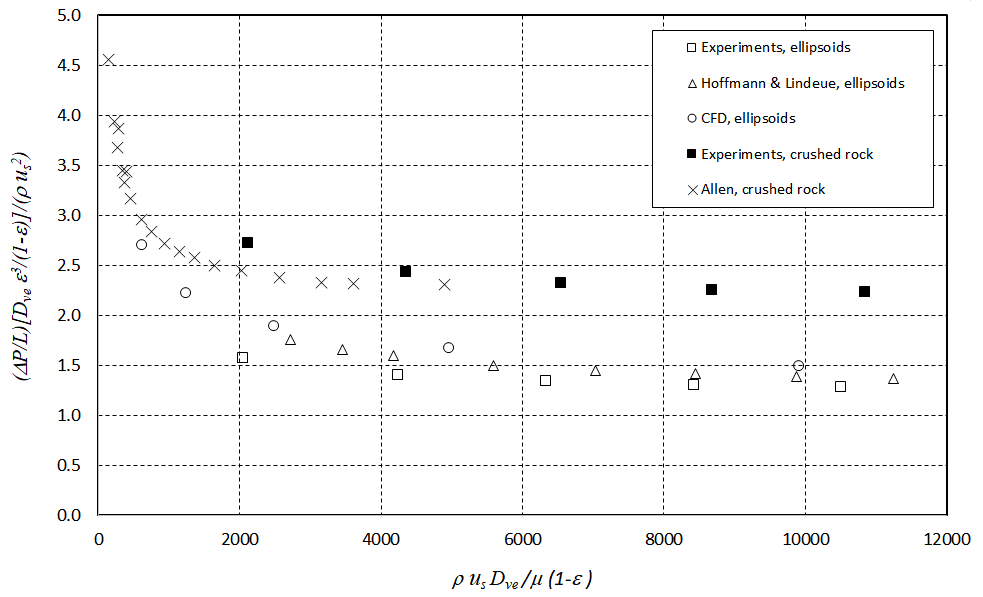
For horizontal flow through packed beds of crushed rock, our data is similar to that measured by Allen [4], but in both cases, the pressure drop for crushed rock is about 50 % higher than that for ellipsoids. In the case of vertical flow, Allen’s test data yields a pressure drop of about 45 % higher than our measurements. Our pressure drop for crushed rock particles is in turn about 66 % higher than what we measured across ellipsoidal particles. Both the experimental and CFD results show that the pressure drop is essentially independent of the azimuthal angle. We conclude that our CFD model is validated for ellipsoidal particles, but more work is required to extend it to crushed rock particles.
5. Results and Discussion
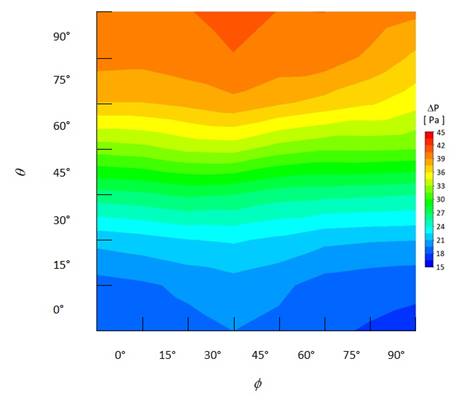
We evaluated the pressure drop across a packed bed of ellipsoidal particles for 49 flow directions by varying elevation and azimuthal angles of the bed relative to the global coordinate system in increments of 15°, and for 6 different superficial velocities at each orientation, starting from 0.05 m/s, and doubling the velocity between successive simulations. This gave us 294 data points, although varying the azimuthal angle between 0° and 90° degrees for an elevation angle of 90° does not yield independent data points. A linear regression on the raw data for each superficial velocity yield preliminary values for the elements of the resistance tensor Cij. Normalizing the tensor elements by dividing them by their values at the lowest particle Reynolds numbers, we obtained figure 10. We then fitted a power law through data to get the coefficients in equation (9). The number after the ± sign indicates one standard deviation from the mean. For diagonal elements, the standard deviation is less than 5 % of the mean, and for non-diagonal elements, it is less than 15 %. Although the derivation of equation (9) includes the effect of porosity, particle size and shape (through sphericity) and should be generally applicable, we do not have data for other particles shapes and sizes to support this claim.
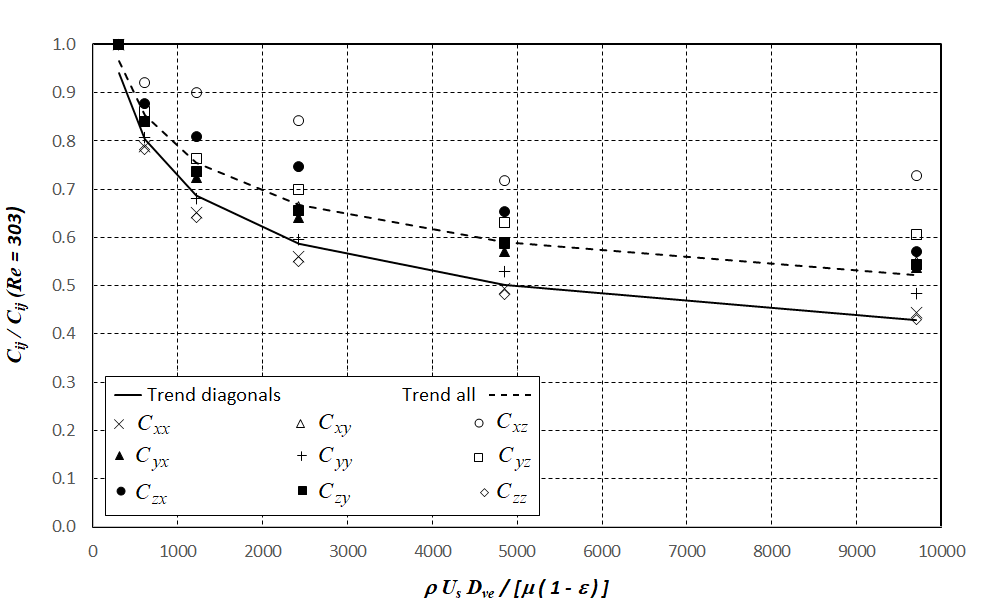
From the result of our regression, it is clear that the diagonal elements dominate.
with
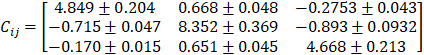
The correlation coefficient R2 = 0.965 is based on the diagonal elements. The power of Reynolds number
(-0.227) is comparable to that reported by Singh et al [47] (-0.2) for plug flow through structured beds of spheres, cubes and bricks.
Equation (9) hints towards skew-symmetry, with Cxy ≈ -Cyx, and Cyz ≈ - Czy, but the expected pattern is violated by Cxz ≈ Czx, something that is confirmed by figure 11.
The ratio between the magnitudes of the diagonal terms is approximately the same as the ratio between Herman’s orientation factors, suggesting that the diagonal coefficients might be functions of the orientation factor. The off-diagonal elements do not show such a clear trend, and we could not find a general correlation between Cij and the orientation factors.
6. Conclusion
Thermal energy storage systems for large solar thermal plant, whether for electricity generation or process heat, will typically contain multiple outlets, giving rise to fully three-dimensional flow patterns. Designing such systems requires a good understanding and prediction of the flow through anisotropic porous media to derive the correct number of outlets and properly size them and to make full use of the volume of storage material by predicting and avoiding dead areas in the bed.
Our current understanding of flow through rock beds is either based on plug flow (chemical reactors and pebble bed nuclear reactors) or three-dimensional flow through anisotropic media low Reynolds numbers (soil sciences). Research on three-dimensional flows through anisotropic beds at higher Reynolds numbers seems to be lacking. This work aims to address that gap by incorporating equation (9) in a porous media simulation of an anisotropic packed bed. Such an approach might yield useful results without the vast computational overhead of modelling the bed at the pore scale. We don’t have experimental data on a full-scale packed bed at present to back up our claim, but preliminary simulations show significant differences in the flow through isotropic and anisotropic beds.
From previous research [14], it is clear that sphericity on its own cannot account for the effect of particle orientation on pressure drop. We adopted ellipsoidal shapes in this work for their unambiguous aspect ratio that allows us to determine Herman’s orientation factor easily from the DEM results. We evaluated a large sample of crushed rock particles, using three different protocols to derive at a representative particle shape, and made cement castings of the representative particle for experimental purposes.
In this work, we used a DEM to generate randomly packed beds of ellipsoidal particles, and CFD to simulate the pressure drop through the interstitial volumes at Reynolds numbers in the turbulent region. The simulations were validated against experiments with ellipsoidal particles. The DEM/CFD results allowed us to predict the effect of flow direction relative to particle orientation satisfactorily, as presented in equation (9). In this equation, particle diameter, sphericity and void fraction are parameters of the solution. The pressure loss coefficients are functions of Reynolds number, and our Reynolds number dependence is similar to that reported by Singh et al [46]. That left us with a pressure drop tensor of constant coefficients that account for the effect of flow direction relative to particle orientation.
However, results for ellipsoidal particles under-predicts the pressure drop across beds of crushed rock by 50 %. We suspect that the difference is at least in part due to our adoption of monodispersed particles, as Schultze et al [27] reported packing densities of about more than 10 % higher for polydispersed beds of spherical particles than for monodisperse beds. A 10 % decrease in void fraction will result in a 20 % increase in pressure drop according to equation (9). Barret [24] suggested that particles can be sufficiently described by three independent parameters, namely a shape factor (he mentioned aspect ratio or sphericity), roundness (of corners) and surface texture. Finally, the drag coefficient for parallelepipeds is higher than those for more “streamlined” shapes like ellipsoids. Although we consider this work as a useful first step in understanding flow through anisotropic beds, we have already embarked on follow-up research to address some of the outstanding issues.
Acknowledgement
The authors acknowledge the Centre for High-Performance Computing (CHPC) at the Council for Scientific and Industrial Research (CSIR), South Africa, for providing computational resources to this research project.
References
[1] Labordena, M. and Lilliestam, J., “Cost and transmission requirements for reliable solar electricity from deserts in China and the United States”, Energy Procedia, vol. 76, pp. 77 – 86, 2015. View Article
[2] IRENA, “Electricity Storage and Renewables: Costs and Markets to 2030”, International Renewable Energy Agency, Abu Dhabi, 2017.
[3] Boretti, A., “Cost and production of solar thermal and solar photovoltaic power plants in the United States”, Renewable Energy Focus, vol. 2, pp. 93 – 99, 2018. View Article
[4] Allen, K.G., “Rock bed thermal storage for concentrating solar power plants”, PhD Thesis, Stellenbosch University, 2014.
[5] Okello, D., Nydal, O.J., Nyeinga, K., and Banda, E.J.K., “Experimental investigation of heat extraction from a rock bed heat storage system for high-temperature applications”, Journal of Energy in Southern Africa, vol. 27, No. 2, pp. 30 – 37, 2016. View Article
[6] Klein, P., “High temperature packed bed thermal storage for solar gas turbines”, PhD Thesis, University of the Witwatersrand, 2016. View Article
[7] Ergun, S., “Fluid flow through packed columns”, Chemical Engineering Progress, vol. 48, No. 2, pp. 89 –94, 1952.
[8] Achenbach, E., “Heat and flow characteristics of packed beds”, Experimental and Thermal Fluid Sciences, vol. 10, pp. 17 – 27, 1995. View Article
[9] Hunt, M.L. and Tien, C.L., “Non-Darcian flow, heat and mass transfer in catalytic packed-bed reactors”, Chemical Engineering Science, vol. 45, No. 1, pp. 55 – 63, 1990). View Article
[10] Van Antwerpen, W., Du Toit, C.G. and Rousseau, P.G., “A review of correlations to model the packing structure and effective thermal conductivity in packed beds of mon-sized spherical particles”, Nuclear Engineering and Design, vol. 240, pp. 1803 – 1818, 2010. View Article
[11] Barnea, E. and Mednick, R.L., “A generalized approach to the fluid dynamics of particulate systems, Part III: General correlation for the pressure drop through fixed beds of spherical particles”, The Chemical Engineering Journal, vol. 15, pp. 215 – 227, 1978. View Article
[12] Di Felice, R., “The voidage function for fluid-particle interaction systems”, International Journal of Multiphase Flow, vol. 20, No. 1, pp. 153 – 159, 1994. View Article
[13] Hölzer, A. and Sommerfeld, M., “New simple correlation formula for the drag coefficient of non-spherical particles”, Powder Technology, vol. 184, pp. 361 – 365, 2008. View Article
[14] Du Plessis, J.P. and Woudberg, S., “Pore-scale derivation of the Ergun equation to enhance its adaptability and generalization”, Chemical Engineering Sciences, vol. 63, pp. 2576 – 2586, 2008. View Article
[15] Wadell, H., “Volume, shape and roundness of quartz particles”, The Journal of Geology, vol. 43, No. 3, pp. 250 – 280, 1935. View Article
[16] Li, X., Jiang, M., Huang, Z. and Zhou, Q., “Effect of particle orientation on the drag force in random arrays of prolate ellipsoids in low-Reynolds-number flows”, AIChE Journal, vol. 65:e16621, pp. 1 – 11, 2019. View Article
[17] Gan, J., Zhou, Z. and Yu, A., “Particle scale study of heat transfer in packed and fluidized beds of ellipsoidal particles”, Chemical Engineering Science, vol. 144, pp. 201 – 215, 2015. View Article
[18] Hoffmann, J.E. and Lindeque, P.J., “Pressure drop though randomly packed beds of ellipsoidal particles”, Proceedings of HEFAT 2019, Wicklow, 2019. View Article
[19] Jafari, A., Zamankhan, P., Mousavi, S.M. and Pietarinen, K., “Modeling and CFD simulation of flow behaviour and dispersivity through randomly packed bed reactors”, Chemical Engineering Journal, vol. 144, pp. 476 – 482, 2008. View Article
[20] Linsong, J., Hongsheng, L., Dan, W., Jiansheng, W. and Maohao, X., “Pore-scale simulation of vortex characteristics in randomly packed beds using LES/RANS models”, Chemical Engineering Science, vol. 177, pp. 431 – 444, 2018. View Article
[21] Taylor, M.A., Garboczi, E.J., Erdogan, S.T., and Fowler, D.W., “Some properties of irregular 3-D particles”, Powder Technology, vol. 12, pp. 1 – 15, 2006. View Article
[22] Bagheri, G.H., Bonadonna, C., Manzella, I. and Vonlanten, P., “On the characterization of size and shape of irregular particles”, Powder Technology, vol. 270, pp. 141 – 153, 2015. View Article
[23] Dioguardi, F. and Mele, D., “A new shape-dependent drag correlation formula for non-spherical rough particles: experiments and results”, Powder Technology, vol. 277, pp. 222 – 230, 2015. View Article
[24] Barret, P., “The shape of rock particles, a critical review”, Sedimentology, vol. 2, pp. 291 – 303, 1980. View Article
[25] Galindo-Torrez, S.A., Scheuermann, A. and Li, L., “A numerical study on the permeability in a tensorial form for laminar flow in anisotropic porous media”, Physical Review E, vol. 86, pp. 046306-1 – 046306-9, 2012. View Article
[26] Du, W., Quan, N., Lu, P., Xu, J., Wei, W. and Zhang, L., “Experimental and statistical analysis of the void size distribution and pressure drop validations in packed beds”, Chemical Engineering and Design, vol. 106, pp. 115 – 125, 2016. View Article
[27] Schultze, S., Nikrityuk, P.A. and Meyer, B., “Porosity distribution in monodisperse and polydisperse fixed beds and its impact on the fluid flow”, Particulate Science and Technology, vol. 33, pp. 23 – 33, 2015. View Article
[28] Radoicic, T.K., Duris, M., Garic-Grolovic, R., Arsenijevic, Z. and Grbavcic, Z., “Particle characterization of polydisperse quartz filtration sand”, Powder Technology, vol. 254, pp. 63 – 71, 2014. View Article
[29] Coetzee, C.J. and Nel, R.G., “Calibration of discrete element properties and the modelling of packed rock beds”, Powder Technology, vol. 264, pp. 332 – 342, 2014. View Article
[30] Coetzee, C.J., “Calibration of the discrete element method and the effect of particle shape”, Powder Technology, vol. 29, pp. 50 – 70, 2016. View Article
[31] Dixon, A.G. and Nijemeisland, M., “CFD as a design tool for fixed-bed reactors”, Industrial & Engineering Chemistry Research, vol. 40, No. 23, pp. 5246 – 5254, 2001. View Article
[32] Tavassoli, H., Peters, E.A.J.F. and Kuipers, J.A.M., “Direct numerical simulations of fluid-particle heat transfer in fixed random arrays of non-spherical particles”, Chemical Engineering Science, vol. 129, pp. 42 – 48, 2015. View Article
[33] Jobic, Y., Kumar, P., Tobin, F. and Occelli, R., “Determining permeability tensors of porous media: a novel “vector kinetic” numerical approach”, International Journal of Multiphase Flow, vol. 110, pp. 198 – 217, 2019. View Article
[34] ANSYS Fluent User’s Guide 2019R3, Section 6.2.3.2: Momentum equations for porous media, Accessed 14 August 2020.
[35] Vortmeyer, D. and Schuster, J., “Evaluation of steady flow profiles in rectangular and circular packed beds by a variational method”, Chemical Engineering Science, vol. 38, No. 10, pp. 1691 – 1699, 1983. View Article
[36] Blasius, H., “Das Aenlichkeitzgesetz bei Reibungsvorgängen in Flüssigkeiten”, In: VDI Mitteilungen über Forschengsarbeiten auf dem Gebiete des Ingenieurswesens, vol. 131, Springer, Berlin, 1913. View Article
[37] Trahan, J., Graziani, A., Goswami, D.Y., Stefanakos, E., Yotshi, C. and Goel, N., “Evaluation of pressure drop and particle sphericity for an air-rock bed thermal storage facility”, Energy Procedia, vol. 57, pp. 633 – 642, 2014. View Article
[38] Okonta, F.N. and Magagula, S.G., “Railway foundation properties of some South African quarry stones”, Electronic Journal of Geotechnical Engineering, vol. 16, pp. 179 – 197, 2008.
[39] ESSS, Rocky DEM version 4.3 Technical Manual, 2020.
[40] Hlosta, J., Jezerska, L., Rozbroj, J., Zurovec, D., Necas, J. and Zegzulka, J., “DEM investigation of the influence of particulate properties and operating conditions on the mixing process in rotating drums: part 1 – determination of the DEM parameters and calibration process”, Processes, vol. 8, No. 2, paper 222; DOI 10.3390/pr8020222, 2020. View Article
[41] Lommen, S., Schott, D. and Lodewijks, G., “DEM speedup: stiffness effect on bulk behaviour of material”, Particuology, vol. 124, pp. 107 – 112, 2014. View Article
[42] Khirevich, S., Höltzel, A., Hlushkou, D. and Tallarek, U., “Impact of conduit geometry and bed porosity on flow and dispersion in non-cylindrical sphere packings”, Analytical Chemistry, vol. 79, pp. 9340 – 9349, 2007. View Article
[43] Dixon, A.G., Taskin, M.E., Nijemeisland, M. and Stitt, E.H., “Systematic mesh development for 3D CFD simulation for fixed beds: single sphere study”, Computers and Chemical Engineering, vol. 35, pp. 1171 – 1185, 2011. View Article
[44] Dixon, A.G., Nijemeisland, M. and Stitt, E.H., “Packed tubular reactor modelling and catalyst design using computational fluid dynamics”, Advances in Chemical Engineering, vol. 31, pp. 307 – 389, 2006. View Article
[45] Roache, P.J., Fundamentals of verification and validation, Hermosa Publishers, 2009.
[46] Versteeg, H.K. and Malalasekera, W., “An introduction to computational fluid dynamics: the finite volume method”, 2nd Edition, Pearson Education Ltd, Harlow, England, 2007.
[47] Singh, H., Saini, R.P. and Saini, J.S., “A review on packed bed solar energy storage systems”, Renewable and Sustainable Energy Reviews, vol. 14, pp. 1059 – 1069, 2010. View Article