Journal of Fluid Flow, Heat and Mass Transfer (JFFHMT)
ISSN: 2368-6111

Volume 8 - Year 2021 - Pages 262-274
DOI: 10.11159/jffhmt.2021.028
Numerical Investigation of the Optimization of PV-System Performances Using a Composite PCM-Metal Matrix for PV-Solar Panel Cooling System
Naomie Beolle Songwe Selabi1*, Arnaud Regis Kamgue Lenwoue2, Lesly Dasilva Wandji Djouonkep3,4
1 Institute of advanced materials and Nanotechnology, Wuhan University of Science and Technology, Wuhan, 430081, China
naobelle123@wust.edu.cn
2 Department of Petroleum Engineering, Leak Resistance & Sealing Technology Research Department, National Engineering
Laboratory of Petroleum Drilling Technology, Yangtze University, Wuhan, 43010, China
regiskamgue@yahoo.fr
3 Department of Petroleum Engineering, Applied Chemistry in Oil and Gas fields, Yangtze University, Wuhan, 43010, China
4 Institute of fine organic chemistry and new organic materials, Wuhan University of Science and Technology, Wuhan, 430081, China
dasilvasilva3008@wust.edu.cn
Abstract - During the conversion of solar photovoltaic energy, the heat generated raises the temperature and results in reduced electricity conversion efficiency of the system. As the operating temperature plays a great role in the photovoltaic conversion process, cooling the operating surface is a key factor to consider in achieving higher efficiency. Numerical investigation using composite phase change materials (PCMs) in photovoltaic-cooling (PV-cooling) system was adopted in this study. Selected materials such as CaCl2.6H2O, paraffin wax, RT25, RT27, SP29, n-octadecane were used as PCMs while copper, aluminium, steel, nickel, polystyrene, polychlorovinyl and polypropylene were used as composite(matrix) materials. A two-dimensional transient heat transfer model based on enthalpy approach developed by computational Fluid Dynamics (CFD-Ansys-Fluent software) was utilized for optimization and enhancing the energy conversion efficiency. The numerical results showed that RT25 sphere has good compatibility with PV-cooling system, and the thermal conductivity barely had a significant value on PV-temperature for larger values, excepted for very low thermal conductivity materials such as plastics.
Keywords: PCMs; polymers; PV-cooling, Numerical model.
© Copyright 2021 Authors - This is an Open Access article published under the Creative Commons Attribution License terms Creative Commons Attribution License terms. Unrestricted use, distribution, and reproduction in any medium are permitted, provided the original work is properly cited.
Date Received: 2021-12-06
Date Accepted: 2021-12-13
Date Published: 2021-12-15
1. Introduction
The planet is warming, from North Pole to South Pole. Since 1906, alarm and utmost concern that human activities have caused around 1.5°C of global warming to date and these impacts are already being felt in every region of the globe.[1,2] According to the 21st climatic summit from Intergovernmental Panel on Climate Change (IPCC), this sudden variation in ambient temperature will be a great fatality for the planet if it persists. Following the Paris agreement signed by 196 states, resolutions were taken to prevent a rise in temperatures beyond 2 °C compared to the pre-industrial era, and if possible 1.5 °C in order to limit the damage.[3] To achieve this goal, greenhouse gas emissions should be significantly reduced by employing efficient industrial techniques on one hand, and maximizing the use of renewable energies at the expense of fossil fuels on the other. Renewable energy sources is generally defined as “energy obtained from the continuous or repetitive currents on energy recurring in the natural environment” or as “energy flows which are replenished at the same rate as they are used”.[4] Among these energies, we have biomass energy from organic animal or plant residue, wind energy source from wind and solar energy from the sun. Solar (photovoltaic) is the most widely available and renewable form of energy source in the current era due to its facile energy conversion efficiency. Photovoltaic (solar cells) are electronic devices that convert sunlight directly into electricity.[5] The photovoltaic solar is an ancient technology, which was first discovered by the scientist Edmond Becquerel in 1839.[6] In 1882, Charles fritts made the first attempt of a working solar cell with thin sheets of selenium, coated with gold. It was later in 1900s that mass production and industrialization of solar photovoltaics really took off. On April 1954, the physician Gerald Pearson and the chemist Calvin Fuller at Bell Laboratories both demonstrated the first practical silicon solar cell with a 4% energy conversion efficiency and later achieved 11% efficiency upon optimization.[7] However, converting solar energy into electrical energy has a major drawback, which arises from the difficulty in controlling the rapid temperature increase in cells, which lowers the cells conversion capacities especially in northern regions. In order to make photovoltaics a more mainstream and pragmatic energy source, the efficiency of solar panels need to be radically improved. In 1975, Telkes applied for the first time a phase change materials (PCMs) technology for energy storage. He demonstrated that PCMs could absorb or “grasp” energy during the melt/solidification process. Aware of the enormous potential PCMs could offer for efficient energy extraction, the latter rapidly became very attractive in solar applications, especially photovoltaic solar panels. Amount the PV-cooling technology classify by Chandel and al.,[8] the PV-PCMs cooling technology is of high interest due to their ability to delay the temperature rise in cell-panels without any form energy dissipation, were the heat stored can be reused and recycled further enhancing the system efficiency.[9]
Several works on numerical investigation of the photovoltaic PCMs system are summarized; Cellura et al.,[10] made a theoretical analysis by using COMSOL MULTIPHYSICS a partial differential equations (PDEs) solver to simulate the thermal behaviour of the PV-PCM system to improve the efficiency of the system. Meanwhile Biwole et al.,[11] used the Computational Fluid Dynamics (CFD) software model to simulate the thermo-physical properties of PCMs in PV-system. They added the PCMs at the back of the solar panel, which efficiently maintain the PV cells temperature below 40 °C for period of 2 h. Xiang et al.,[12] on the other hand used a hydride system with air in between PCMs to cool the PV cell and increase the conversion efficiency, and stored the energy for other applications. Khanna et al.,[13] use ANSYS software to study the effect of fin thinness, length and the spacing between two fins. Additionally, they also studied the effect of the operating conditions (wind azimuth angle i.e. wind direction, wind velocity, melting temperature of PCMs and ambient temperature) on the PV cells. Their system was able to maintain the PV-cell temperature below 30 °C for approximatively 4 h. Saedodin et al.,[14] during their investigation improved and optimized the fins used in PV cells by filling the solar collector with porous metal foam achieving an efficiency increase of more than 2%. Recently Sarthe et al.,[15] investigated the effect of variation in the angle of inclination of PV-PCM system. They observed a decrease in the time required for PCMs melting process, and an increase of the PV surface temperature.
The aim of this work is to propose a new model compactible with composite PCMs to cool the PV-cells to improve the efficiency of PV-system. In this investigation, we used the ANSYS Fluent software to numerically investigate the thermo-physical properties of the PV-cooling system with integrated composite PCMs for optimal energy conversions.
2. Experimental Model and Numerical Equation
In this study, four types of surface are described as shown on Fig.1. The first is the PV-panel surface composed of glass, silicon, teldar, EVA in sky blue; the second is the composite materials surfaces in dark orange; third the PCM surface in violet and fourth the aluminium box in brown colour. The aluminium box container is a mixture of PCMs and other solid material. The PCM is introduced into the solid material during its fabrication period. Gamma (γ) represents the inclination angle of the system. The symmetry boundary condition was applied at the top and bottom of the aluminium box, and the backside was thermally insulated. The following boundary conditions were considered:
- The initial temperature of the system is ambient (Tamb)
- Because the energy is adsorbed at the silicon surface, the effect of the radiation is applied at the glass layer where emissivity (εt) the rear surfaces of the system have respectively the values h;
- The variations in the thermal properties of the PCM are independent of the temperature. However, the solid and liquid phases are different.
- The properties of the PCM in solid and liquid phases were homogeneous and isotropic and inside the melted PCM, the flow was considered incompressible and laminar.
- The radiation condition is applied at the top and bottom of the PV with emissivity εt and εb.
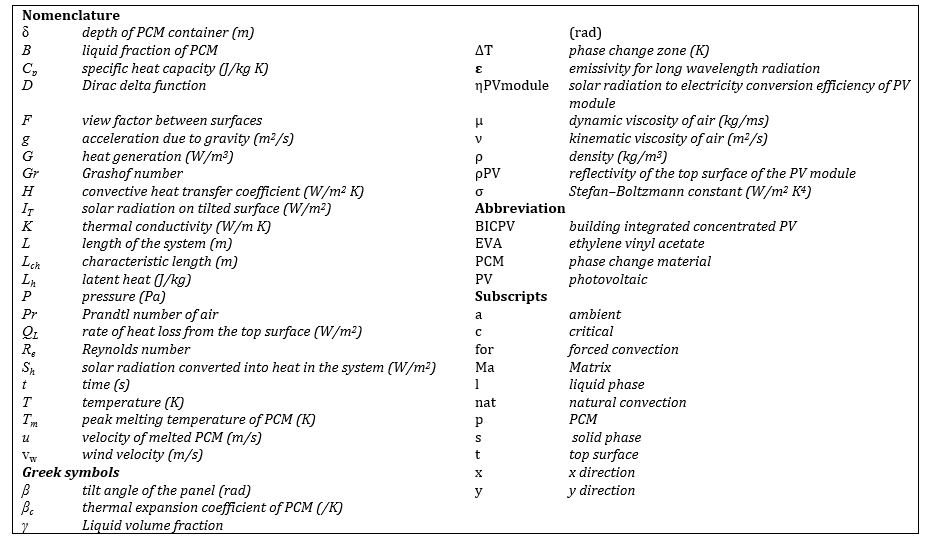
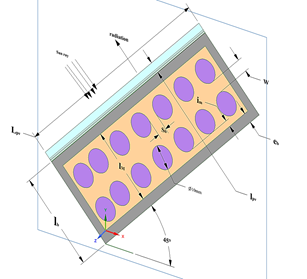
Table 1: Parameters of the model
|
Parameter |
Value |
Parameter |
Value |
|
Lpv (PV-length) |
1m |
Eg ( glass thickness) |
3mm |
|
Im (PCM-box) interval |
2.5mm |
EE (EVA thickness) |
1mm |
|
Sb (interval between 2PCM bowl) |
5mm |
Et (Teldar thickness) |
0.1mm |
|
lpv (PV width) |
4.4mm |
Es (Silicon thickness) |
0.3mm |
|
lb (matrix width) |
30mm |
εb |
0.91 |
|
W (space between PCM bowl row) |
5mm |
εt |
0.85 |
|
eb (box thickness) |
4mm |
γ |
45o |
|
|
|
Number of PCM bowl |
132 |
2. The aluminium box filled with composite material: PCM spherical bowls / metal
Here the PCM is introduced during the fabrication process into the cavities of a rectangular box (1000mm x 38mm x 4mm) whose walls are made of aluminium so the interior is a concrete made of metal, melted at high temperature and hardened at room temperature. The amount of PCM in the box represents 22-67% by surface.
The 2-D unsteady equations governing the energy and momentum of heat transfer are solved using the simple implicit finite volume method with fluent 2020 R1. Additionally, the Boussinesq approximation was adopted to account for the change in density of the PCM in liquid phase as a function of temperature.
Due to the reflection of the PV, the entire sun-base radiation incidence ray that arrives at the surface of the PV (IT) is not converted into energy. A fraction (ρPVIT) was lost due to reflection and the rest (1 - ρPV)IT was absorbed by the system. Part of the absorbed radiation is converted into electricity and the rest (Sh) dissipated as heat.

![]() is the solar radiation to electricity conversion efficiency of the PV module. Considering that, the main contribution to the energy stored by the system owes only to the PCM, the stored energy (QS) at time interval is given by equation 2:[16]
is the solar radiation to electricity conversion efficiency of the PV module. Considering that, the main contribution to the energy stored by the system owes only to the PCM, the stored energy (QS) at time interval is given by equation 2:[16]
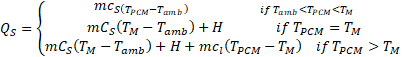
Where Tm is the melting temperature, TPCM is the PCM temperature, H the latent heat of fusion of the PCM, Tamb the ambient temperature. The complete balance of energy of the system is writing as:

TP is the PV cell average temperature, and Ul the overall heat transfer coefficient.
The inclination angle of the system was set at 45° based on Khanna et al.,[17] studies. The Nussle (Nu) and the Rayleigh (Ra) number at the top and bottom of the PV can be written as follow; equation 4:
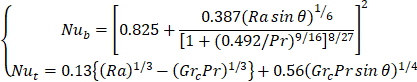
where Pr is the Prandtl number of air, Grc is the critical Grashof number = ![]() and Ra is the Rayleigh number, which is given by:
and Ra is the Rayleigh number, which is given by:
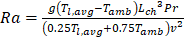
Where v (m/s) can be define as the velocity.
3. PCM system equation
The liquid fraction varies mildly and continuously across the mushy region. This mushy zone is described by the governing equations to express the phase change phenomena.

where ρ is the density in kg/m3 and u the speed in m/s. The conservation of the momentum is given by:

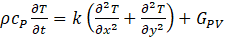
Where v is the kinematic viscosity (m2/s), p is the pressure in the fluid (Pa) starting from Eq (6) and Eq (7) and considering that, there is heat conversion during the phase change, the heat equations can be expressed by:
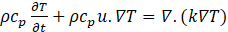
Cp Specific heat capacity (J/kg. K), k: thermal conductivity of the material (W/m. K), T: temperature of the heat carrier fluid (K).
During the phase change process, Eq (9) can express k[18] as follows:

kl and ks are the thermal conductivity of the material at the solid and liquid state. , are dimensionless constants expressed with respect to the liquid volume fraction of PCM during the phase change expressed by Eq (10):

γ : liquid volume fraction in the PCM. Which is a function of temperature and is defined by the system of Eq (11) below, equation (11):
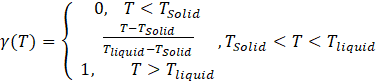
While using Eq (11) above, F can be expressed as a function of γ; Where F is the acting force on the cylinder during the heat transfer process:[19]

Where c=0.001 is a small computational constant used to avoid division by zero, and A is a constant reflecting the morphology of the melting front. This constant is a large number, usually 104 - 107. Here a value of A=105 has been used. Cp is a temperature dependent variable, expressed by Eq (13):[20]
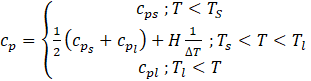
The portion where the PCM temperature is solid and liquid can be expressed as Ts=Tm –ΔT/2 and Tl=Tm +ΔT/2, ΔT is the phase change region of the material.
3.1 Solid system (PV, aluminium box and composite material)
The temperature of any i layer of the PV, aluminum box with the composite material in x and y direction, at any time is defined by:
The boundary conditions are:
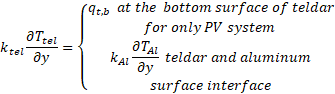
 At the top of glass surface,
 For PV surface interface,
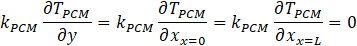
At normal y-axis interfaces of aluminum and composite material, the equation is given by:
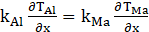
At interface of aluminum and composite material surface normal to x-axis, the equation is denoted by:
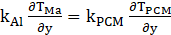
At interface of aluminum and PCM surface normal to y-axis, we have equation (20):
Where T=Tamb at t=0
The rate of heat loss from the bottom and the sidewalls was considered zero (no heat loss) due to the perfect insulation given by equation (21):
4. Solution method and validation
4. 1. Method
ANSYS Fluent R1 was utilized to study the behavior of the PV-panel temperature in the PV-composite PCM system. The bowls of PCMs have circular holes with radius of 4-7mm, placed at a distance range of 1-7mm from one another. Simulation are performed for the geometry of PV-composite-PCM constructed by separating bodies (glass, EVA, silicon, teldar, aluminum, composite layer and PCM ball) with quadratic grid of independent sizes 1mm×1mm. CFD code based on the pressure-velocity coupling is accounted by a SIMPLE algorithm whereas residuals of the energy, continuity and velocity were chosen as 10-8, 10-6,10-6 respectively with 13057nodes. Both organics and inorganics PCMs, thermoplastic and metal materials were used in this investigation. Six PCMs were selected with melting temperature in the range of 26±3°C and one with 53°C. Thermal properties of PCMs and the solid matrix are given in Table (2 and 3). Additionally, four metals and four polymeric materials were selected for the matrix phase.
4. 2. Validation method
Khanna et al.,[13] used fins aligned vertically inside the aluminum PCM (RT25) container to enhance the heat and improve the thermal performance of PV-panel.
Table 1: Thermo-physical properties of PCM
|
Properties |
SP29[18-19] |
RT27[23] |
RT25[24] |
n-Octadecane[25] |
Parafine Wax[26-27] |
CaCl2.6H2O[26][28] |
|
Thermal conductivity (W.m/K) solid/liquid |
0.6 |
0.24/0.15 |
0.19/ 0.18 |
0.35/0.149 |
0.29 0.21 |
1.09 0.54 |
|
Heat storage capacity (kJ/kg.K) solid/liquid |
2.00 |
2.4/1.8 |
1.8 / 2.4 |
1.934/2.196 |
1.77 |
1.46/ 2.13 |
|
Melting temperature ( 0C) |
29 |
300 |
26.6 |
27.2 |
53.3 |
29 |
|
Latent heat (kJ/kg) |
200 |
178 |
232 |
245 |
164 |
200 |
|
Density (kg/m3) Solid/Liquid |
1550 /1500 |
870/760 |
785/749 |
814/775 |
822 |
1710 |
|
Viscosity (kg/m.s) Solid/ liquid |
0.00184 |
0.0342 |
1.8×10⁵/ 0.001798 |
5×10⁻⁶ |
0.13 mm.s-2 |
2.2×10⁻² |
Table 2: Thermo-physicals properties of metals and thermoplastic
|
Properties-metal |
Copper[29] |
Steel [30] |
Aluminum[13] |
Nickel[29] |
|
Density (kg/m3) |
8960 |
8030 |
2675 |
8890 |
|
Thermal conductivity (W. m/K) |
401 |
16.27 |
900 |
70 |
|
Heat storage capacity (kJ/kg. K) |
385 |
502.48 |
211 |
456 |
|
Properties-thermoplastic |
PVC[31] |
Resin epoxy[23] |
Polystyrene[32] |
Polypropylene[33] |
|
Density (kg/m3) |
1300 |
1147 |
1045 |
900 |
|
Thermal conductivity (W. m/K) |
0.19 |
0.19 |
0.14 |
0.16 |
|
Heat storage capacity (J/kg. K) |
1000 |
1300 |
1250 |
1700 |
|
PV materials |
Glass |
Teldar |
Silicon |
EVA |
|
Density (kg/m3) |
3000 |
1200 |
2330 |
960 |
|
Thermal conductivity (W. m/K) |
1.8 |
0.2 |
148 |
0.35 |
|
Heat storage capacity (kJ/kg. K) |
500 |
1250 |
680 |
2100 |
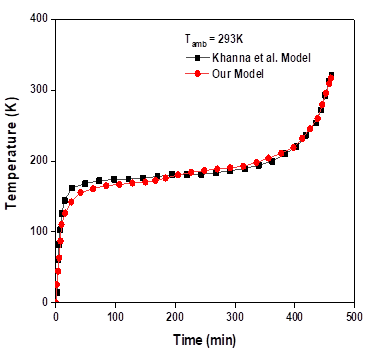
The length (LPV), the depth (lb) and the thickness (eb) of the aluminum box were taken as 1m, 30mm and 4mm respectively. The inclination angle of the system, the ambient temperature, the incident radiation and the solar radiation absorption coefficient were all chosen as 45o, 293K, 750W/m2 and 0.9 respectively. The emissivity for radiation from top and bottom and the heat loss coefficients from front and back of the system were taken as 0.85, 0.91, 10W/m2K and 5W/m2K respectively. The other outer walls of the system were considered totally insulated. They plotted the variation of temperature of the PV-panel of the system against time. To verify and validate the model of work; the equations were solved by taking into consideration similar parameters. The variation of PV-panel temperature with time is represented in Fig. 2 along with their values. According to the calculations, the results differ from the original work within the range of ±1.5°C. Further, the results show temperature stabilization in the interval (20min ˂t˂ 360 min), and increases afterwards.
Zagrouba et al.,[34] had reported the similar trend but their average stabilization interval was lesser that work represented here. The average PV panel temperature in the PV-composite PCM is represent in Fig 2.
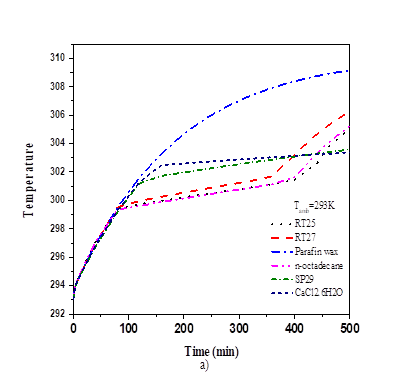
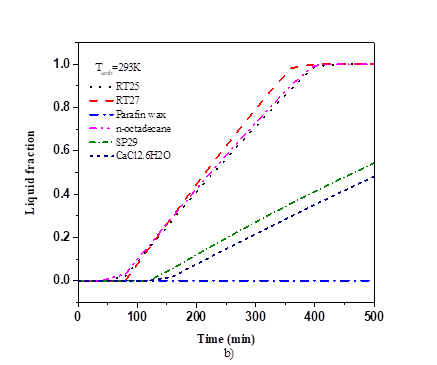
Huang et al.,[35] investigated the study of thermal performance of the PCMs in a rectangular aluminium box with RT25. The length (L) and the depth (δ) of the PCM container were 132mm and 40mm respectively. The thickness of the aluminum plates of both front and back of the PCM layer was 4.5mm. The incident radiation (IT) and the ambient temperature (Tamb) were 750W/ m2 and 20°C respectively. Here, the front and back of the system were uninsulated while the other outer walls were. The results were reported in a plot of variations in temperature of the front surface of the system with respect to time. Using these current model parameters, we compared our experimental findings, and the calculations was done with Ansys-fluent R1. Simulations were done with different value of the Mushy coefficient, the residuals of the energy, continuity and velocity, were given as 10-5, 10 -8 and 10-6 respectively. The variation of temperature on the frontal surface with time was plotted in Fig. 3(a,b) along with the experimentally values. The results differ slightly from the original work within the range of ±1°C. Similarly, we observed that the temperature is stabilized between the intervals (40-160 min), beyond which, it again starts going up.
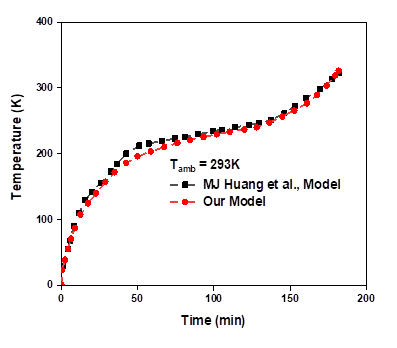
a)
b)
5. Result and discussion
In order to analyze the performances of the PV-matrix-PCM system, the effect of the thermal properties of PCM and matrix materials was considered.
The initial temperature of the system was assumed to be 293K, the flux radiation at the surface of the PV 750W/m2 and the heat transfer coefficient at the front and back of the PV 10W.m-2.K-1 and 5W.m-2.K-1 respectively. Upon numerical calculations, it is observed that for various types of heat exchanger matrix materials, we actually get different specific heat, thermal conductivity and density with different PCMs, coupled with their effects on melt fraction within 300min interval. To display the effect of the diameter and thickness of PCM spheres on the PV-temperature, simulations were also made for different dimension of PCM sphere.
Table 3: Melting fraction and PV-temperature with
|
Time CaCl2.6H2O |
N-Octadececane |
Paraffin max |
SP29 |
RT25 |
RT27 |
|||||||||
|
Name of Resin |
min |
T(K) |
f |
T(k) |
f |
T(K) |
f |
T(K) |
f |
T(K) |
f |
T(K) |
f |
|
|
Resin |
300 |
305.822 |
0.4338 |
307.563 |
0.76495 |
311.879 |
0 |
306.170 |
0.513615 |
307.651 |
0.851381 |
308.168 |
0.88326 |
|
|
PVC |
300 |
305.880 |
0.4443 |
307.699 |
0.77938 |
312.086 |
0 |
306.265 |
0.525514 |
307.795 |
0.865852 |
308.324 |
0.89824 |
|
|
PP |
300 |
306.059 |
0.4224 |
307.829 |
0.74266 |
312.006 |
0 |
306.392 |
0.500049 |
307.922 |
0.827421 |
308.419 |
0.85848 |
|
|
PS |
300 |
306.327 |
0.4254 |
308.202 |
0.74165 |
312.373 |
0 |
306.681 |
0.502554 |
308.293 |
0.825847 |
308.806 |
0.85796 |
|
|
Steel |
300 |
302.493 |
0.3565 |
301.869 |
0.80534 |
306.613 |
0 |
302.466 |
0.431653 |
301.896 |
0.913741 |
302.394 |
0.93790 |
|
|
Al |
300 |
302.566 |
0.4595 |
302.208 |
0.95655 |
308.379 |
0 |
302.617 |
0.560522 |
303.078 |
1 |
304.000 |
1 |
|
|
Copper |
300 |
302.46 |
0.4085 |
301.779 |
0.89444 |
307.235 |
0 |
302.457 |
0.481499 |
301.929 |
0.998124 |
302.733 |
1 |
|
|
Nickel |
300 |
302.389 |
0.3566 |
301.686 |
0.81503 |
306.515 |
0 |
302.391 |
0.431431 |
301.673 |
0.931524 |
302.187 |
0.95614 |
|
5. 1. Effect of the thermal properties of matrix material and PCMs on PV-temperature
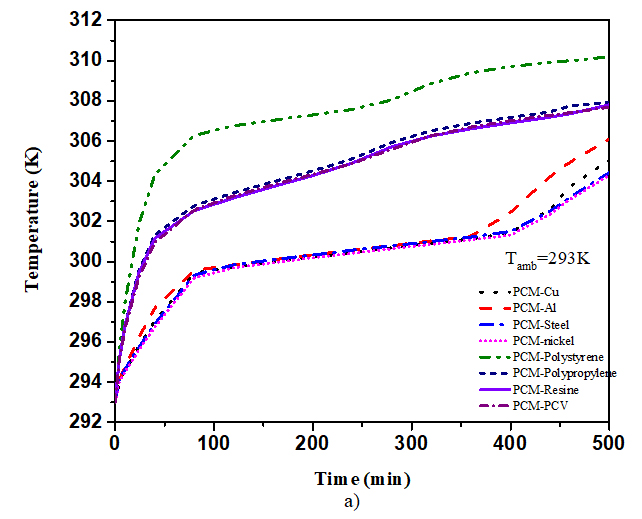
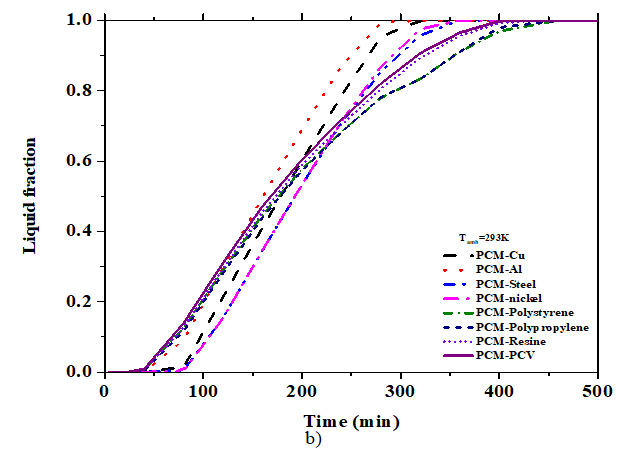
Calculations were carried out for six PCMs with different materials including 4 plastics (polymeric) materials (resin, PVC, PP and PS) and 4 metals (steel, aluminium, copper and nickel) in order to investigate the effect of the thermo-physical properties of the matrix. From table 3, the numerical results of the PV temperature, and melting fraction were presented with various material within 300 min. When the value of the thermal conductivity of the matrix increases, the value of PV-temperature and melting fraction increases as well. The values of PV-temperature and melting fractions for plastics materials are equal due to their simultaneous thermal conductivity range. The continuous PV-temperature and melting fraction with time were plotted in Fig. 4 and Fig. 5. For six PCMs including copper and for eight composite materials including RT25. For copper material, stabilization time of PV-temperature was 320min, RT25 at lower temperature (301,93K, 0.998), while it was 340min for CaCl2.6H2O with little higher temperature (302.46K) and low melting fraction (0.408). No stabilization is observed with paraffin wax. Fig. 4 and Table 4, show that RT25 display good compatibility with the cooling system. The PV-temperature of the system was low and the melting fraction high when compared to the other PCMs under the same condition. From this, we observed the significant contribution effect of thermos-physical properties of PCMs on PV-temperature. For RT25 as PCM the time taken to complete melting was 325min at temperature 302.4991K, for copper it was 0.82 at 308.2938K, same with polystyrene within the same interval. The comparison of PV-temperature for various matrix materials within 500min is also plotted in Fig. 5. It is observed that the temperature with copper is stabilized for as long at low PV-temperature compared with polystyrene due to the effect of difference in the thermal conductivity. Aluminium and steel showed good tend of stabilization.
Fig. 5 above shows that the effect of thermal conductivity of matrix for plastics materials was dominant when the value of the melting fraction was low. No significant contribution on the melting fraction and PV-temperature is observe for the increase in thermal conductivity value up to 15W/m.K. Nevertheless, the PV cell temperature is higher when the matrix is from plastic material providing an efficient alternative way to re-value plastics materials because their stabilization time interval is longer than that of metal-based matrix.
5.2. Effect of thickness of the matrix on PV-temperature
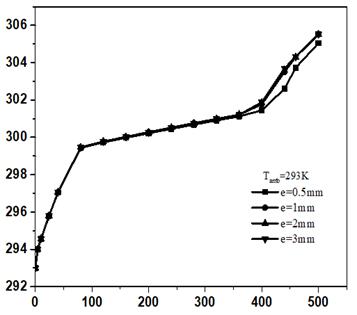
The thickness effect was studied for various matrix materials with RT25 holding thickness of 0.5, 1.2 and 3mm respectively. Fig. 6 represents the effect of matrix material thickness on PV-temperature.
Here, when the value of the thickness increases, the PV-temperature increases too. For copper, the temperature was 302.6K with 0.5mm thickness, while it was 303.5K, 303.6K and 303.7K for 1mm, 2mm, and 3mm thickness respectively in 450min. The PV-temperature increases with the thickness of the matrix but the increase is not so obvious. It is clear from the figure that matrix thickness has little effect on PV-temperature.
5.3. Effect of diameter of PCM sphere
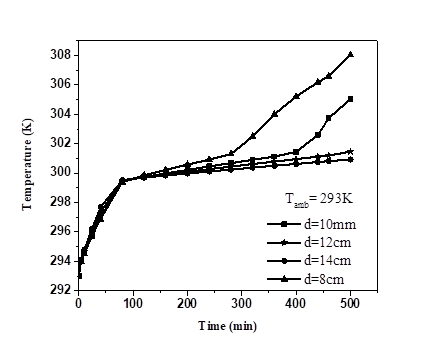
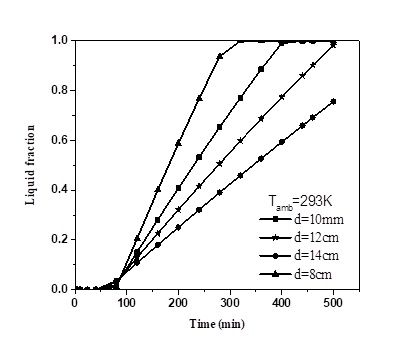
In this section, the effect of diameter of PCM spheres on the PV-temperature was studied. Calculation of the best PCM (RT25) with 8, 10, 12 and 14mm diameter respectively was plotted in Fig. 7. Increasing the diameter causes a decrease of PV-temperature and extend the stabilization interval, while decreasing the melting fraction.
The PV-temperature and melting fraction was (302.5K; 1) with 8mm diameter, while it was (300.9K; 0.7712), (300.6K; 0.59761), (300.4K; 0.45882) for 10mm, 12mm and 14mm diameter respectively within 300min interval. The difference of PV-temperature was not too high compared with the melting fraction. From Fig. 7 above, the diameter of PCM sphere have great effect on PV-temperature and melting fraction. We can also assumed that the larger the diameter of the sphere, the larger the interval of stabilization temperatures.
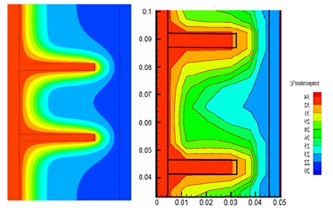
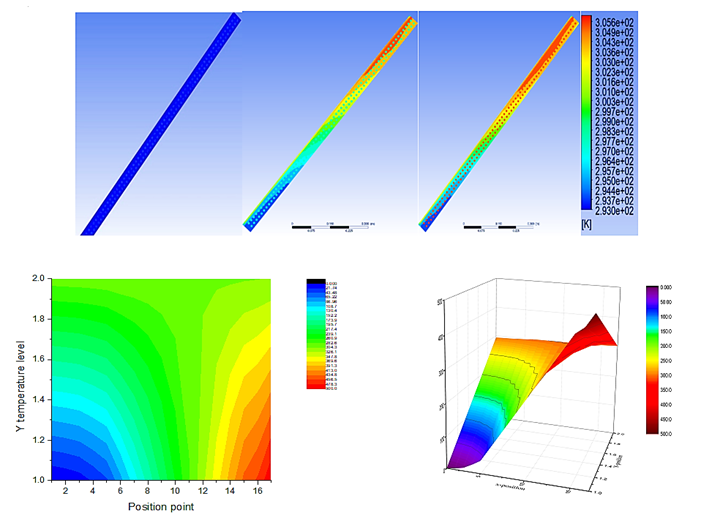
5.4. Temperature distribution
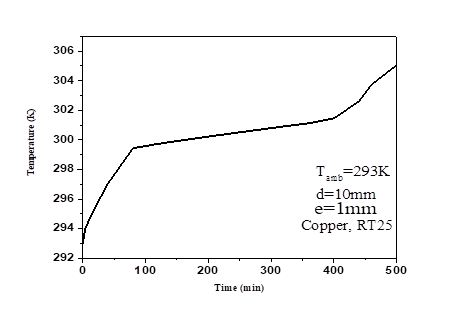
The evolution the temperature of the matrix-PV-PCM system was plotted in Fig. 8 and the temperature distribution of the whole system is presented in Fig. 9. Initially, the PV-temperature increase until it reached the saturate value and remains constant for a significant amount of time and increase further beyond this point. This rapid increase it observe at the beginning because the rate of heat extraction by PCM is low due to its solid phase [13].
PV temperature remains constant when PCM starts to melt and increase gradually once the melting process is over because the PCM stores all the energy and absorbed the latent heat, as shown from Fig. 9(b) large space with green color represent the stabilization interval of PV-temperature.
6. Conclusion
A two-dimensional theoretical model based on enthalpy formulation coupled implicit finite difference method were developed to analyze the performance of PV Matrix-PCM system. A second order continuous differentiable function was utilized for the transition of the PCMs. The model was compared and validated with current research findings, showing the effect of PCM sphere diameter, matrix materials, thermal conductivity and the thickness on PV-temperature. In this investigation, two key factors should be considered which are the selection of the PCMs with optimum thermal conductivity and the melting temperature of PCMs. These are of major importance because they have a considerable effect on PV-temperature. Furthermore, PV-temperature decreases with the thermal conductivity of PCMs, meanwhile the melting fraction increases. The effect of thickness of the PCMs on PV-temperature is negligible; contrary to PCMs sphere diameter, which had a significant effect on PV-temperature and melting fraction. Finally, application of PCMs in PV-cooling system could be a suitable way to stabilize PV temperature for optimization of the energy conversion efficiency. The diameter of PCMs sphere, matrix material (metal or plastic) needed to be selected carefully in order to optimize the stabilization time and improve the performance of PV panels.
Acknowledgment:
We thank the Silk Road foundation of China and Wuhan University of Science and Technology via the Hubei Provincial Foundation Council.
Declaration of Competing Interest:
The authors declare that they have no known competing financial interests or personal relationships that could have influenced the work reported in this paper.
Funding:
This research did not receive any specific grant from funding agencies in the public, commercial, or not-for-profit sectors.
References
[1] Karmalkar A. V, Bradley R. S. Consequences of global warming of 1.5 °C and 2 °C for regional temperature and precipitation changes in the contiguous United States. PLoS ONE 12(1) (2017):e0168697. View Article
[2] Gabriele C. H, Stefan B, Tim C, Andrew R. F, Ed Hawkins, Carley I, Wolfgang M, Andrew S, Sabine U. Causes of climate change over the historical record. Environmental Research Letters, 14, 123006 (2019). View Article
[3] Keywan R, Shilpa R, Volker K, Cheolhung C, Vadim C, Guenther F, Georg K, Nebojsa N, Peter R. A scenario of comparatively high greenhouse gas emissions. Climatic Change 109, 33 (2011). View Article
[4] El Chaar, L., lamont, L. A., & El Zein, N. Review of photovoltaic technologies. Renewable and Sustainable Energy Reviews, 15(5), 2165–2175 (2011). View Article
[5] Mugdha V. D, Bhavana B, Moharil S. V. Solar photovoltaic technology: A review of different types of solar cells and its future trends. International Conference on Research Frontiers in Sciences (ICRFS 2021); Journal of Physics: Conference Series, 1913 012053 (2021). View Article
[6] Parida B, Iniyan S, Goic R. (2011). A review of solar photovoltaic technologies. Renewable and Sustainable Energy Reviews, 15(3), 1625–1636. View Article
[7] Christopher J. R. Solar energy: principles and possibilities, Science Progress, 93(1), 37–112 (2010). View Article
[8] Chandel S. S, Agarwal T. Review of cooling techniques using phase change materials for enhancing efficiency of photovoltaic power systems. Renewable and Sustainable Energy Reviews, 73, 1342–1351 (2017). View Article
[9] Benlekkam M L, Nehari D, Habib Y. M. N Numerical Performances Study of Curved Photovoltaic Panel Integrated with Phase Change Material. Mechanics and Mechanical Engineering, 22(4), 1439–1451 (2018). View Article
[10] Cellura M, Ciulla G, Lo Brano V, Marvuglia A, Orioli A. 582. A Photovoltaic panel coupled with a phase changing material heat-storage system in hot climates. PLEA 2008 – 25th Conference on Passive and Low Energy Architecture, Dublin, 22nd to 24th October 2008 View Article
[11] Biwole P, Eclache P, Kuznik F. Improving the performance of solar panels by the use of phase-change materials. World renewable energy congress-Sweden Linköping, 8-13 (2011).
[12] Xiang Y, Gan G. Optimization of building-integrated photovoltaic thermal air system combined with thermal storage. International Journal of Low-Carbon Technologies, 10(2), 146–156 (2015). View Article
[13] Khanna S, Reddy K. S, Mallick T. K. Optimization of finned solar photovoltaic phase change material (finned PV PCM) system. International Journal of Thermal Sciences, 130, 313–322 (2018). View Article
[14] Saedodin S, Zamzamian S. A. H, Nimvari M. E, Wongwises S, Jouybari H. J. Performance evaluation of a flat-plate solar collector filled with porous metal 2 foam: Experimental and numerical analysis. Energy Conversion and Management, 153, 278–287 (2017). View Article
[15] Sathe T, Dhoble A. S, Sandeep J, Mangrulkar C, Choudhari V. G. Numerical Investigations of Photovoltaic Phase Change Materials System with Different Inclination Angles. Advances in Mechanical Engineering (B), (2021).
[16] Hussein M. M, Mohamed A. S. A, Amany M. F, Ahmed A. A. S. Performance augmentation of PV panels using phase change material cooling technique: A review. SVU-International Journal of Engineering Sciences and Applications 2(2): 1-13 (2021). View Article
[17] Khanna S, Reddy K. S, Mallick T. K. Climatic behavior of solar photovoltaic integrated with phase change material. Energy Conversion and Management, 166, 590–601 (2018). View Article
[18] Kim Y, Hossain A, Kim S, Nakamur Y. A Numerical Study on Time-Dependent Melting and Deformation Processes of Phase Change Material (PCM) Induced by Localized Thermal Input. Two Phase Flow, Phase Change and Numerical Modeling (2011). View Article
[19] Bertrand O, Binet B, Combeau H, Couturier S, Delannoy Y, Gobin D, Vieira G. Melting driven by natural convection. A comparison exercise: first results. International Journal of Thermal Sciences, 38(1), 5–26 (1999). View Article
[20] Galione, P., Pérez-Segarra, C., Rodríguez, I., Torras, S., & Rigola, J. Numerical Evaluation of Multi-layered Solid-PCM Thermocline-like Tanks as Thermal Energy Storage Systems for CSP Applications. Energy Procedia, 69, 832–841(2015). View Article
[21] Zeinelabdein R, Omer S, Gan G. Critical review of latent heat storage systems for free cooling in buildings. Renewable and Sustainable Energy Reviews, 82, 2843–2868 (2018). View Article
[22] Ahmad H, Hassan H, Shaimaa A, Ali A, Mohammed O. H.. Comparative Effectiveness of Different Phase Change Materials to Improve Cooling Performance of Heat Sinks for Electronic Devices. Applied Science 6(9) 226 (2016). View Article
[23] Aadmi M, Karkri M, El Hammouti M. Heat transfer characteristics of thermal energy storage for PCM (phase change material) melting in horizontal tube: Numerical and experimental investigations. Energy, 85, 339–352(2015). View Article
[24] Agyekum E. B, PraveenKumar S, Alwan N. T, Velkin V. I, Shcheklein S. E. Effect of dual surface cooling of solar photovoltaic panel on the efficiency of the module: experimental investigation. Heliyon, 7(9), e07920 (2021). View Article
[25] Kant K, Shukla A, Sharma A, Biwole P. H. Melting and solidification behavior of phase change materials with cyclic heating and cooling. Journal of Energy Storage, 15, 274–282 (2018). View Article
[26] Chang R. C, Atul S. Numerical Investigation of Melt Fraction of PCMs in a Latent Heat Storage System. Journal of Engineering and Applied Sciences, 1: 437-444 (2006). View Article
[27] Kahwaji S, Johnson M. B, Kheirabadi A. C, Groulx D, White M. A. A comprehensive study of properties of paraffin phase change materials for solar thermal energy storage and thermal management applications. Energy, 162, 1169–1182 (2018). View Article
[28] Yanadori M, Masuda T. Heat transfer study on a heat storage container with a phase change material. (Part 2. Heat transfer in the melting process in a cylindrical heat storage container). Solar Energy, 42(1), 27–34 (1989). View Article
[29] Tian Y, Zhao C. Y. A numerical investigation of heat transfer in phase change materials (PCMs) embedded in porous metals. Energy, 36(9), 5539–5546 (2011). View Article
[30] Bouzennada T, Mechighel F, Filali A, Ghachem K, Kolsi L. Numerical investigation of heat transfer and melting process in a PCM capsule: Effects of inner tube position and Stefan number. Case Studies in Thermal Engineering, 27, 101306 (2021). View Article
[31] Puertas A, Romero-Cano M, De Las Nieves F, Rosiek S, Batlles F. Simulations of Melting of Encapsulated CaCl2·6H2O for Thermal Energy Storage Technologies. Energies, 10(4), 568 (2017). View Article
[32] Belov G. V, Dyachkov S. A, Levashov P. R, Lomonosov I. V, Minakov D. V, Morozov I. V, Sineva M. A, Smirnov V. N. The IVTANTHERMO-Online database for thermodynamic properties of individual substances with web interface. IOP Conference Series: Journal of Physics: Conference Series 946 (2018) 012120. View Article
[33] Szczepaniak R, Rudzki R, Janaszkiewicz D. Analysis of modelling capabilities of phase transitions of the first Kind in hydrated sodium acetate. Proceedings of the International Conference on Heat Transfer and Fluid Flow Prague, Czech Republic, 83 (2014).
[34] Zagrouba M, Sellami A, Bouaïcha M, Ksouri M. Identification of PV solar cells and modules parameters using the genetic algorithms: Application to maximum power extraction. Solar Energy, 84(5), 860–866 (2010). View Article
[35] Huang X, Han S, Huang W, Liu X. Enhancing solar cell efficiency: the search for luminescent materials as spectral converters. Chemical Society Reviews, 42(1), 173–201(2013). View Article