Journal of Fluid Flow, Heat and Mass Transfer (JFFHMT)
ISSN: 2368-6111

Volume 8 - Year 2021 - Pages 189-198
DOI: 10.11159/jffhmt.2021.021
Numerical and Experimental Investigation of Flow Maldistribution due to Blockage in Microstructured Heat Exchanger
Sahba Sadir1, Christoph Spiegel2, Wolfgang Augustin2, Stephan Scholl2, Manfred Kraut1
1Karlsruhe Institute of Technology, Institute for Micro Process Engineering
Hermann-von-Helmholtz-Platz 1, 76344 Eggenstein-Leopoldshafen, Germany
sahba.sadir@kit.edu; manfred.kraut@kit.edu
2Technische Universität Braunschweig, Institute for Chemical and Thermal Process Engineering
Langer Kamp 7, 38106 Braunschweig, Germany
christoph.spiegel@tu-braunschweig.de; w.augustin@tu-braunschweig.de; s.scholl@tu-braunschweig.de
Abstract - Microstructured heat exchangers typically comprise a number of parallel microchannels with inlet and outlet headers. The uniformity of flow rates among the parallel microchannels is governed by the field of fluid pressure in the system. This contribution presents, three dimensional (3D) CFD simulations performed using OpenFOAM (Open-Source Field Operation and Manipulation) by employing simpleFOAM solver to investigate flow distribution in an array of four parallel microchannels with a hydraulic diameter of 500 µm each. The working fluid is water and an incompressible, single-phase flow is assumed. The mal-distribution is induced by complete or partial blockage of single microchannels in different scenarios. Both number of blocked microchannels and position of the blockage inside the channel array are altered.
The results show the effects of induced blockage on the fluid flow distribution in the parallel microchannels. The standard deviation of flow distribution not only depends on the total number of the blocked microchannels but also on their position inside the flow array. For validating CFD results, pressure drop and flow distribution are also investigated through various experiments. Therefore, pressure drop measurements for different scenarios are conducted. A good agreement between simulation and ex-periment is observed. Simulation studies reveal that the free cross-section is not the governing criterion for both flow distri¬bution and heat exchange. Fouling on the hot surface more strongly influences the outlet temperature than completely blocked channels.
The contribution shows that even with a relatively simple model, interesting effects in microstructured heat exchangers can be found, allowing for a deeper understanding of the specific properties of micro structures.
Keywords: Blockage Scenarios, CFD Simulation, Fouling, Flow Maldistribution, Microstructured Heat Exchanger
© Copyright 2021 Authors - This is an Open Access article published under the Creative Commons Attribution License terms Creative Commons Attribution License terms. Unrestricted use, distribution, and reproduction in any medium are permitted, provided the original work is properly cited.
Date Received: 2021-01-15
Date Accepted: 2021-01-18
Date Published: 2021-04-16
1. Introduction
Microstructured heat exchangers provide high heat exchange capability due to their great surface area to volume ratio. They typically comprise a number of parallel flow channels with appropriate inlet and outlet headers for flow distribution. Differences in both flow channel geometry and header configuration have a great effect on the fluid flow and heat transfer characteristics of micro channel systems [1]. The microstructure properties of the channels introduce a couple of potential problems directly connected to the reduced hydraulic diameter of the resulting flow paths. Problems such as fouling issues, blockage phenomena and consequently flow maldistribution within the heat exchanger greatly influence the thermal and hydraulic performance of the apparatus [2]. Overcoming the negative aspects of fouling in flow systems is one of the biggest challenges for this technology [3]. Since fouling will change the original geometry of the flow path during operation, it is not sufficient to optimize the flow distributors for clean cases, as has been done before [4 - 6]. Therefore, the investigation of possible flow maldistribution due to partial or complete blockage of single flow paths is mandatory to understand and predict the fluid dynamic and thermal behavior of microstructured heat exchangers [7].
Several models were proposed in the past to predict flow maldistribution in a range of differently scaled flow channels from macro via milli to micro structures [8 - 10]. Nevertheless, these models struggle to predict flow maldistribution in parallel microstructured channels, since they neglect the frictional effects through the microchannels itself as well as effects of the inlet and outlet headers [11]. Several experimental and computational studies were conducted more recently to understand the flow distribution in parallel microstructures in both adiabatic and non-adiabatic conditions [12 – 14].
The work presented in this contribution investigated the effects of blockage phenomena in terms of fluid dynamic and thermal behavior of a microstructured heat exchanger built with four parallel microchannels. Both full blocked as well as partially blocked scenarios with a varying number of affected microchannels were evaluated. To study these effects a CDF simulation using OpenFOAM along with a modified simpleFOAM solver was set up and validated with several experiments.
2. Experimental Setup
To validate the computational modelling and the results obtained from CFD simulations, several experiments were conducted first to receive data for different scenarios. The experimental setup is an improved iteration of the experimental setup described in detail in [7]. Figure 1 provides the process flow diagram of the test rig. All experiments were conducted with deionized water as process fluid.
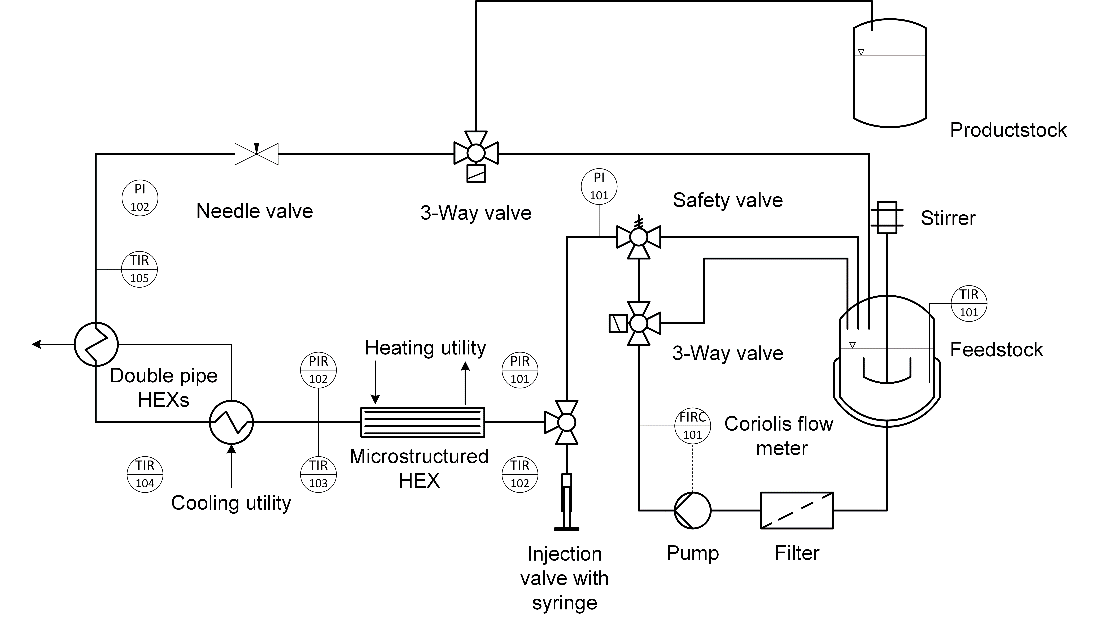
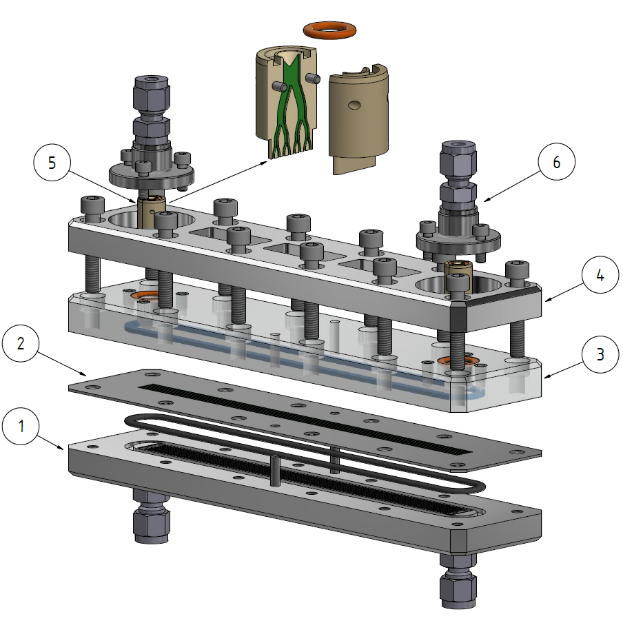
Figure 2 shows an explosion draft of the used microstructured heat exchanger. Besides the modular design this device allows a direct optical inspection of the flow inside the microchannels. All microchannels share the same base geometry with a squared cross-section of 0.5 x 0.5 mm² and length of 185 mm.
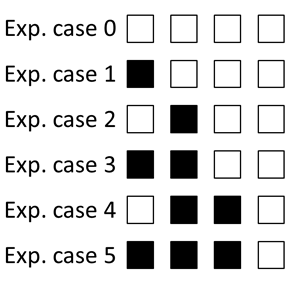
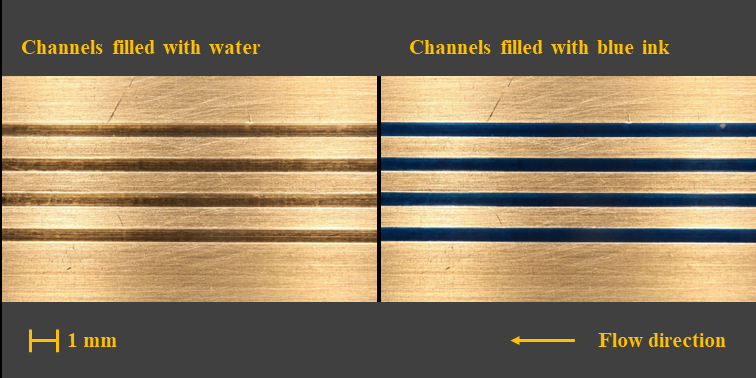
All experiments were conducted with one microstructured foil with four parallel microchannels. To realize different scenarios the actual number of free channels was varied, according to Figure 3, by blocking selected channels on purpose with silicone rubber mastic. To exclude flow cross contamination, as described in previous publications [7], and to ensure a complete blockage of the chosen microchannels, a blue color tracer was set before each experiment. Figure 4 demonstrates an example of the optical inspection before and after the application of the color tracer for experimental case 0, showing no cross flow between adjacent microchannels.
For each of the experimental cases discussed before, the overall pressure drop was investigated under isothermal conditions. The total mass flow for the pressure drop experiments was set to 100 g min-1 while the process fluid temperature was kept constant at 293.15 K. In addition, a later experiment with case 0 configuration focused on the transferred heat, respectively the process fluid outlet temperature. The set parameters of this experiment are shown in Table 1. Each experimental value is the mean value of three distinct measuring campaigns at steady state conditions.
Table 1. Process parameters of the heat transfer experiment.
| Parameter | Value |
| Number of free microchannels | 4 |
| Process fluid inlet temperature [K] | 313.15 |
| Wall temperature [K] | 363.15 |
| Total mass flow rate [g min-1] | 100 |
| Flow velocity per channel [m s-1] | 1.69 |
| Channel Reynolds Number | 1750 |
3. Numerical Approach and Model Development
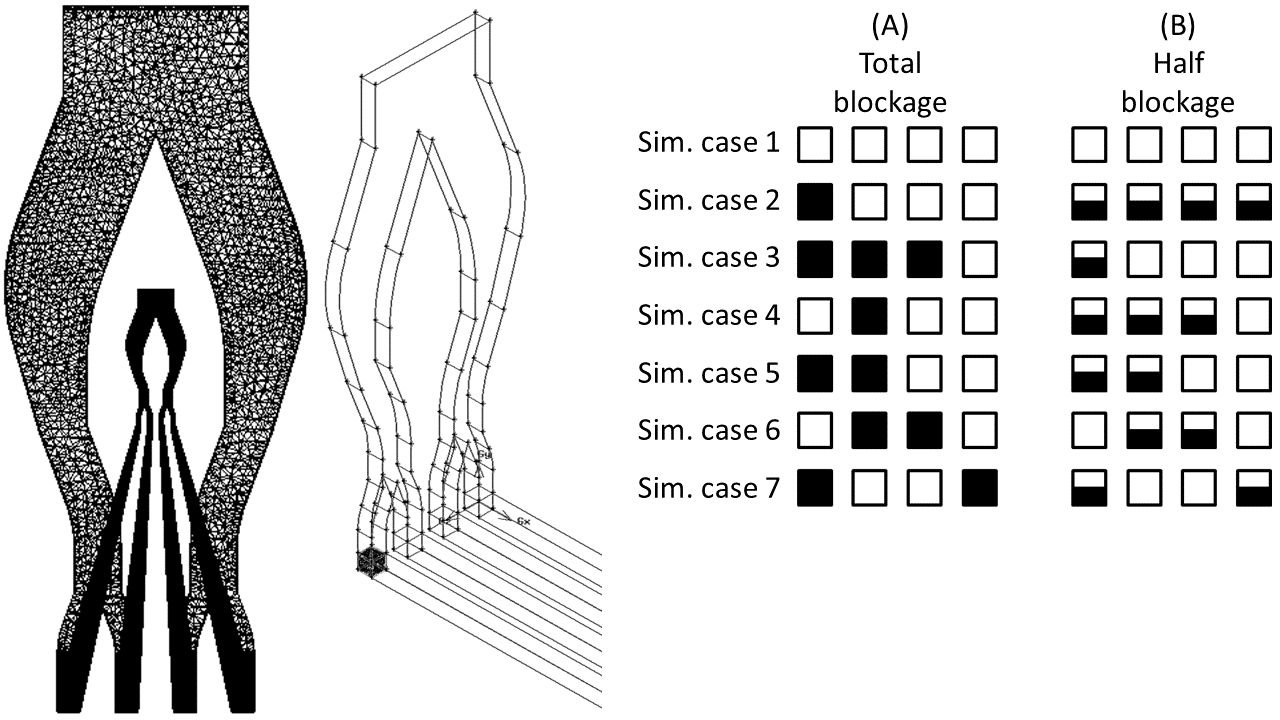
To simulate the described microstructured heat exchanger, four parallel microchannels as well as two corresponding flow distributors were modelled as three-dimensional bodies for further fluid flow and heat transfer analysis. Figure 5 provides an impression of the geometrical configuration and the investigated simulation scenarios. It is worth noting that the defined experimental cases for validation purposes (cf. section 2) differ from the investigated simulation cases. Two categories were defined: (A) total blockage scenarios, (B) half blockage scenarios. Besides six different scenarios per category a clean reference case was investigated. The effects of these blockages in terms of overall pressure drop, flow and temperature distribution were determined in this study.
To analyze the overall pressure drop behavior, the fluid flow as well as the heat transfer characteristics in the considered microstructured heat exchanger, a CFD simulation based on OpenFOAM was applied. A finite volume approach is employed to obtain the flow and temperature distributions in the microchannels. The more complex flow distributors were meshed in ANSYS Fluent. To ensure grid integrity, an independence study with a varying number of grid cells was carried out. As a result, 383,600 to 1,600,000 structured hexahedrons were used to mesh the four parallel microchannels, whereas 35,000 unstructured tetrahedrons were used to mesh the flow distributors. The varying number of cells is directly related to the investigated blockage scenarios and the number of free microchannels.
In order to analyze the heat transfer, the standard solver simpleFOAM was modified by implementing energy conservation. Both the momentum and energy conservation equations were discretized by a second order upwind scheme. The coupling between the pressure and velocity is implemented by SIMPLEC algorithm. The solutions were considered to be converged if normalized residual values were less than 10−6 for the energy equation and less than 10−3 for all other variables respectively.
For modelling the fluid flow and heat transfer in the considered microstructured heat exchanger several assumptions were made: (1) apparatus reached steady state conditions; (2) incompressible fluid; (3) laminar flow model for Re < 1500; (4) Kω SST flow model for Re > 1500. Consequently, mass, momentum and energy balance were defined according to the following equations:

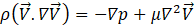
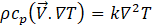
These equations were solved along with the boundary conditions and temperature dependent physical properties of water to obtain fluid velocity and temperature distributions along the microchannels. Thus, further calculations can be done to determine the behavior of the heat exchanger in terms of overall pressure drop and thermal performance at different blockage scenarios. For each simulation the overall mass flow rate and the corresponding linear flow velocity per channel as well as the inlet temperature of the process fluid was given as boundary conditions. Heat is only provided through the bottom surface of each microchannel. All other walls were assumed to be isolated. In case of half blockage scenarios the thermal conductivity of the fouling layer is considered additionally. The heat flux through the bottom wall of the microchannels was calculated according to eq. 4. Table 2 provides the initial physical properties of the process fluid as well as the set values of the solid materials.

Table 2. Initial physical properties for simulation scenarios.
| Parameter | Value |
| Water mass flow rate [g min-1] | 100 |
| Water inlet temperature [K] | 293.15 |
| Water density [kg m-3] | 998.2 |
| Water specific heat capacity [J kg-1 K -1] | 4182 |
| Water thermal conductivity [W m-1 K -1] | 0.6 |
| Water kinematic viscosity [m² s-1] | 1.0∙10-6 |
| Wall temperature [K] | 363.15 |
| Steel thermal conductivity [W m-1 K -1] | 15 |
| Layer thermal conductivity [W m-1 K -1] | 0.65 |
4. Result and Discussion
4.1. Model Validation
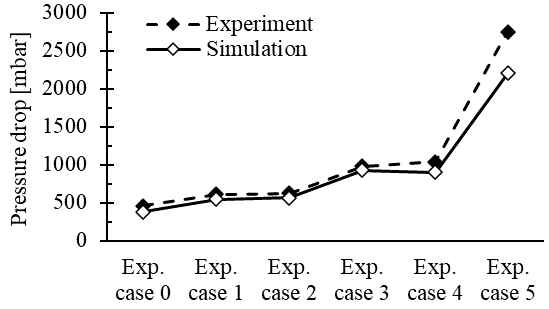
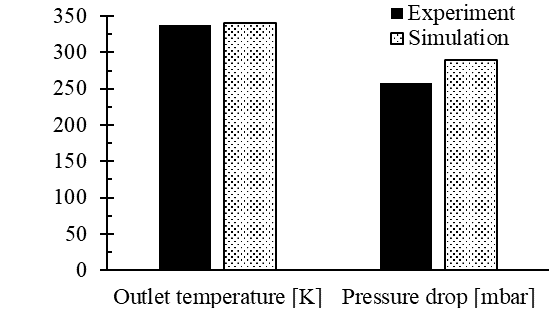
To prove the quality of the performed CFD simulation and the modified solver, experimental validation is essential. Therefore, several validation experiments were conducted (cf. section 2). Figure 6 shows a comparison between computed and experimental results, for the cases according to Figure 3. The measured values of the pressure drop at isothermal conditions at 293.15 K is slightly higher for the investigated scenarios. The relative error of all cases is below 20 % and around 10 % for most cases. The heat transferring experiment (cf. Table 1) reveals a good match between the obtained results with a relative error of below 1 % for the outlet temperature. Overall, simulated and measured results show a high agreement.
4.2. Simulation Results for Completely Blocked Channels
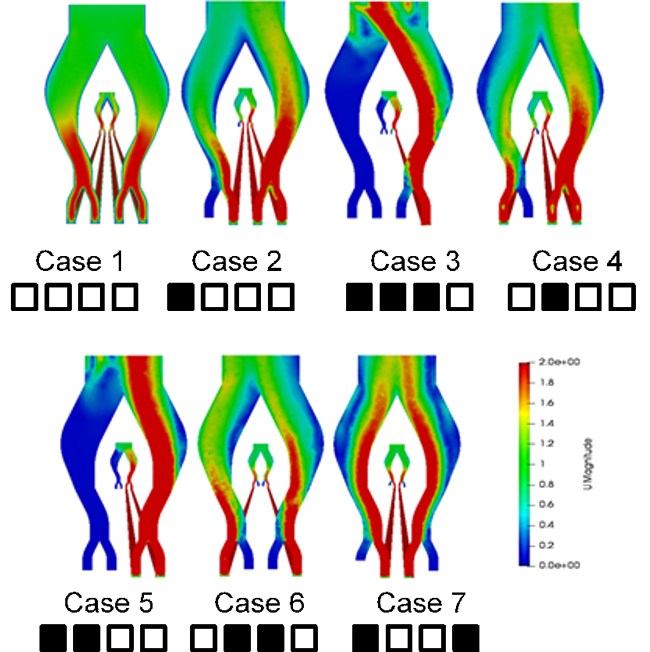
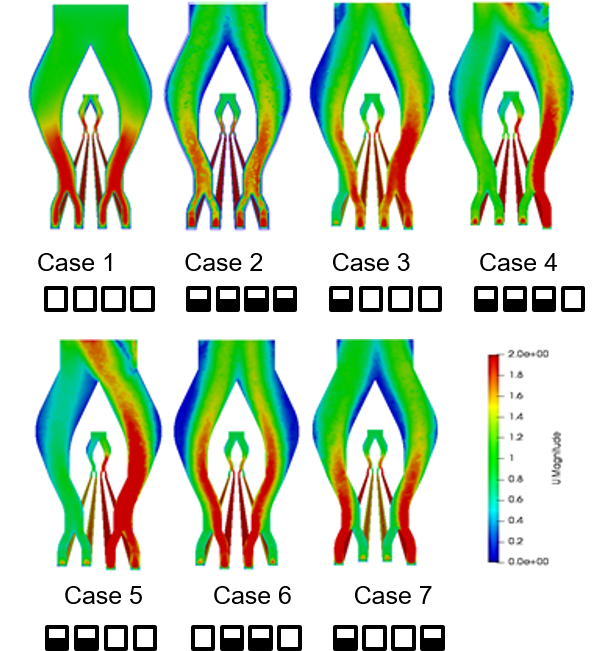
The simulated results in terms of flow velocity and temperature distribution in the inlet and outlet flow distributors as well as the four microchannels are shown in Figure 7 for all cases of category A. As expected, the flow velocity and temperature distribution become non-uniform due to the blockage of various microchannels.
Since the pressure drop in the microchannels is considerably higher than the pressure drop of the distribution system, the difference in mass flow in the remaining channels is quite low. For a single blocked channel, this can be seen when comparing case 2 and case 4 (cf. Figure 8). However, the form of the distributor has an influence on the flow, which it is remarkable. The blocked inner channel of case 4 leads to equal values for the two adjacent channels of the other distribution branch, while in case 2 the distribution in the other branch shows small, but discernible differences. No such differences are seen for cases 5 to 7 having two blocked channels.
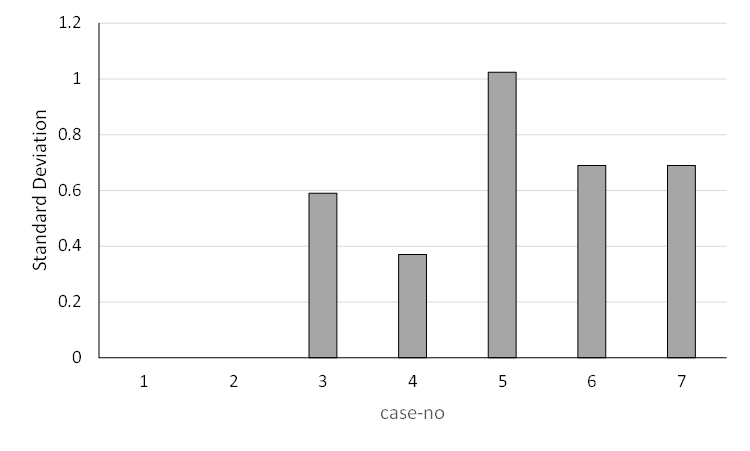
In order to evaluate the flow maldistribution, the average flow velocity, temperature and pressure drop in each microchannel were calculated by using numerical data. The standard deviation with respect to mass flow rates was used to evaluate the obtained results. It is defined as,
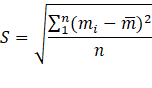
where mi and are the local mass flow rate of each channel and the overall averaged mass flow rate of all microchannels respectively, whereas n is the number of channels. Note, if the standard deviation is small, the mass flow distribution is rather uniform in the microchannel system.
An evaluation of case 1 reveals that the flow distributors are working well in clean case scenario, since no discernible maldistribution occurs.
The analysis of the obtained results for the other scenarios in terms of mass flow per remaining channel (Figure 8) and standard deviation (Figure 9) shows the expected tendencies. Case 3 has the strongest deviation, since the mass flow is restricted to a single microchannel, while the cases 5 to 7, with two blocked channels each, show the same behavior and mass flow for each channel and each investigated configuration.
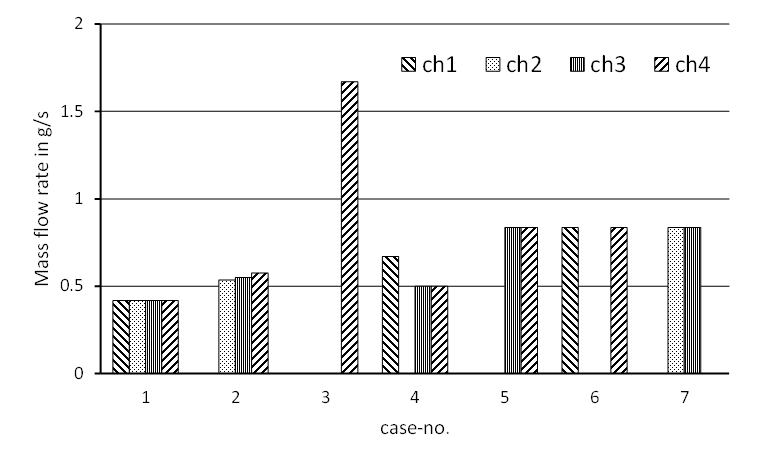
The same effect on the distribution for a single blocked channel (case 2 and case 4) is also visible in Figure 10 for the heat transfer study, described latter. Figure 9 shows that the mass flow in the same branch is identical for cases with a blocked inner microchannel (case 4), while a difference in mass flow in the same branch occurs if an outer channel is blocked (case 2). It clearly indicates that the flow form in the distributor is of very high importance. However, the characterization of the distributor was not core of this study, but will be taken up in future work. As expected, the pressure drop per channel is increasing with an increasing flow rate.
The flow distribution also affects the heat exchange among the channels and thus the outlet temperature as depicted in Figure 10. The loss of heat transferring area leads to overall lower outlet temperatures. Specific heat transfer depends on the actual flow conditions in the channels, and is increasing with flow rate.
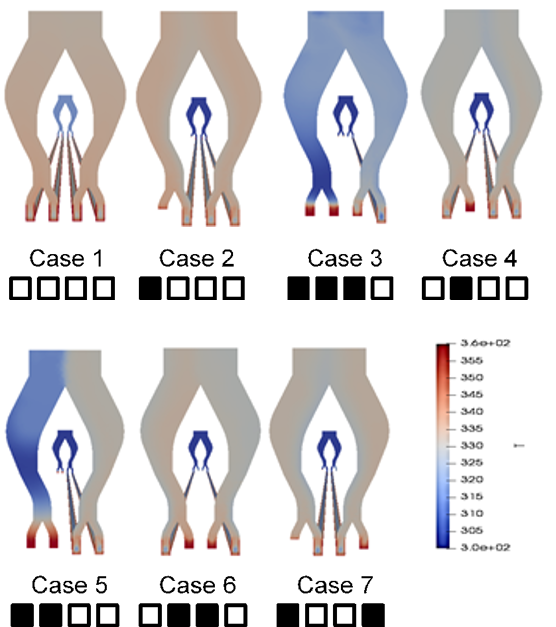
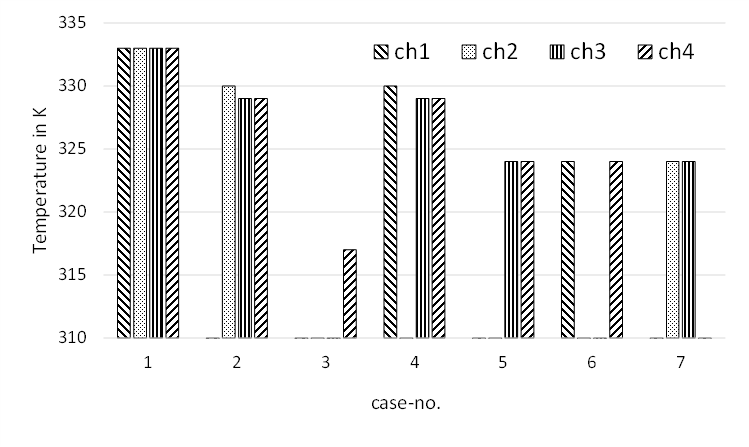
Therefore, it is possible to distinguish between different scenarios, by analyzing the channel outlet temperatures (cf. Figure 11). The mean temperatures of the microchannels for all cases are given in Table 3.
Table 3. Mean outlet temperatures in K for all category A scenarios.
| Case | 1 | 2 | 3 | 4 | 5 | 6 | 7 |
| Tout | 333.0 | 329.3 | 317.0 | 329.4 | 324.0 | 324.0 | 324.0 |
Figure 11 shows the comparison of the achieved results. Interesting are again case 2 and case 4. In those cases, the difference in mass flow through the channels is the reason for different outlet temperatures. For cases 5 to 7, which are cases with two blocked channels, identical values were found.
4.3 Simulation Results for Half-Blocked Channels
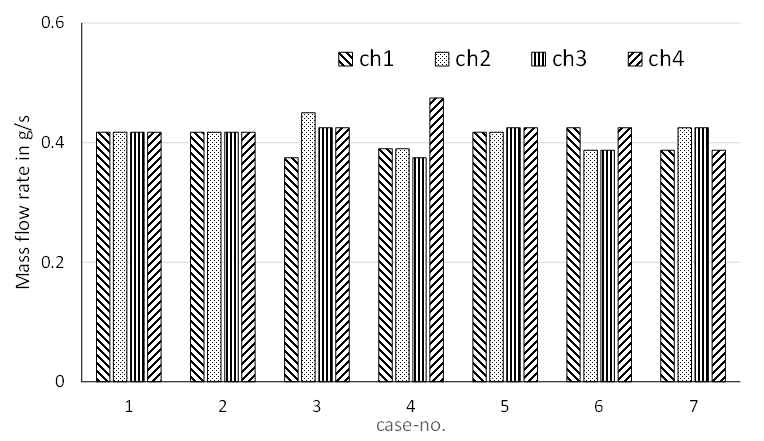
A second set of simulations focused on several cases with partially blocked microchannels (category B). The obtained results are displayed in Figure 12.
The mass flow rates for each channel are much less affected in comparison to the completely blocked scenarios. However, it is remarkable that the flow is varying by approximately 10 % between channels if the remaining cross-section is halved (cf. Figure 13).
Looking at the pressure drop over the channels, as shown in Figure 14, it becomes clear that a balance is struck between the hydraulic diameter and the velocity. In case of a half-blocked channel, the hydraulic diameter is reduced from 0.5 mm to 0.333 mm. As the aspect ratio of the microchannel geometry is altered from 1 to 2, the cross-sectional area is halved, whereas the hydraulic diameter of the microchannel is only diminished by a third. When blocking microchannels, the flow velocity is increased and hence results in an also increased pressure drop. A comparison between case 2 and case 1 underlines this correlation. The overall pressure drop of four half-blocked microchannels (case 2) is more than doubled in reference to the overall pressure drop of four clean microchannels (case 1).
The variation in standard deviation from the mean mass flow, as shown in Figure 15, is much less variable than the variation of standard deviation for complete blocked microchannels (cf. Figure 9) due to the previously discussed effects.
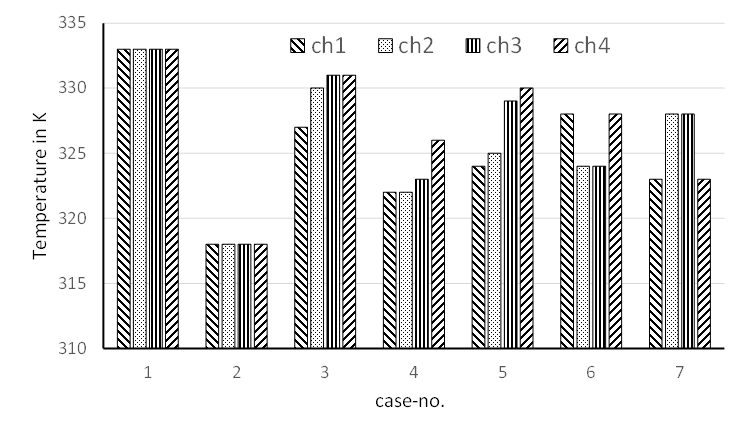
The flow is directly coupled to the heat transfer results. On contrary to cases with completly blocked mircochannels the heat transfering area is not diminished, only the apparent wall temperature is reduced according to the heat conductivity of the fouling layer. Outlet temperatures as shown in Table 4 and Figure 16 are consequently lower in direct comparison to the already discussed category A scenarios.
Table 4. Mean outlet temperatures in K for all category B scenarios.
| Case | 1 | 2 | 3 | 4 | 5 | 6 | 7 |
| Tout | 333.0 | 318.0 | 331.0 | 323.5 | 329.5 | 328.0 | 328.0 |
Since the mass flow through the whole channel array was kept constant, the mean outlet temperature is directly proportional to the amount of transferred heat.
For each case of the category B the amount of transferred heat is less than the corresponding results of category A.
A comparision between case 2 and case 4 of category A (one blocked channel each) with cases 5 to 7 of category B (two channels half-blocked in each case), providing an identical free cross-sectional area, show similar results. Nevertheless, for partially blocked channels the variation in mass flow per channel is much lower, but the mean outlet temperature is about the same for case 5 and lower for case 6 and case 7.
A comparison of cases 5 to 7 of category A (two completely blocked channels) and case 2 of category B (four half blocked channels) reveals a decrease in mean outlet temperature. Interestingly, a half-blockage of four microchannels (category B, case 2) yields the same outlet temperature as blocking three microchannels entirely (Category A, case 3). In consequence, an estimation of the blocking effects on the heat exchanger performance is not straightforward.
5. Conclusions
Uniform flow distribution in parallel microchannels is essential for many engineering devices. However, fouling is occurring often in real life, leading to effects in both pressure drop and heat transfer efficiency. In this contribution a computational model was used to investigate the effects of fouling in an assembly of four parallel microchannels with customized flow distributors. Experiments with a various number of completely blocked microchannels were conducted and show a good agreement with the simulation.
Two different configurations were explored using a validated CFD simulation. Firstly, effects when fouling blocks whole microchannels and secondly, effects of a partial blocking of several microchannels. As boundary condition the mass flow through the channel assembly was kept constant.
As expected, the reduction of free cross-sectional area led to higher pressure drops and lower outlet temperatures. The flow form of the distributor had an effect on the distribution, even if the distributor worked excellent in the reference case of clean microchannels. For symmetrical cases in reference to the distribution branches, the flow distributor worked well also in blocked channel scenarios. However, the geometrical effect needs to be taken into account if flow uniformity is a problem in devices where blockage is expected.
Somewhat surprisingly, the mean outlet temperature was affected equally in case of four partially blocked channels as for a single free microchannel. Therefore, the mean outlet temperature cannot serve as a simple indicator about the extent of blockage.
The last conclusion is further evidenced by the variation of the outlet temperature. Here the isolating effect of the fouling layer is far more important than the reduction of the heat transferring area. For a relatively simple model interesting results were found, which should be explored further. Future work should look much deeper into the heat transfer e.g., by considering the wall area of the side walls.
Acknowledgements
This study was funded on the basis of a decision by the German Bundestag by the German Federal Ministry for Economic Affairs and Energy and supported by the Projektträger Jülich in the framework of the collaborative research project “Scalable milli and micro production technology for energy efficient, continuous manufacturing in the process industry - Mi²Pro”.
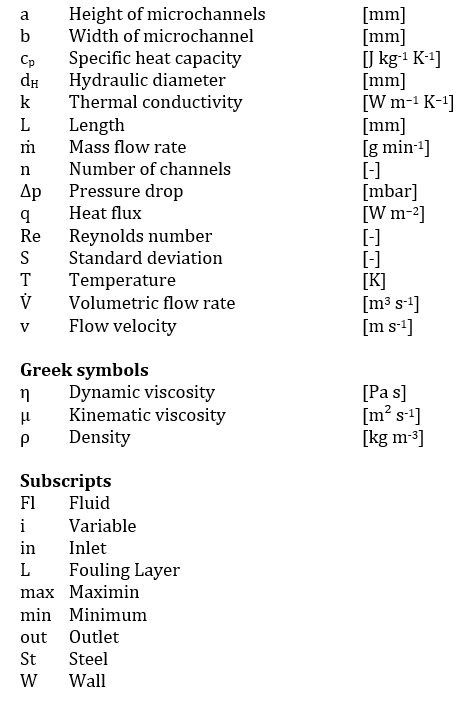
Nomenclature
References
[1] O. Brand, G. K. Fedder, C. Hierold, J. G. Korvink, and O. Tabata: Micro process engineering: fundamentals, devices, fabrication, and applications. John Wiley & Sons, 2013.
[2] M. Mayer, J. Bucko, W. Benzinger, R. Dittmeyer, W. Augustin, S. Scholl: Modeling fouling factors for microscale heat exchangers. Experimental heat transfer, vol. 28, pp. 222–243, 2015. View Article
[3] M. Schoenitz, L. Grundemann, W. Augustin, and S. Scholl: Fouling in microstructured devices: a review. Chemical Communications, vol. 51, pp. 8213–8228, 2015. View Article
[4] A. Bejan: Shape and Structure, From Engineering to Nature. Cambridge University Press Cambridge UK 2000
[5] X. Guo, Y. Fan, L. Luo: Multi-channel heat exchanger-reactor using arborescent distributors: A characterization study of fluid distribution, heat exchange performance and exothermic reaction Energy, vol. 69, pp. 728-741, 2014. View Article
[6] J. Cao, M. Kraut, R. Dittmeyer, L. Zhang, H. Xu: Numerical analysis on the effect of bifurcation angle and inlet velocity on the distribution uniformity performance of consecutive bifurcating fluid flow distributors International Communications in Heat and Mass Transfer, vol. 93, pp. 60-65, 2018. View Article
[7] C. Spiegel, M. Kraut, G. Rabsch, C. Küsters, W. Augustin, and S. Scholl: Fouling Detection in an Optically Accessible Microstructured Heat Exchanger . Chemical Engineering & Technology, vol. 42, pp. 2067–2075, 2019. View Article
[8] E. V. Rebrov, J. C. Schouten, and M. H. de Croon: Single-phase fluid flow distribution and heat transfer in microstructured reactors . Chemical Engineering Science, vol. 66, pp. 1374–1393, 2011. View Article
[9] M. K. Bassiouny and H. Martin: Flow distribution and pressure drop in plate heat exchangers - U-type arrangement . Chemical Engineering Science, vol. 39, pp. 693–700, 1984. View Article
[10] M. K. Bassiouny and H. Martin: Flow distribution and pressure drop in plate heat exchangers - Z-type arrangement . Chemical Engineering Science, vol. 39, pp. 701–704, 1984. View Article
[11] S. Maharudrayya, S. Jayanti, and A. P. Deshpande: Pressure drop and flow distribution in multiple parallel-channel configurations used in proton-exchange membrane fuel cell stacks . Journal of power sources, vol. 157, pp. 358–367, 2006. View Article
[12] V. M. Siva, A. Pattamatta, and S. Kumar Das: A numerical study of flow and temperature maldistribution in a parallel microchannel system for heat removal in microelectronic devices . ASME Journal of Thermal Science and Engineering Applications, vol. 5, pp. 41008-1 - 41008-9, 2013. View Article
[13] V. M. Siva, A. Pattamatta, and S. Kumar Das: Effect of flow maldistribution on the thermal performance of parallel microchannel cooling systems . International Journal of Heat and Mass Transfer, vol. 73, pp. 424–428, 2014. View Article
[14] S. Kumar, R. Dwivedi, and P. K. Singh: Effect of Flow Maldistribution on Thermal Performance of Water-Cooled Minichannel Heat Sink . Advances in Fluid and Thermal Engineering: Springer, 2019, pp. 43–52. View Article