Journal of Fluid Flow, Heat and Mass Transfer (JFFHMT)
ISSN: 2368-6111

Volume 8 - Year 2021 - Pages 52-59
DOI: 10.11159/jffhmt.2021.007
Effect of Different Inlet Configurations on Particle Concentration around a Patient in Cleanroom
Ali Parcheforosh1, Arash Mousemi1, Sorour A. Alotaibi2, Alireza Khademi3
1
Sharif University of Technology, Department of Mechanical Engineering
Azadi Ave, Tehran, Iran P.O. Box 11365-11155
ali.parcheforosh@mech.sharif.edu; arash.mousemi@mech.sharif.edu
2
Kuwait University, College of Engineering and Petroleum, Mechanical Engineering Department
Fourth Ring Rd, Kuwait City, Kuwait P.O. Box 5969 SAFAT 12037
sr.alotaibi@ku.edu.kw
3
Sharif University of Technology, Department of Aerospace Engineering
Azadi Ave, Tehran, Iran P.O. Box 11365-11155
khademi_alireza@ae.sharif.edu
Abstract - Indoor air technologies have been developing in recent years. In this regard, the overwhelming majority of the studies are about thermal comfort, indoor air quality, and energy consumption in residential buildings and industrial workspaces. On the other hand, indoor air quality is a significant parameter on humans' health and convenience, especially in cleanrooms. Furthermore, rooms can produce a considerable number of particles in the form of harmful organismic gases and can adversely affect the people working in there. Exploiting a clean air stream to remove inside particles and contaminations is the primary method of improving the indoor air quality. Designing an air ventilation system to remove inside particles is one of these methods. In this study, aerosol concentration for different particle dimensions and different layouts of the inlet gates in a wholly equipped cleanroom is investigated. Moreover, the average particle concentration resulting from each layout is compared. It is illustrated that the particle concentration changes with the variation of the dimension of the particles. In the next part, particle concentration on different parts of a patient's body with different inlet gates is investigated. For this purpose, four different points of the body are specified for measurements, and the particle concentration for each part is studied for particles with 0.5 μm and 5 μm diameter with different inlet gate arrangements. According to the results, a fully open gate arrangement has the best efficiency, while a diagonal layout cannot remove particles suitably. Moreover, it has been conducted that using a model patient instead of an actual patient can adversely affect the results.
Keywords: Indoor air quality, Air ventilation system, Cleanroom, Particle concentration, Experimental investigation.
© Copyright 2021 Authors - This is an Open Access article published under the Creative Commons Attribution License terms Creative Commons Attribution License terms. Unrestricted use, distribution, and reproduction in any medium are permitted, provided the original work is properly cited.
Date Received: 2020-11-22
Date Accepted: 2020-11-27
Date Published: 2021-02-03
1. Introduction
Transmission of bacteria in the air is the most influential factor in surgical site infections. According to the center for disease control (CDC), surgical site infections are the third cause of hospital infections, including 14% to 16% of hospital infections [1]. In 1999, it was estimated that a single surgical infection for each patient could make them stay for 10 days longer, which means a 5000$ increase in expenditures [2]. Surgical infections can occur up to 30 days after surgery. Generally, infections can be classified into the following categories [3]: (1) Superficial Incisional: This type takes place at the site of incision on the skin, (2) Deep Incisional: It can occur between surgical cleft and the muscle tissues, and (3) The organ of space: This kind can be created in every part of the body except on the skin and muscles—places like internal organs or spaces between them.
The scientific progress in controlling the infections includes improvements in operating room ventilation, sterilization methods, and less risky surgery techniques. Therefore, depending on patient, personnel, and operating room environmental condition, systematic methods, which are at the same time practical, are required for decreasing the risk of infections. Staphylococcus aureus is the most influential bacteria in infections at the wound site, which plays an enormous role in half of the infections [4]. Naturally being on the skin of human bodies, dead skin cells are the primary source of this bacteria that can separate from the body of personnel or patient. It has been estimated that approximately 1000 microbial carrier particles per minute can separate from the surgeon and spread through the operating room. Moreover, the lower distance between the patient and surgeon, the higher chance of getting infected. Through the past decade, various practical methods have been investigated to remove the bacteria in operating rooms, and the most effective method among them may be the fast transmission of bacteria by an air stream [5]. Particles exiting from the respiratory system can be directed to the outlet gates by creating a well-oriented air stream, and infiltration of bacteria and particles onto the bed can be barricaded by preventing the creation of air circulations.
Generally, inlet air velocity has a significant impact on the cleanroom's air quality as long as the air inlet velocity does not make residents uncomfortable, increasing circulation and indoor air condition [6, 7]. The effect of inlet and outlet gate placement on the cleanroom's airflow pattern has been investigated. This illustrated that the inlet gates' location has a significant influence on the distribution flow characteristics such as velocity, temperature, and concentration of pollutants. In contrast, the effect of the location of outlet gates is negligible [8, 9]. The effect of obstacles and equipment on the room's flow pattern has been investigated in two studies. However, due to the various applications of cleanrooms, their results are quite general [10, 11].
Understanding circulation patterns in the cleanroom is necessary to determine the distribution of particle concentration. Thus, many numerical studies have investigated the critical factors affecting particle distribution in the cleanroom, which are also called design parameters. Some examples of the most prominent studies are presented in the following. The effect of the inlet and outlet gate arrangements and the particle production source's location on particle concentration has been illustrated in two studies. It has been concluded that the mentioned parameters have a massive impact on particle concentration. Moreover, it has been conducted that forecasted concentrations are three to five times larger than measured concentrations at various positions when the emission port is placed on the floor [12, 13].
In one of the mentioned studies, the effect of particle production on particle distribution is investigated. The results showed that when the production source is moved from east to west of the room, by using a diagonal layout instead of a central arrangement, the characteristics of concentration distribution, including final efficiency and spreading radius increased from 0.6 to 2.5 and from 0.77m to 0.81m, respectively. Additionally, when the air streamline was almost the same as the pollution source path, the final efficiency had the least dependence on the pollutant path [13].
There are a few numerical studies dedicated to surgery rooms. The most important and applicable articles are as follows. The effect of the inlet and outlet valves' location and geometry and inlet velocity on airflow was investigated in a study. It was conducted that using a central air vent on the operating room bed instead of four vents beside the bed minimized the circulation areas. In addition, doing such a thing can decrease the number of contaminations on the bed and accelerated particles' movement out of the operating room without any rotational fields. It is worth mentioning that using the entire roof as the inlet gate, led to the same conclusions [14].
A simple search in the published papers demonstrates that practical research on the operating rooms in specific is scarce because of the difficulty of providing equipment, the low accuracy of the measurements and multiple error factors in the test. The airflow changes due to a cleanroom's obstacles were investigated in a study using the laser light sheet visualization system. Some of the most relevant results of this study are as following [15]: (1) When the barrier model is in contact with the wall, a standing vortex is created. Hence, to allow the particles to be removed from the room, all barriers should be taken away from the walls, (2) when two rectangular models are connected, a stagnant area is created above the surface. Hence, it is recommended to keep the barriers at greater distances from each other, (3) the turbulence effect, caused by the presence of lighting devices or special features of the ceiling valve, extends to near the surface of the earth, and the airflow beneath the model (such as the desk) is extremely turbulent and the particles cannot quickly be ejected.
In a study with more medical aspects, the effect of opening and closing the door on the room pressure and, consequently, the number of particles coming inside or going outside was investigated. In this experimental study, the concentration of particles inside and outside of the operating room was observed at the moment of opening the door, as well as the characteristics of airflow during the procedure. The results showed that opening the door led to a 3 Pa pressure gradient from inside to the outside. Also, the concentration of suspended particles near the door increased due to rotational currents. Therefore, it can be concluded that some air enters the outside of the room, although there is a positive pressure gradient from inside to the outside [16]. In many studies, the particles' diameter that can carry the bacteria is considered between 5 to 10 μm in which gravity and buoyancy forces have a considerable influence on the particles [17].
In this paper, a conventional cleanroom with all equipment is experimentally studied to investigate the impact of inlet gate arrangement on a cleanroom class and determine the particle concentration on different parts of the body. Moreover, the differences between the ordinary patient and the artificial patient are investigated. The other contributing parameters, such as inlet air mass flow rate, measuring speed, ambient pressure, and temperature, are constant.
2. Measurement Equipment
The tools needed for a standard cleanroom test include an input flow meter and a particle counter. It is common to measure velocity and multiply it by channel cross-section to measure the flow rate, which has been done in this study. For this purpose, a hand-held digital anemometer is used with a highly sensitive airflow impeller, and it can calculate the air velocity with an accuracy of 0.01 m/s. After 3 times of velocity measuring and getting the average, the inlet velocity of 0.2 m/s is reported in this test. Next, for analyzing the number of particles in the cleanroom, the ARTI company particle counter model HHPC-6 is exploited, an optical particle counter (OPC). This device can adjust the volume and time of measurement according to different standards. It can also provide particles' concentration in different units, such as the number of particles per liter or particles per cubic foot. With this counter, it is possible to count the number of particles with dimensions of 0.3, 0.5, 0.7, 1, 2, and 5 μm. In this test, each measurement's volume and time are set according to the ISO DIS standard, 2 liters, and 1 minute. Also, the concentration report unit is adjusted as particle per liter.
3. General Specification of the Cleanroom
In this study, temperature and relative humidity are considered to be 28 °C and 35%, respectively [18]. Although the optimum inlet air velocity is 0.15 m/s, an inlet air velocity of 0.2 m/s is chosen for this study due to the ventilation system's lack of flexibility [19].
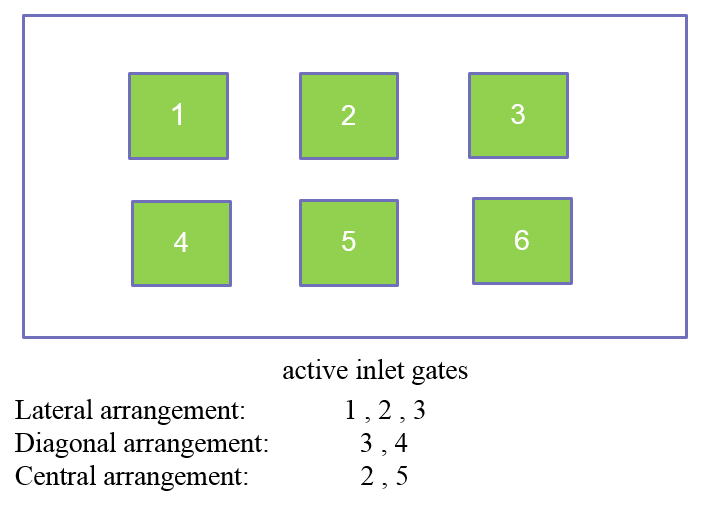
The cleanroom with six 61 cm × 61 cm inlet gates is used for this study [20]. The inlet layout can be changed by choosing different inlet gates. The mentioned room has a rectangular cross-section with an approximate dimension of 3 m × 3.5 m and a 2.5 m. Moreover, the room has five outlet gates, each of them having an area of 29 cm × 44 cm. Air inlet layout of the cleanroom is shown in Figure 1.
Eliminating the edges and, more generally, dead pockets is vital to achieving a specific cleanness level and preventing additional turbulent currents in the room. The suspended particles may remain in these areas, and high momentum turbulent air stream, which is resulted from various reasons in the room, can enter these areas and carry the particles to the mainstream of the room and adversely affect the cleanness. This principle is taken into account in this study, meaning there are no sharp edges or dead areas in this room.
Personnel change their clothes and prepare themselves for entering the cleanroom in a closed area named locker room or so-called “dirty room” in the medical science vocabulary. A compartment called the Air Shower in a dirty room, which personals go through before and after wearing their particular clothing.
Walls and floor are constructed from a compact plastic shell on an aluminum frame, and the side walls are formed by placing these frames together. For sealing of the mentioned frames, silicon or welded UPVC joints are used. Finally, the room floor is made of a one-layer monolith epoxy constructed from polyurethane's hardening against heat.
Many standards have been proposed to examine the cleanness class and how to measure it for the cleanroom. The first standard for the biological cleanroom was introduced by NASA in which criteria for the number of particles and colonies of bacteria in different classes are presented [9]. After that, the USA, UK, Switzerland, and Japan proposed operating the cleanroom. However, due to their complications, none of them were accepted on a global level. Therefore, in this study, only cleanroom standards are used to classify the mentioned operating room.
4. Results and Discussion
Choosing the experiment type can be influenced by room design, related usage, and needed a pureness level. Three different conditions can be considered for the classification of cleanrooms according to the IEST standard before the concentration test. Accordingly, cleanrooms can be assorted into built cleanrooms, rest cleanrooms, and operational ones. The first group is applied to the ones that the whole room with full equipment are ready to work, but equipment and working stuff are not present in the room while in the second group just personnel are not present, and the operational group is referred to ones in which both equipment and personnel are present [21]. Considering the mentioned classification and the test case, built mode is suitable for this investigation.
4. 1. Effect of Inlet Arrangement on Particle Concentration
In this part, the Concentration of particles with different dimensions for various inlet gate layout is investigated in a room with complete equipment. Arrangements like diagonal, central, and lateral are used regularly in cleanrooms; however, a study on full open gates layout is performed additional to the others. Figure 1 shows the particle concentration for each particle dimension with respect to the exploited layout and has the most consistency with expectations. Having short distance between inlet and outlet gates so that the air stream does not have enough time for moving the particles, lateral arrangement has more deposited particles. Regarding the mentioned argument, although, central arrangement should leave more particles than the lateral one, it can be illustrated that central arrangement has left fewer particles in the room. This is firstly due to the measurement errors in particle counter device when counting smaller aerosol particles and secondly, because of the forces acting on the particle, which can be classified as follows [5]: gravity force, buoyancy force, Brownian motion force, and the Thermophoretic forces being resulted from scalar gradients like temperature. Table 1 shows the order of magnitude among the mentioned forces.
Table 1. The order of magnitude of the different forces relative to the force of gravity in terms of particle size [22].
| Force | Particle dimension (μm) | ||
| 10-1 | 1 | 10 | |
| Order of magnitude relative to the gravity force | |||
| Gravity | 1 | 1 | 1 |
| Buoyancy | 10-2 | 10-3 | 10-3 |
| Brownian | 100.5 | 10-2 | 10-5 |
| Thermophoretic | 1 | 10-2 | 10-4 |
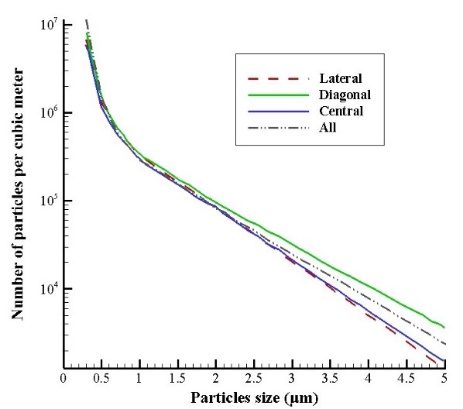
Having a maximum area for removing particles, full open gates arrangement is the best choice, which can be conspicuously illustrated from Figure 2(a). Furthermore, Figure 2(b) shows apart from the fact that diagonal layout was the worst case among others, in other cases, obtained results did not match with the expectations, such as the superiority of full open gates arrangement over the others. This phenomenon can be explained by considering the following reasons. Firstly, according to Figure 2(b), measuring equipment may not count particle numbers meticulously as its error can be increased due to particle dimensions that are too small between 0.3 up to 0.5 μm so it can adversely affect the results. Secondly, regarding Table.1, in dimensions, less than 1 μm, Brownian and Phoretic forces are increased severely and can be considered as the same level as Buoyancy force. Finally, having furniture in the room, for sure some vortexes have been created which can trap tiny particles. Having little mass, these particles do not have enough momentum to escape from the vortex's centrifugal force, so it takes a considerable amount of time for them to get rid of the vortex completely. Moreover, to better understand measured particle concentrations in various diameters, the vertical axis of Figure 3 is plotted logarithmically relative to the horizontal axis.
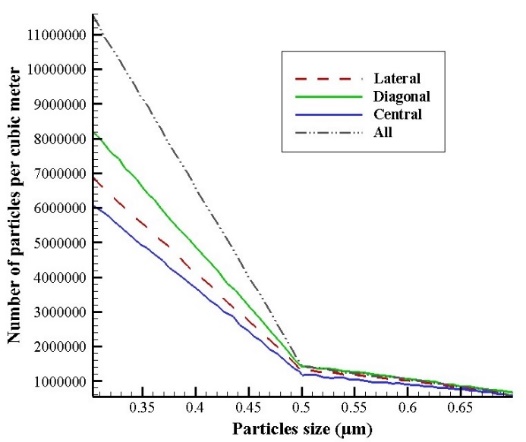 (a)
(a)
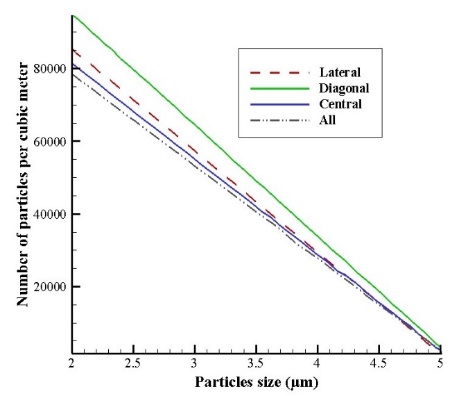 (b)
(b)
4. 2. Particle Concentration on a Model and an Actual Patient
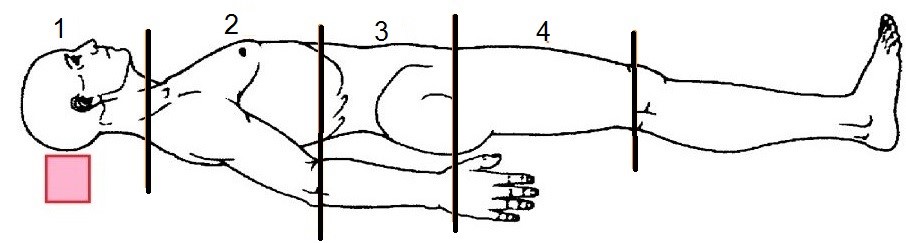
In this section, four points of a model patient's body were specified for obtaining particle concentration near the body. Moreover, the effect of changing the model patient to an actual patient is determined. Figure 4 shows the selected regions on the body to calculate the particle concentration. This selection is based on different surgery categories like head, chest, stomach, and upper legs.
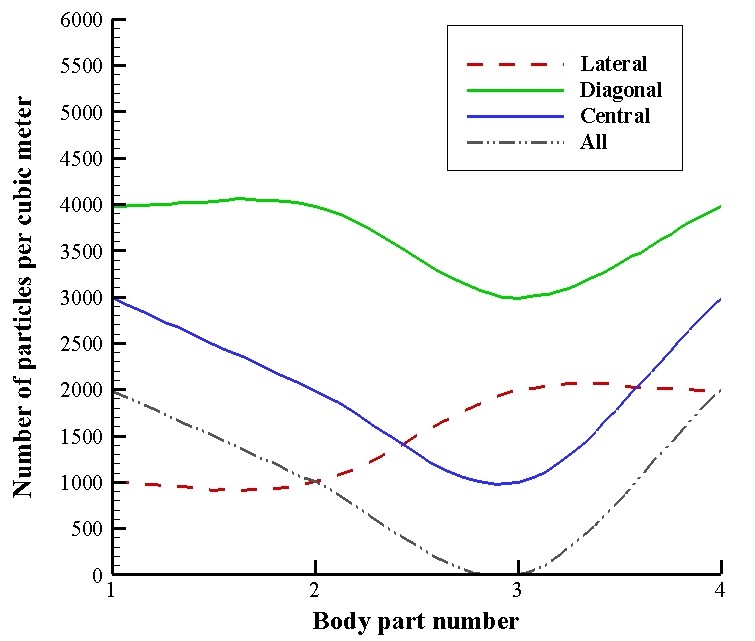
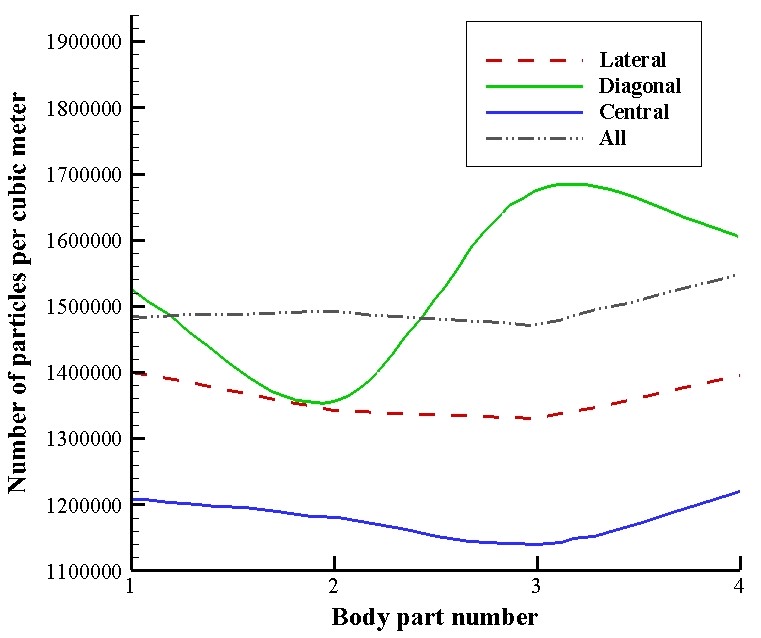
The obtained results versus each air inlet pattern are shown in Figure 5. As expected from the first examination, when particle dimensions are about 5 μm, there is an excellent consistency between results and expectations. However, in 0.5 μm dimensions, the results and theories had significant inconsistencies. According to Figure 5(a), the best layout for surgery rooms is full open gates and lateral, while the diagonal arrangement can cause the worst efficiency. Because Brownian and Thermophoretic forces have a significant effect on the motion of particles for diameters about 0.5 μm, the different inlet gate layouts cannot be compared precisely. For surgery operation in the head area, the lateral arrangement is more appropriate than the others. While for operations in the chest, abdomen, and thigh areas, the full open gates layout can lead to fewer particles around the patient, which means that the chance of infection decreases.
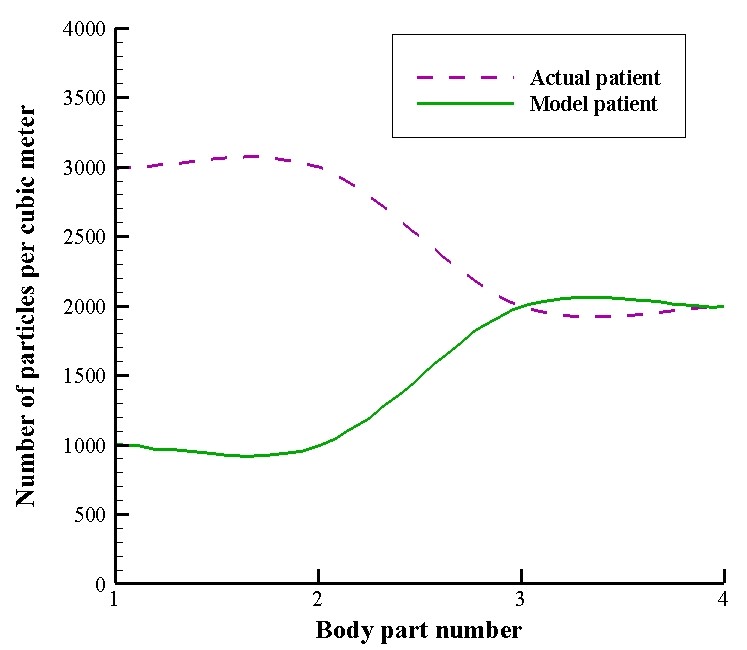
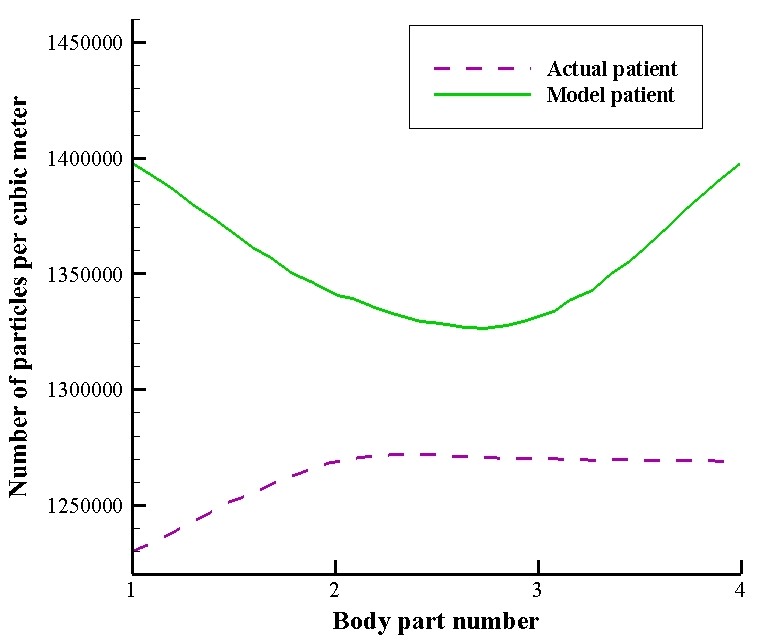
As shown in Figure 6(a), for 5 μm particles, the actual patient's concentration is approximately three times that of the model patient in the body part of 1 and 2. However, as illustrated in Figure 6(b), for 0.5 μm particles, particle concentration in the model patient increased sharply relative to the actual patient. This mismatch between 0.5 μm and 5 μm can be due to the patient's respiration, particles released from the body of the patient, the geometrical difference of actual and model patient, and Brownian and Thermophoretic forces.
 (a)
(a)
 (b)
(b)
 (a)
(a)
 (b)
(b)
4. 3. Sources of Error
Numerous factors can generally lead to increased errors and deterioration of experimental studies results, classified into three different categories. Measuring device error comes first. The study's flow meter has an accuracy of 0.01 m/s; however, the inlet velocity is not considered one of the problem's outputs parameters. Also, the particle counter has an accuracy of 0.3 μm, which means it cannot count particles having dimensions smaller than this value, even though smaller particles are not included in the test. Conspicuously, in smaller dimensions, counting errors can grow dramatically. Secondly, modeling type error can adversely affect the results. Although the patient, surgeon, and some operating tools were used, there are some limitations for exploiting all the equipment and surgical team, which are not used entirely. Indeed, by making the indoor design more complicated, results will become more accurate. Lastly, errors in the measuring method is another trouble. The presence of a measuring person in the room can adversely affect the concentration distribution and stream direction. Moving velocity, moving direction, and position of the measuring person are the main parameters that can directly and effectively influence the indoor stream.
5. Conclusion
It is of particular importance in modern life technology to control air quality in clean spaces. Using the significant parameters to increase the cleanness level requires adequate knowledge of influential factors on the particles' distribution. In this paper, the effect of internal geometry and inlet gate layouts on the particle concentration distribution is investigated experimentally. Moreover, the effect of changing the model patient to an actual patient is studied.
Noticeably, the full open gates arrangement can remove particles relatively better than the other layouts as it can produce more mass flow rate and more homogeneous pressure gradient than the others. However, it may not be practical in reality. The diagonal layout has the worst outlet particle efficiency, while the central one has the most. Being mentioned, the expectation was that the lateral arrangement should be the best. Lastly, by decreasing particle dimensions, Buoyancy force will decrease while the Brownian and Phoretic forces will increase to the extent that results are almost inverted in dimensions less than 0.5 μm.
According to the results, in an operation room, the best condition for inlet gate arrangements to decrease the particle concentration on the patient’s body is to have the possible distance between inlet and outlet gates or cover the ceiling with as many inlets as possible. The number of particles in the fully open gate layout and diagonal arrangement in the third part of the model patient is approximately 0 and 3000 per cubic meter, respectively, which is a huge difference. Also, changing the model patient to an actual patient showed that there could be a significant error when studies are done with a model patient, especially in the upper parts of the body (first and second body parts), and using a model patient can lead to an underestimation of the particle concentration.
References
[1] D.L. Malone, T. Genuit, J.K. Tracy, C. Gannon, L.M. Napolitano, Surgical site infections: reanalysis of risk factors, Journal of Surgical Research, 103(1) (2002) 89-95. View Article
[2] K.B. Kirkland, J.P. Briggs, S.L. Trivette, W.E. Wilkinson, D.J. Sexton, The impact of surgical-site infections in the 1990s: attributable mortality, excess length of hospitalization, and extra costs, Infection Control & Hospital Epidemiology, 20(11) (1999) 725-730. View Article
[3] T.C. Horan, R.P. Gaynes, W.J. Martone, W.R. Jarvis, T.G. Emori, CDC definitions of nosocomial surgical site infections, 1992: a modification of CDC definitions of surgical wound infections, Infection Control & Hospital Epidemiology, 13(10) (1992) 606-608. View Article
[4] S.Y. Tong, J.S. Davis, E. Eichenberger, T.L. Holland, V.G. Fowler, Staphylococcus aureus infections: epidemiology, pathophysiology, clinical manifestations, and management, Clinical microbiology reviews, 28(3) (2015) 603-661. View Article
[5] G.N. Djaiani, M. Ali, L. Heinrich, J. Bruce, J. Carroll, J. Karski, R. Cusimano, D.C. Cheng, Ultra-fast-track anesthetic technique facilitates operating room extubation in patients undergoing off-pump coronary revascularization surgery, Journal of cardiothoracic and vascular anesthesia, 15(2) (2001) 152-157. View Article
[6] I.-P. Chung, D. Dunn-Rankin, Using numerical simulation to predict ventilation efficiency in a model room, Energy and Buildings, 28(1) (1998) 43-50. View Article
[7] W. Liu, Z. Lian, Y. Yao, Optimization on indoor air diffusion of floor-standing type room air-conditioners, Energy and buildings, 40(2) (2008) 59-70. View Article
[8] C. Méndez, J. San José, J. Villafruela, F. Castro, Optimization of a hospital room by means of CFD for more efficient ventilation, Energy and Buildings, 40(5) (2008) 849-854. View Article
[9] K. Zhong, X. Yang, Y. Kang, Effects of ventilation strategies and source locations on indoor particle deposition, Building and environment, 45(3) (2010) 655-662. View Article
[10] K. Hagström, A. Zhivov, K. Siren, L. Christianson, Influence of the
floor-based obstructions on contaminant removal efficiency and
effectiveness, Building and Environment, 37(1) (2002) 55-66.
View Article
[11] H. Lee, H. Awbi, Effect of internal partitioning on indoor air quality of rooms with mixing ventilation—basic study, Building and Environment, 39(2) (2004) 127-141. View Article
[12] M. Shimada, K. Okuyama, S. Okazaki, T. Asai, M. Matsukura, Y. Ishizu, Numerical simulation and experiment on the transport of fine particles in a ventilated room, Aerosol Science and Technology, 25(3) (1996) 242-255. View Article
[13] M. Saidi, B. Sajadi, G. Molaeimanesh, The effect of source motion on contaminant distribution in the cleanrooms, Energy and Buildings, 43(4) (2011) 966-970. View Article
[14] A. Khademi, M.H. Saidi, M. Darbandi, G.E. Schneider, Numerical Study of Patient Respiration Effect on Bacterial Dispersion in a Surgery Room, Journal of Fluid Flow, Heat and Mass Transfer (JFFHMT), 6 (2019) 49-59. View Article
[15] S. Akabayashi, S. Murakami, S. Kato, S. Chirifu, Visualization oí Air Flow around Obstacles¡ n Laminar Flow Type Clean Room with Laser Light Sheet, (1986). View Article
[16] N. Gustavsson, Dispersion of small particles into operating rooms due to door openings, (2010).
[17] A. Khademi, M.H. Saidi, M. Darbandi, G.E. Schneider, Numerical Study of Bacterial Influences Caused by Patient Breathing, in: Proceedings of the 6th International Conference of Fluid Flow, Heat and Mass Transfer (FFHMT'19), 2019. View Article
[18] C.A. Balaras, E. Dascalaki, A. Gaglia, HVAC and indoor thermal conditions in hospital operating rooms, Energy and Buildings, 39(4) (2007) 454-470. View Article
[19] F. Memarzadeh, A.P. Manning, Comparison of operating room ventilation systems in the protection of the surgical site/Discussion, ASHRAE transactions, 108 (2002) 3.
[20] A. Parcheforosh, A. Mousemi, S.A. Alotaibi, A. Khademi, Experimental Study of the Ventilation Arrangement’s Effect on Particle Concentration in a Surgery Room, in: Proceedings of the 7th International Conference on Fluid Flow, Heat and Mass Transfer (FFHMT'20), 2020. View Article
[21] Cesstech Pte Ltd operational Catalogue. Oct 2004 (Rev1).
[22] M.R. Sippola, W.W. Nazaroff, Particle deposition from turbulent flow: Review of published research and its applicability to ventilation ducts in commercial buildings, (2002). View Article