Journal of Fluid Flow, Heat and Mass Transfer (JFFHMT)
ISSN: 2368-6111

Volume 8 - Year 2021 - Pages 6-13
DOI: 10.11159/jffhmt.2021.002
Experimental Studies of Pelton Hydropower Using Waste Water
Ghaleb Ibrahim1, Salem Haggag1, Abdalrahman Abd El Wahab2,
Mahmoud El-Sharkay2, Marwan Ghafouri2 and Youssef El-Kamash2
1Associate Professor, 2Senior Student
American University of Dubai, School of Engineering,
Dubai, United Arab Emirates
gibrahim@aud.edu; shaggag@aud.edu
Abstract - Generation of electricity from sustainable and renewable energy sources has captivated the world’s nations and became the focus of research and development for the past decades. A need for renewable energy sources to generate electricity, such as solar energy, wind power and hydropower, emerged as fossil fuel resources are not only depleting but also causing detrimental effects to the environment through their emissions and wastes. This paper provides a roadmap to the design process of a hydropower system that generates energy using building wastewater. The underlying theory is explained and tested in a reduced scale real-life prototype. A comparison between the theoretical and experimental results proves the validity of the given theory and design roadmap. The discrepancy between experimental and theoretical flow rates was found to be 13%. The basis of hydropower is to extract the potential energy present in water height difference (i.e. water head). Hence, a real-life reduced scale prototype that utilizes a one meter head of water is designed based on a rigorous set of theoretical calculations. Simulink and ANSYS simulations are used for the design of the Pelton Wheel required for the energy conversion. Based on the solution of the theoretical transient model using Simulink and the ANSYS simulation of the 3D system, the proposed hydropower system was manufactured and tested. Using the test data and the above mentioned theoretical and experimental analysis, the full scale system design is provided using sizing and dynamic similarity which is expected to be implemented in high rise building of various waste water heights.
Keywords: Sustainable Energy, Hydropower Systems, Wastewater, Numerical Modelling, Picoscale Prototype
© Copyright 2020 Authors - This is an Open Access article published under the Creative Commons Attribution License terms Creative Commons Attribution License terms. Unrestricted use, distribution, and reproduction in any medium are permitted, provided the original work is properly cited.
Date Received: 2020-10-30
Date Accepted: 2020-11-10
Date Published: 2020-01-21
1. Introduction
An introduction Globally the demand of fossil fuels such as coal, oil and gas, is in continuous increase, which will eventually lead to depletion of fossil fuels’ resources [1-2]. Also, the increase in use of fossil fuels has led to detrimental consequences to the environment due to the emission of greenhouse gases into the atmosphere [2]. Renewable energy presents the most suitable solution for sustainable development [1]. Hydropower is an efficient renewable energy source. Hydropower generates approximately 16% of global electricity generation. Hydropower plants provide at least 50% of the total electricity supply in more than 35 countries [3]. Currently, the world’s leading renewable energy source is hydropower, which mainly utilizes the natural flow of water in rivers by deploying hydro turbines to capture the energy from flowing water. G. Nangare [4] studied experimentally the power generation using open type low head turbine with 0.96 m turbine wheel and up 80 rpm. The author reported 130 W generated experimentally at 73 rpm wheel angular compared to 287 W theoretically. A. K.Yahya et al [5] designed a prototype of picohydro generation system that produce low capacity to be used in rural communities. They used two pulley system connecting the pelton wheel and the generator. Their results show that the pelton wheel with pulley system produced 0.98 W compared to 0.65 W produced by the wheel which is connected directly to generator.
However, the privilege of having natural water resources is not present in every country across the world, a prime example of such case is United Arab Emirates. Also, hydropower has drawbacks in terms of the water quality, wildlife habitats and prevent the fish migration [4-6]. To overcome this disadvantage some approaches are suggested such gravitational water vortex power system [5-7]. Therefore, the implementation of smaller scale hydropower plant that optimizes the potential energy stored in the descending wastewater in residential buildings, can provide a sustainable energy source for countries that lack the natural water resources.
C. Bousquetet al [8] They presented a methodology to assess the potential for hydropower in wastewater systems, either upstream or downstream of wastewater treatment plants (WWTP). T. Ghosh [9] demonstrated how small scale power is produced in tall buildings through hydraulic energy by using micro hydro turbine. They concluded that this management of waste water to produce energy from ‘nothing to everything’ can turn out to be a fruit full asset in coming years.
Hydropower is extracted energy form water potential energy as result of converting the potential energy to kinetic energy while the water is moving to a lower locations. Its overall efficiency is relatively up to 90%. Although it require high capital cost, it is predictable, economical and commercial technology. Hydropower plants may be classified, based on its capacity, which varies from large > 100 MW, medium (15-100 MW), small (1-15 MW), mini (100-1 MW) , micro (5-100 kW) and pico (<5 kW) hydropower [10-11]. Recent developments have shown that it is possible to generating electricity using wastewater. Micro hydropower may use the natural flow of water from a top of building whenever this water is available [12]. Micro hydro is frequently accomplished with a Pelton Wheel for high head, low flow water supply [12].
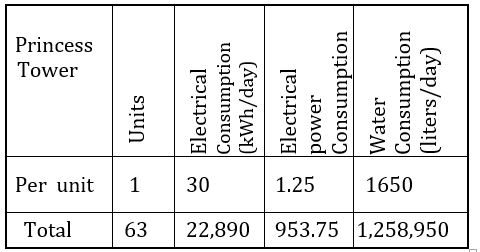
The current study is an attempt to design a pico hydropower plant as scale down of a micro hydropower plant using wastewater from high rise building. The design is based on data taken from Princess Tower in Dubai Marina, Dubai, United Arab Emirates. Table 1 shows the water and electrical consumption of Dubai Marina Tower. Due to high cost to design such system, a reduced scale prototype is developed and tested based on scaling down the data of the actual building. A full scale system design is provided using sizing and dynamic similarity based on the analysis of the reduced scale prototype.
2. Governing Equations
The followings are assumed for the analysis of the full scale system: 1) only 10% of the total power consumptions will be produced by a micro hydropower plant, which is approximately 100 kW, 2) water collected in reservoir at 20 m height, 3) system overall efficiency is 80%, and 3) hours of operation is12 hours a day.
Table 1. The Average Daily Electrical and Water Consumption in Dubai [13] [14].
Below are the governing equations that are used for both the full scale system and the reduced prototype design.
The power equation of a generator

Where P is power, V is volt and I is current
The energy equation applied between the upper tank and the exit the nozzle is [38]
Where p is pressure, v is velocity, Z is elevation and g is acceleration of gravity
Simplifying the energy equation assuming no minor losses in the system the inlet and exit pressure are equal and the inlet water velocity is nearly zero, the exit velocity
Where ![]() is height,
is height, ![]() is jet diameter,
is jet diameter, ![]() is penstock diameter. f is
friction factor, L is length and K is minor loss coefficient
is penstock diameter. f is
friction factor, L is length and K is minor loss coefficient
Taken the losses in the nozzle, the nozzle velocity is
The overall efficiency is

The optimum dimension of the Pelton Wheel may be calculated using the following relations [39]. The vector velocity relation at the inlet to the wheel

Where ![]() is the relative velocity, U is the
wheel velocity,
is the relative velocity, U is the
wheel velocity,![]() is absolute velocity at inlet.
is absolute velocity at inlet.
The optimum blade velocity

The wheel diameter

The nozzle diameter

Where
 is the nozzle diameter
 The bucket width [15]

Number of buckets
Where Z is number of buckets,
 is wheel diameter
The wheel diameter [15]

The mechanical power developed by the turbine can be calculated as follows:


Where P is power,  is density
of water,
is density
of water,  is the absolute velocity angle.
The turbine torque:

Where T is the torque, ![]() = is angular speed, n is number
of rpm
= is angular speed, n is number
of rpm
3. Reduced Scale Prototype Analysis
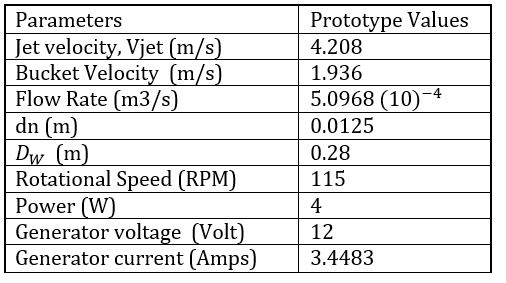
The model is 3D designed and rendered using SOLIDWORKS and a simulation is conducted using ANSYS Fluent along with a Simulink model on MATLAB. For the reduced scale prototype, Equations 1-15 are solved based on the following assumptions: 1) the gross head is 1 m, 2) the Pelton Wheel diameter is 28 cm, and 3) The nozzle velocity coefficient is 0.95. Table 2 below shows the reduced scale calculated parameters based on the given assumptions. Figure 1 shows the SolidWorks model of the reduced scale prototype
Table 2. Reduced Scale Prototype Calculated Parameters
4. Reduced Scale Prototype Operating Principles
The stored water is allowed (by aid of a control system) to flow by gravity through a piping system (the penstock) and then through a nozzle, driving a turbine that drives a generator generating electricity. As can be seen in Figure 2 and Figure 3, the top section of the prototype includes one of the main components of the entire system which is the top tank, which is meant to hold the water and provide room for the elevation to develop, emulating the reservoir from the full scale system. An integral part of the tank is the set of cut-outs that are meant to accommodate the contactless water sensors that will be used in coordination with the system controller in order to help control the flow in the system (i.e. its operation).
The frame in the figure represents the body that is meant to accommodate all of the components and acts as the backbone of the working model. The piping system on then rights side of the tank is used a return system to pump the water back to the upper tank with the aid of a pump.
As the water enters the pipe it flows through the Solenoid Valve which is either open or closed based on the controller and water Level Sensor signals. When the valve is open, the water flows into the Sanitary Tee which is connected to a Flow Meter using a PVC connector and another PVC connector connects the Flow Meter to the Nozzle. The water exits the Nozzle and hits the buckets of a Pelton Wheel Turbine which was 3D printed. The Turbine is enclosed in a Casing made out of clear acrylic like the material of the pipes. A second ball valve is installed to allow the return water either to flow to the upper tank or to be used to drive the Pelton Wheel instead of the upper tank water.
The view of the middle section (Figure 4) show the shaft connecting the Turbine to a Generator. The Shaft is supported by two Ball Bearings and a Sealed Bearing to prevent leaking through the casing around the shaft. A Tachometer is placed by the shaft to measure the rotational speed and feed it into the controller. The controller is connected by wires to a Relay, which controls the Solenoid Valve, and an LCD screen which outputs the reading of speed measured by the Tachometer and the flow rate measured by the Flow Meter. The bottom section of the prototype consists of a collecting water tank, a submersible water pump used to pump the water back up to the top tank through the piping system. The bottom tank is also supported by wooden platform, with the whole assembly resting on wheels to aid with mobility.
5. ANSYS Fluent Analysis
Figure 5 shows the velocity contours and the fluid behaviour in the tank that is entering and discharging from the nozzle. From the figure it can be seen the vortices occurring at the nozzle inlet which adds to the losses in the system. The velocity at the nozzle exit is 3.98 m/s as expected. The vorticities at inlet to the penstock (tank exit) are clearly shown in the figure. Figure 6 shows how the pressure is increasing with depth in the tank and along the pipe (penstock) and it drops again in the nozzle section due to reduced diameter. However, the highest pressure is at the bottom section of the pipe on the left corner where vorticities occurs. Both the steady state results and the ANSYS/fluent simulation agrees well
6. Reduced Scale Prototype Testing
During the testing of the prototype, the water head in the tank was left to drop from 1 meter down to 0.8 meter while the system is operating. The controller is used to record the output parameters. The flow rate is recorded through the use of the flow meter at an interval 1 second. The water head is recorded using the water level sensors fitted on the sides of the top tank. The level sensors are initially wet and so they are on. As the water flows out of the tank the water height begins to drop. When the water drops below the sensor, the sensor turns off. The controller records the time at which the sensor goes off. Since the dimensions and distance between sensors are known, the water head versus time is measured. The controller is also used to record the voltage output by the generator. The controller is connected to the generator and a simple code was uploaded to measure the voltage output throughout the run. To record the voltage, the controller is set to take a reading every 0.5 seconds due to the sensitive measurement of the voltage.
The results are plotted as shown in Figure 7 to Figure 10. Figure 7 shows the behaviour of the flow rate with time. It was difficult to measure a smooth variation in the flow rate the change in flow rate versus time was sensitive therefore with available used sensors, the flow rate showed an approximate constant values for a range of time and then drops to a new constant value before it drops again to a lower new constant. The best fit of the flow rate is nonlinear where the simulated trend is linear. This is due to the large reading error. As can be seen from the figure the flow rate started at 10 L/min and kept decreasing throughout the run, which lasts for around 5 minutes, slowly until it reached 8 L/min. This correlation is expected based on the fact that the head in the tank decreases. Figure 8 below shows the plot for head with time. The trend is approximately linear whereas the theoretical trend is parabolic. This again due to the data reading error. The sensors along the water depth in the tank seemed to be sensitive to the wettability and so they did not switch off as water clear the sensor.
The angular speed is directly related to the water head. As water head decreases the speed decreases as well. This can be also seen in Figure 9. This was also recorded using the system controller where the speed sensor measured the rate at which the shaft rotates. As can be seen from the figure, the measured data are scattered due to large errors due to instrumentation and equipment used. However, the overall trend can be depicted. The rotational speed started at around 65 rpm and decreased throughout the run until eventually reached around 35 rpm at the end of the run. The relation is not entirely linear, which was somewhat expected. The generator voltage output correlates directly to the shaft angular speed. The voltage was recorded over 0.5 seconds interval, which produced a large number of data. The data are plotted versus time in Figure 10. The figure shows concentrated data distribution over a range and falls with time. The best fit curve have clearly represent the average of the range, which varies nonlinearly with time.
Figure 11 shows a direct relation of the angular speed and voltage with water head. The data of the angular speed and voltage area taken as average of the scattered data at a given instant of time at the corresponding water head. Both trends are similar and close to vary linearly with water head. At the beginning the water was allowed to run, the water head begun to drop while the angular speed and voltage were still zero. It took about 5 seconds for the voltage and the angular speed to reach their maximum before they start dropping again.
7. Conclusion
In this work, a reduced scale prototype of a green energy system that uses building wastewater to generate power is presented. The prototype design is done using SolidWorks and a workshop drawings are generated to aid in manufacturing and building. The prototype is tested and was able to produce around 4 Volt from 1 meter head while maintaining a flow rate of around 9 L/min and a rotational speed of around 60 rpm on average. The discrepancy between experimental and theoretical flow rates was found to be 13%. The system was also tested using the pump as water supply that is equivalent to free falling water of head 1 meter and the actual flow rate with no losses. This gave an output of 9 Volt and a rotational speed over 100 rpm. The system requires more refinement to reduce the flow losses so that it can be scaled up to s design that operates in high rise building using waste water. The scaling shows that an actual height of 20 meters, would produce 105 kW running for 12 hours a day. Which will be a power saving of 10% of the total consumption and also reduce the carbon footprint.
Nomenclature
References
[1] K. Sopian, B. Ali, N. Asim, 2011. Strategies for Renewable Energy Applications in the Organization of Islamic Conference (OIC) countries. Renewable and Sustainable Energy Review. 15, pp 4706–4725, 3011.
[2] Hannah Ritchie 2017. How Long Before We Run Out Of Fossil Fuels? Our World in Data, August 08, 2019, https://ourworldindata.org/how-long-before-we-run-out-of-fossil-fuels.
[3] Paul Lako and Masaomi Koyama, 2015, Hydropower technology brief, IEA-ETSAP and IRENA Technology Brief E06 – February 2015
[4] G. Nangare [4], Power generation by using open type low head turbine, (IJSETR), Vol3, Issue 10, pp 2699-2702, 2014
[5] A. K.Yahya et al, Pico-Hydro Power Generation Using Dual Pelton Turbines And Single Generator, IEEE 8th Int. Power Engineering and Optimization Conference (PEOCO), 2014. View Article
[6] C. J. Cleveland and C. Morris, 2013 Handbook of energy, Hydropower, Elsevier, Amsterdam. pp 79–102, 2013
[7] O. B. Yaakoba , Yasser M. Ahmeda,b , A. H. Elbatrana , H. M. Shabaraa, 2014, A Review on Micro Hydro Gravitational Vortex Power and Turbine Systems, Jurnal Teknologi (Sciences & Engineering) vol. 69, issue 7, pp 1–7, 2014
[8] C. Bousquet et al [8], Assessment of hydropower potential in wastewater systems and application to Switzerland, Renewable Energy Vol 113, pp 64-73, 2017
[9] T. Ghosh [9], Small Scale Power for Tall Buildings through Waste Water Management, IOSR Journal of Mechanical and Civil Engineering (IOSR-JMCE) Vol. 12, Issue 2 Ver. VII, PP 20-22, 2015
[10] Seppo A. Korpela, 2011, principle of turbomachinery, WILEY, ISBN:9780470536728
[11] Saurabh Sangal, Arpit Garg, 2013, Dinesh Kumar, Review of Optimal Selection of Turbines for Hydroelectric Projects, International Journal of Emerging Technology and Advanced Engineering, Vol.3, Issue 3, pp. 424-430, 2013
[12] Tanumoy Ghosh, Arpita Das andPiyali Das,2015, Small Scale Power for Tall Buildings through Waste Water Management, Journal of Mechanical and Civil Engineering, vol. 12, issue 2-VII, pp 20-22, 2015
[13] Dubai Electricity & Water Authority (DEWA) | Annual Statistics 2017". Dewa. Gov. Ae, 2019. View Article
[14] Staff Reporter, "550 litres of water used per day by a UAE resident", Khaleej Times, 2019. [Online]. Available: https://www.khaleejtimes.com/550-litres-of-water-used-per-day-by-a-uae-resident.
[15] B. W. Solemslie and O. G Dahlhaug, A reference Pelton turbine design, Earth and Environmental Science 15 (2012) 032005 View Article