Journal of Fluid Flow, Heat and Mass Transfer (JFFHMT)
ISSN: 2368-6111

Volume 7 - Year 2020 - Pages 92-104
DOI: 10.11159/ffhmt.2020.009
Flow Characterization of a Water Drop Impinged onto a Rigid Surface at a High Speed and Normal Angle in the Presence of Stagnant Air at Ambient Condition
Mason Marzbali1,2, Ali Dolatabadi2
1American University in Dubai, Department of Mechanical Engineering
P.O. Box 28282, Dubai, United Arab Emirates
mmarzbali@aud.edu; mason.marzbali@concordia.ca
2Concordia University, Department of Mechanical, Industrial and Aerospace Engineering
1455 De Maisonneuve Blvd. W., Montreal, QC, Canada, H3G 1M8
ali.dolatabadi@concordia.ca
Abstract - High-speed droplet impact is of great interest to power generation and aerospace industries due to the accrued cost of maintenance in steam and gas turbines. The repetitive impact of liquid droplets, that are formed due to vapor condensation in steam turbines or water injection into industrial gas turbines for evaporative cooling purposes, onto rotor blades at high relative velocities, results in the blade erosion. This is known as Liquid Impingement Erosion (LIE) and it is crucial to understand the hydrodynamics of the impact in order to identify the consequent solid response before addressing the LIE problem. The numerical study of the droplet impingement provides the transient pressure history generated in the liquid. Determining the transient behavior of the substrate, in response to the pressure force exerted due to the droplet impact, would facilitate manufacturing new types of blades that are more resistant to LIE. To that end, characterizing the impact of compressible liquid droplets impinged at very high velocities, up to 500 m/s, on rigid solid substrates and thin liquid films is the main objective of the present work. A droplet size of 500 µm, which is encountered frequently in LIE problem, and a liquid film thickness of 100 µm are simulated and a detailed analysis of the compressible flow is presented. The average pressure exerted on the solid surface due to the droplet impact is reported which can be used to model the stress in the solid and carry out the fatigue analysis of the material in order to estimate its practical lifetime.
Keywords: Liquid impingement erosion, Compressible Volume of Fluid (VOF), Multiphase flow, Drop impact
© Copyright 2020 Authors - This is an Open Access article published under the Creative Commons Attribution License terms Creative Commons Attribution License terms. Unrestricted use, distribution, and reproduction in any medium are permitted, provided the original work is properly cited.
Date Received: 2020-09-20
Date Accepted: 2020-10-01
Date Published: 2020-12-23
1. Introduction
Although the experimental study of droplet impact dates back to 1876 by the work of Worthington [1], it still remains an area of extensive study today. One of the earliest analytical models for liquid-solid impact was developed by von Kármán [2] in 1929 for seaplane floats during landing on water. Initial stages of liquid-solid impact, assuming incompressible fluid and a rigid solid, have been addressed mathematically, e.g., Korobkin [3], based on the method of matched asymptotic expansions. In addition, the influence of liquid compressibility, during normal penetration of a blunt body into a liquid which resembles the impact of a circular droplet by a flat plate, was studied by Korobkin & Pukhnachov [4] and Korobkin [5], and asymptotic solutions were obtained. Moreover, the two-dimensional hydrodynamic problem of the sudden start of a floating wedge on a weakly-compressible liquid that leads to liquid jetting was modeled by Korobkin & Iafrati [6]. The advancement of high-speed imaging techniques, in addition to computational power, have allowed researchers to obtain much higher temporal and spatial resolutions in capturing the hydrodynamics of droplet impingement. There are various physical phenomena that occur upon the impact of a liquid droplet on a solid substrate, such as spreading, fingering, air entrapment, bouncing and splashing, that drew the attention of various industries and academia. For instance, the spreading of a droplet at low impingement velocities has been studied in details by Fukai et al. [7], Chandra & Avedisian [8], Pasandideh-Fard et al. [9] and more recently by Roisman et al. [10]. The entrapment of an air bubble underneath the droplet has been simulated by Mehdi-Nejad et al. [11]. The effect of gas cushioning, due to the gas compression and viscosity, which results in gas bubble entrapment during liquid-solid impact, was reported by Hicks and Purvis [12] and the size of the air pocket was obtained. Moreover, the formation of fingers upon impact of water drops was experimentally investigated by Mehdizadeh et al. [13]. Blake & De Conick [14] have extended the molecular-kinetic theory of dynamic wetting by considering the effect of fluid-solid interaction. More recently, a new splashing mechanism was observed during droplet impact onto an elastic circular disk, based on axisymmetric Wagner-style model, by Pegg et al. [15]. They have illustrated that the substrate oscillation due to solid elasticity can cause splashing. A two-dimensional, axisymmetric, two-way coupled Fluid-Solid Interaction model for impingement of liquid droplets onto rigid and elastic Ti-6Al-4V substrate was presented by Marzbali [16], Marzbali et al. [17] and Marzbali & Dolatabadi [18]. It was illustrated that the fluid compressibility effect on the pressure build-up and solid stress cannot be neglected for impingement velocities above 100 m/s since the increase in liquid density would be more than 5%. However, most of the past studies in droplet impingement are concerned with low impact velocities, hence, do not take into account the fluid compressibility, which becomes critical at high impingement velocities. Furthermore, solid elasticity leads to the reduction of impact pressure. The application of a new surface engineering, such as hydrophobic coatings, in order to reduce the liquid droplet damage, has been investigated by the authors and the proposed method and system for reducing liquid droplet impact damage was patented by Siemens in 2017 [19].
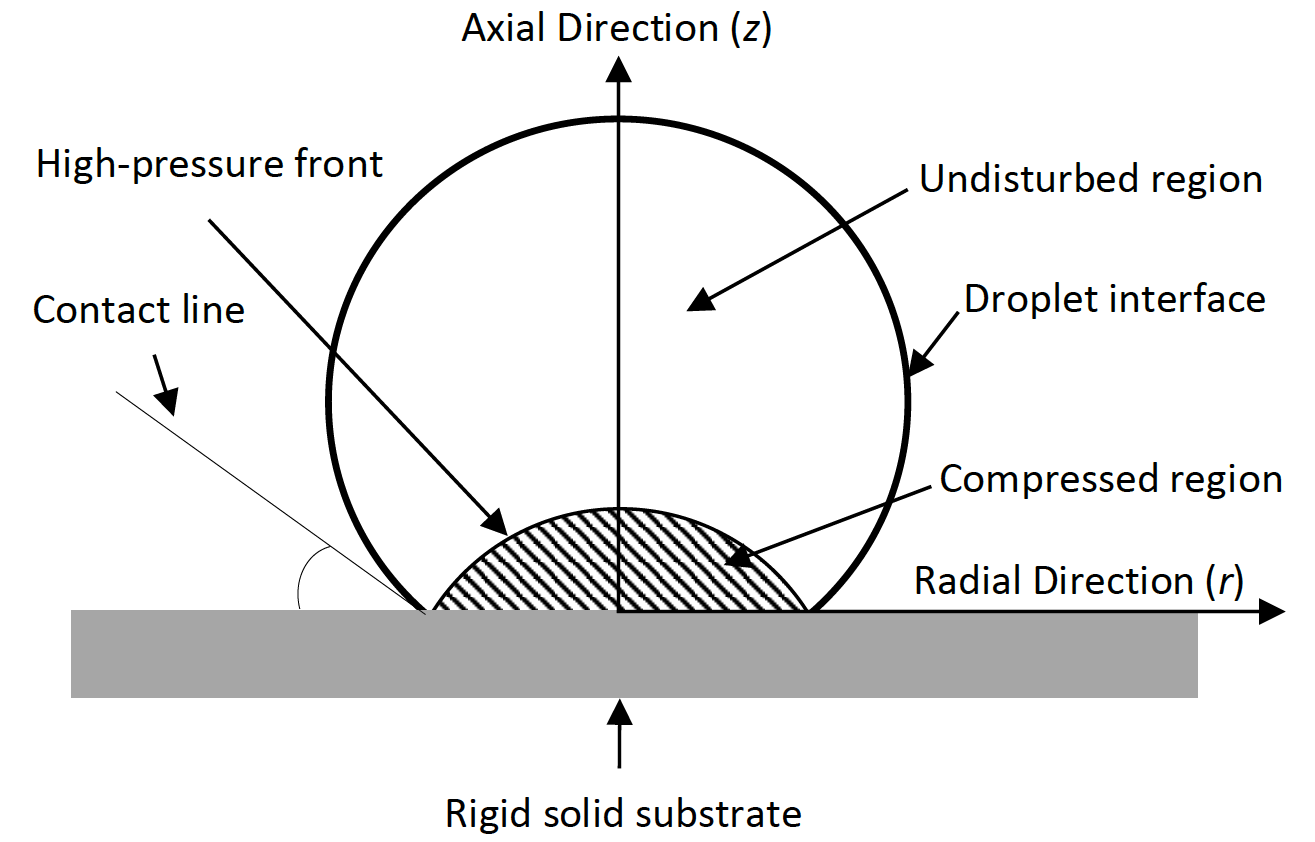
Commonly in practice, a spray composed of liquid droplets is impinged on the surface; nevertheless, the interaction between the droplets and their coalescence makes the spray impingement a complex phenomenon. For that reason, single droplets are studied in almost all analytical and numerical works and a spray effect is assumed to be approximately represented by the superimposition of a finite number of droplets. Figure 1 illustrates the impact of a spherical liquid droplet onto a flat rigid surface schematically. Upon the impact of a liquid droplet on a solid substrate at a high velocity, compression waves begin to propagate in the droplet due to the fluid compressibility. These compression waves create a high density region in the liquid close to the solid surface and break away from the droplet periphery, giving rise to the formation of lateral jets, as reported by Heymann [20] and confirmed by the experiments of Dear et al. [21] and Field et al. [22]. The pressure waves generated in the liquid accumulate over time and form a high-pressure front since the speed of sound changes in the compressed region. Compression waves travel through the compressed region at the speed of sound in the liquid, hence, the rest of the droplet, outside the disturbed region, is not affected by the impact yet. The pressure and density inside the undisturbed region remain unchanged since it is completely unaware of the impact. As the liquid droplet continues its downward motion toward the solid, the high-pressure front penetrates further into the liquid bulk and the compressed region increases in size. At the same time, the droplet contact line is moving radially outward from the droplet center axis, right after the droplet touches down on the surface. Initially, the contact periphery spreads out much faster than the high-pressure front. As the contact line starts to decelerate due to viscous dissipation, it is finally overtaken by the high-pressure front that is spreading outward. At this exact instant, the high-pressure front detaches and starts to travel along the free surface leading to the formation of lateral jets. This jetting eruption is the result of a very large difference between the pressure and density across the free surface of the droplet in the contact line region.
When lateral jetting occurs, the impact pressure reaches its temporal maximum value, as experimentally measured for the first time by Rochester and Brunton [23]. It has been shown, by Heymann [20] and Lesser [24], that the pressure in the compressed area is not uniform and the location where the highest pressure appears is behind the contact line, as reported by Lesser & Field [25]. Lesser [24] has studied droplet impacts analytically and in order to determine the exact position of the high-pressure front, he proposed an envelope of individual wavelets emitted by the expanding contact edge. In his model, he assumed that the compression wave velocity is equal to the speed of sound in ambient condition. Although this assumption is valid for the acoustic limit, Haller [26] demonstrated that it is invalid for high impact velocities where the liquid compressibility effect is considerable. He has shown, both computationally and analytically, that the compression wave velocity during the first stage of the impact, at an impingement velocity of 500 m/s, is in the range of 2600-3000 m/s, which is significantly higher than the ambient speed of sound in water, i.e., 1430 m/s. Therefore, in modeling the compressible droplet impact, it is essential to account for the changes in the speed of sound, via the variation of liquid density, with an equation of state. In this regard, a compressible Volume of Fluid (VOF) model was utilized to resolve the interfacial gas-liquid flow for droplet impingements of a 200-µm droplet impinged at a velocity of 500 m/s on a dry rigid substrate and a 500-µm droplet impinged at a velocity of 350 m/s on a 100-µm-thick liquid film, and the results were published by Marzbali & Dolatabadi in [27] and [28], respectively. The obtained results for lateral jet velocity, liquid density and maximum pressure were compared with the study reported by Haller [26] for impact on a rigid substrate.
The main objective of the current work is to study the compressibility effect and changes in speed of sound in more details for an impact velocity of 500 m/s. The growth of the compressed region inside a 500-µm liquid droplet and its spreading over the surface are outlined. Furthermore, the spatiotemporal evolution of the impact pressure on the solid surface and the fluid velocity before and after the eruption of lateral jet, which leads to a very strong tangential flow on the fluid-solid interface, is presented. It should be mentioned that this radial flow can cause serious shear stress in the solid that may lead to crack initiation and propagation under the surface. Finally, the average pressure over the affected area is compared for the cases of a dry solid surface and a thin liquid film with a thickness of 100 µm along with the one-dimensional water-hammer pressure which represents a one-dimensional compression wave. The normal force exerted on the surface due to the fluid pressure leads to normal stresses in the solid generated by the compressive stress waves. The combined effect of shear and normal stresses in the solid can be modeled with Finite Element Method (FEM), based on the current simulation results, in order to approximate the material’s lifetime subjected to liquid impingement erosion condition and will be presented in the near future.
2. Methodology
2. 1. Governing equations
Navier-Stokes equations are solved for two compressible and immiscible fluids. The conservation of mass and momentum equations in their transient and compressible forms are as follows,
where Vf is the fluid velocity vector, ρf is the fluid density, and Fb is the body forces acting on the fluid. σf is the Cauchy stress tensor for a Newtonian fluid, including pressure and viscous terms, defined as,

where pf
is the fluid pressure, I is the 3 by 3 identity matrix and ![]() is the viscous stress tensor
defined below,
is the viscous stress tensor
defined below,
where µf is the fluid dynamic viscosity. A single equation is solved for both gas and liquid phases and fluid properties are calculated for the mixture. The fluid flow is assumed to be laminar; hence, no turbulence model is employed in the solver. The energy equation for a compressible flow is as follows,
where, e = cT, is the internal energy per unit mass, c is the specific heat capacity for liquid and specific heat capacity at constant volume for a perfect gas, T is temperature, k is the thermal conductivity of the fluid, and Φ is the viscous dissipation term defined as,

In addition, in order to close the system of equations, an equation of state for gas and liquid phases is needed. The ideal gas law is applied to account for the air compressibility as follows,

where R is the specific gas constant equal to 287 J/kg.K for air. For the liquid phase, the power law equation of state proposed by Tait [29], commonly used for water, is utilized and defined below,
where ![]() is the density of water at ambient
conditions equal to 997 kg/m3 and B, pa and
N are three constants from Tait’s equation [29] equal to
is the density of water at ambient
conditions equal to 997 kg/m3 and B, pa and
N are three constants from Tait’s equation [29] equal to ![]() ,
, ![]() and
and ![]() , respectively.
, respectively.
The surface tension force is treated as a pressure gradient across the liquid-gas interface and is calculated per unit volume based on the Continuum Surface Force (CSF) model proposed by Brackbill et al. [30]. The compressible VOF model adapted from Hirt & Nichols [31] is employed to resolve the droplet interface. In VOF method, a scalar field is defined for volume fraction of the liquid phase, namely a, and its value depends on the fraction of the cell volume occupied by this phase. The values between zero and one denote the interface between gas and liquid phases. Since the volume fraction represents the volume occupied by the liquid, it should be advected by the flow field at each time step. The following equation governs the liquid advection,
Following the advection, the interface is reconstructed using the Piecewise Linear Interface Calculation (PLIC) proposed by Youngs [32]. In PLIC method, the interface is defined at each computational cell by a slope and an intercept. The slope of the interface is calculated based on the volume fractions of the neighboring cells.
2. 2. Computational domain, boundary and initial conditions
The computational domain for the 2-D axisymmetric model has a width of eight times the droplet radius (R) and the height of the domain is 4R. The gravitational force is exerted in the same direction as the droplet impingement. The computational domain consists of air and water phases and the properties at ambient conditions are utilized for both phases. Outflow boundary condition is applied to all fluid boundaries except for the substrate surface. No-slip, no-penetration and adiabatic conditions are imposed on the fluid-solid interface. In addition, the droplet center axis has axisymmetric boundary condition. Initially, the fluid domain is filled with air. At the beginning of each simulation, the droplet and liquid film are patched in the fluid domain according to the impact conditions. The computation for the rest of the cells starts with zero for the velocity and liquid volume fraction. The initial temperature and pressure in all the computational cells including the boundaries are set to the ambient conditions, i.e., 300 K and 100 kPa, respectively.
2. 3. Fluid physical properties
Table 1 displays the initial physical properties of both phases present in the computational domain, i.e., undisturbed air and water, under ambient temperature and pressure of 300 K and 100 kPa, respectively. It is worth mentioning that the variations of hydrodynamic properties except density and thermal properties of both fluids with temperature are neglected.
Table 1. Physical properties of air and water.
| Physical property | Air | Water |
| Density (kg/m3) | 1.184 | 997 |
| Kinematic viscosity (m2/s) | 1.562e-05 | 8.9368e-07 |
| Surface tension (N/m) | 0.073 | |
| Specific heat capacity(J/kgK) | 1007 | 4180 |
| Prandtl number | 0.7296 | 6.14 |
2. 4. Numerical schemes and discretization
The Pressure-Implicit with Splitting of Operators (PISO) method is used for pressure-velocity coupling in transient calculations. The integral forms of fluid equations are discretized over each control volume and solved for a fixed system of grids in a segregated manner. The solution is then obtained by using a time marching scheme based on the given initial condition. The Gaussian integration method is used for summation of the values on cell faces interpolated linearly from cell centers. The time scheme is first-order implicit, based on Euler method, and bounded. The gradient schemes are Gauss linear with central differencing. The divergence schemes are also Gaussian with an upwind discretization for all the transport equations except for volume fraction flux, which is second-order accurate in space and unbounded. Finally, the uncorrected Gauss linear scheme is utilized in discretizing the Laplacian equation. For other variables, such as temperature, density and kinetic energy, an upwind method, which is first order and bounded, is used to discretize the equations. The second derivative of temperature is discretized with a linear scheme, which is second order and unbounded. The linear Gaussian scheme is utilized for interpolation from the cell centers to the faces.
The time step during for all the advective fluxes in transport equations is different from the one used in VOF calculations. The time step in VOF is adaptive and depends on the Courant–Friedrichs–Lewy (CFL) condition. The maximum CFL is set to 0.1 during the computations to constrain the adaptive time step. This requirement ensures that the liquid advection through one cell is less than 10% at every time step and the initial time step is determined based on the impact velocity and grid size, depending on the impact condition.
Finally, “compressibleInterFoam” solver from OpenFoam® library, an open-source computational code, is used for simulations. In OpenFoam®, all the equations are solved in three dimensions and a 2-D axisymmetric mesh is simply a 5o section of a full cylinder with flat sides and one cell in lateral direction, which results in a wedge. The dependence of the generated pressure on the grid size is investigated. To that end, the impact of a 500-μm droplet at 350 m/s on a rigid substrate is analyzed with three different grid sizes of 1.25, 1 and 0.75 μm which correspond to 400, 500 and 666 cells per droplet diameter, respectively. The peak dimensionless pressures predicted with the grid size of 1.25, 1 and 0.75 μm are 2.2925, 2.2583 and 2.2527, respectively. The difference of the peak pressure values between the simulation with 1 and 0.75 μm grids is less than 0.25%. Therefore, refining the grid size below 1 μm (500 cells per diameter) would have no considerable effect on the accuracy of the generated pressure and this mesh resolution is selected for simulating the droplet impact for all the cases.
2. 5. Nondimensionalization of variables
In presenting certain results, the variables are nondimensionalized with respect to the following reference values: droplet radius (R), impact velocity (V0), waterhammer pressure (pwh = ρ0 V0 c0), density of undisturbed water (ρ0 = 997 kg/m3) and initial/ambient temperature (T0 = 300K). c0 is the speed of sound in undisturbed water which is equal to 1430 m/s. As a convention, “*” denotes a non-dimensional variable in this paper. Table 2, illustrated below, enumerates the dimensionless parameters and their definitions.
Table 2. Definition of non-dimensional variables
| Variable | Notation | Definition |
| Length | l* | l* = l/R |
| Time | t* | t* = tV0/R |
| Velocity | V* | V* = V/V |
| Pressure | p* | p* = p/pwh |
| Density | ρ* | ρ* = ρ/ρ0 |
| Temperature | T* | T* = (T - T0)/T0 |
| Speed of sound | c* | c*=c/c0 |
3. Results and Discussion
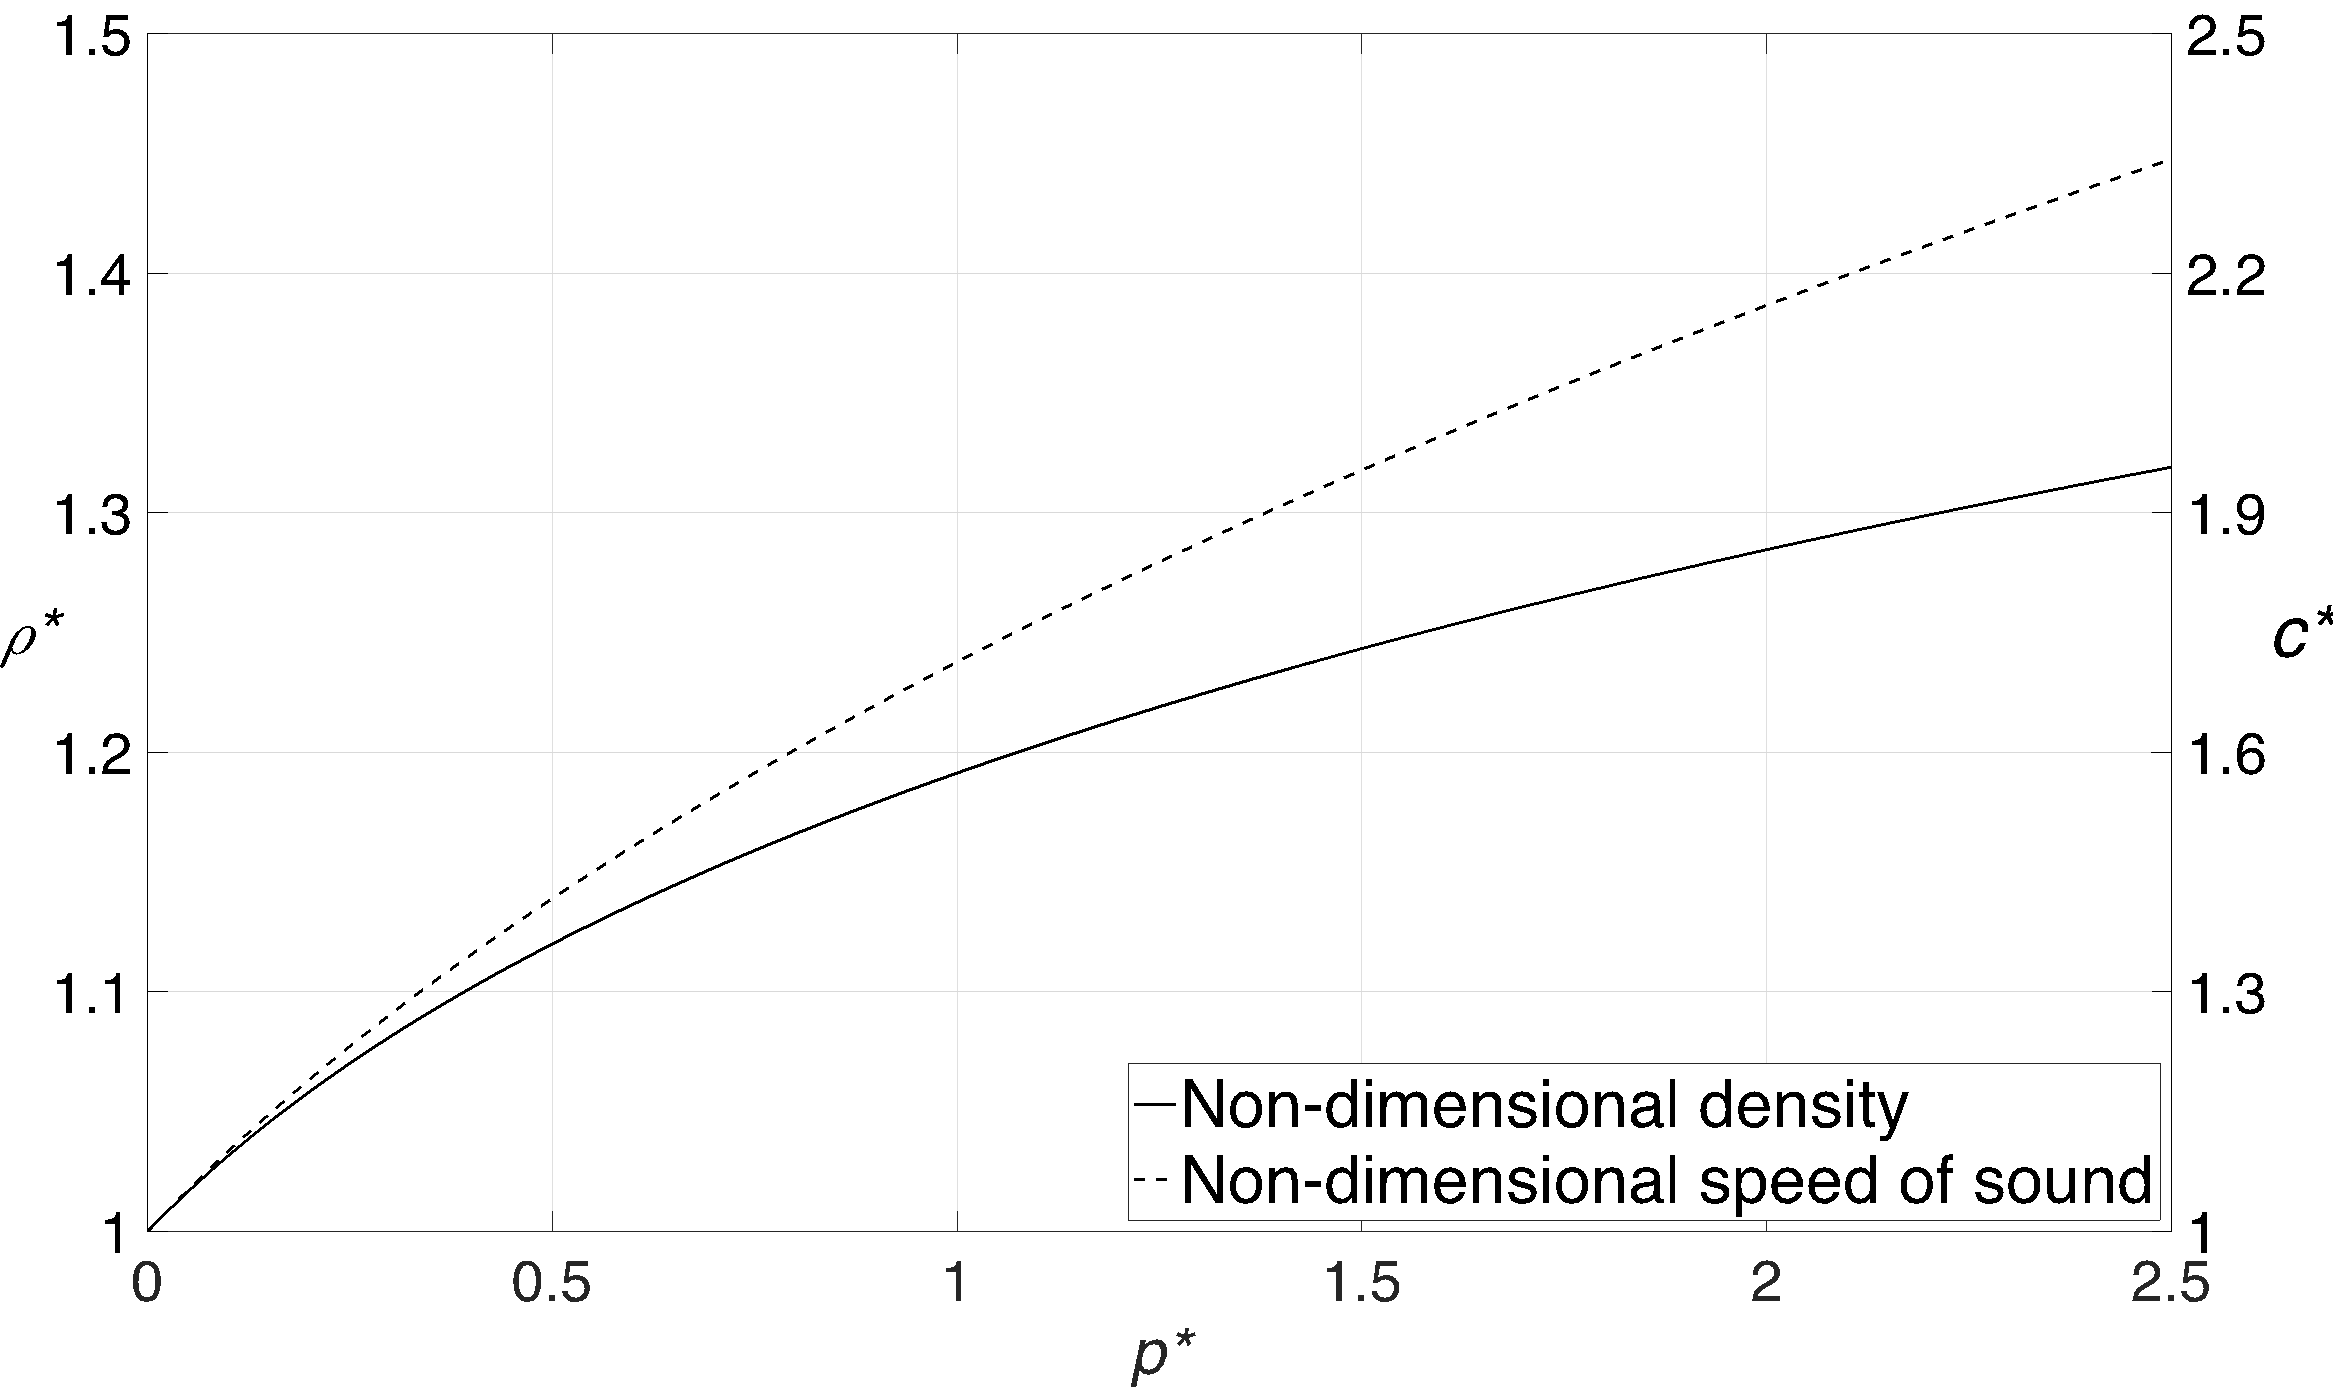
As mentioned previously in the introduction, the liquid density would increase more than 5% for impingement velocities above 100 m/s, due to the high pressure generated in the liquid droplet upon the impact on a rigid solid. Hence, the compressibility effect cannot be neglected at such impact speeds. The variation of non-dimensional density and speed of sound in liquid water versus non-dimensional pressure, which is based on the Tait’s equation of state for water [29], is illustrated in figure 2. The impact velocity to calculate the waterhammer pressure is assumed to be 500 m/s. As it can be seen in this figure, if the pressure in the liquid reaches 2.5 times the waterhammer pressure (it will be shown later in the results that the pressure in the liquid region does in fact reach such high values), the increase in density and speed of sound would be about 32% and 134%, respectively.
The results for the impact of a
500-µm droplet impinged at a velocity of 500 m/s onto a dry surface and a thin
liquid film with a thickness of 100 µm are presented in this section. The
surrounding air in both cases is initially motionless and has a temperature of
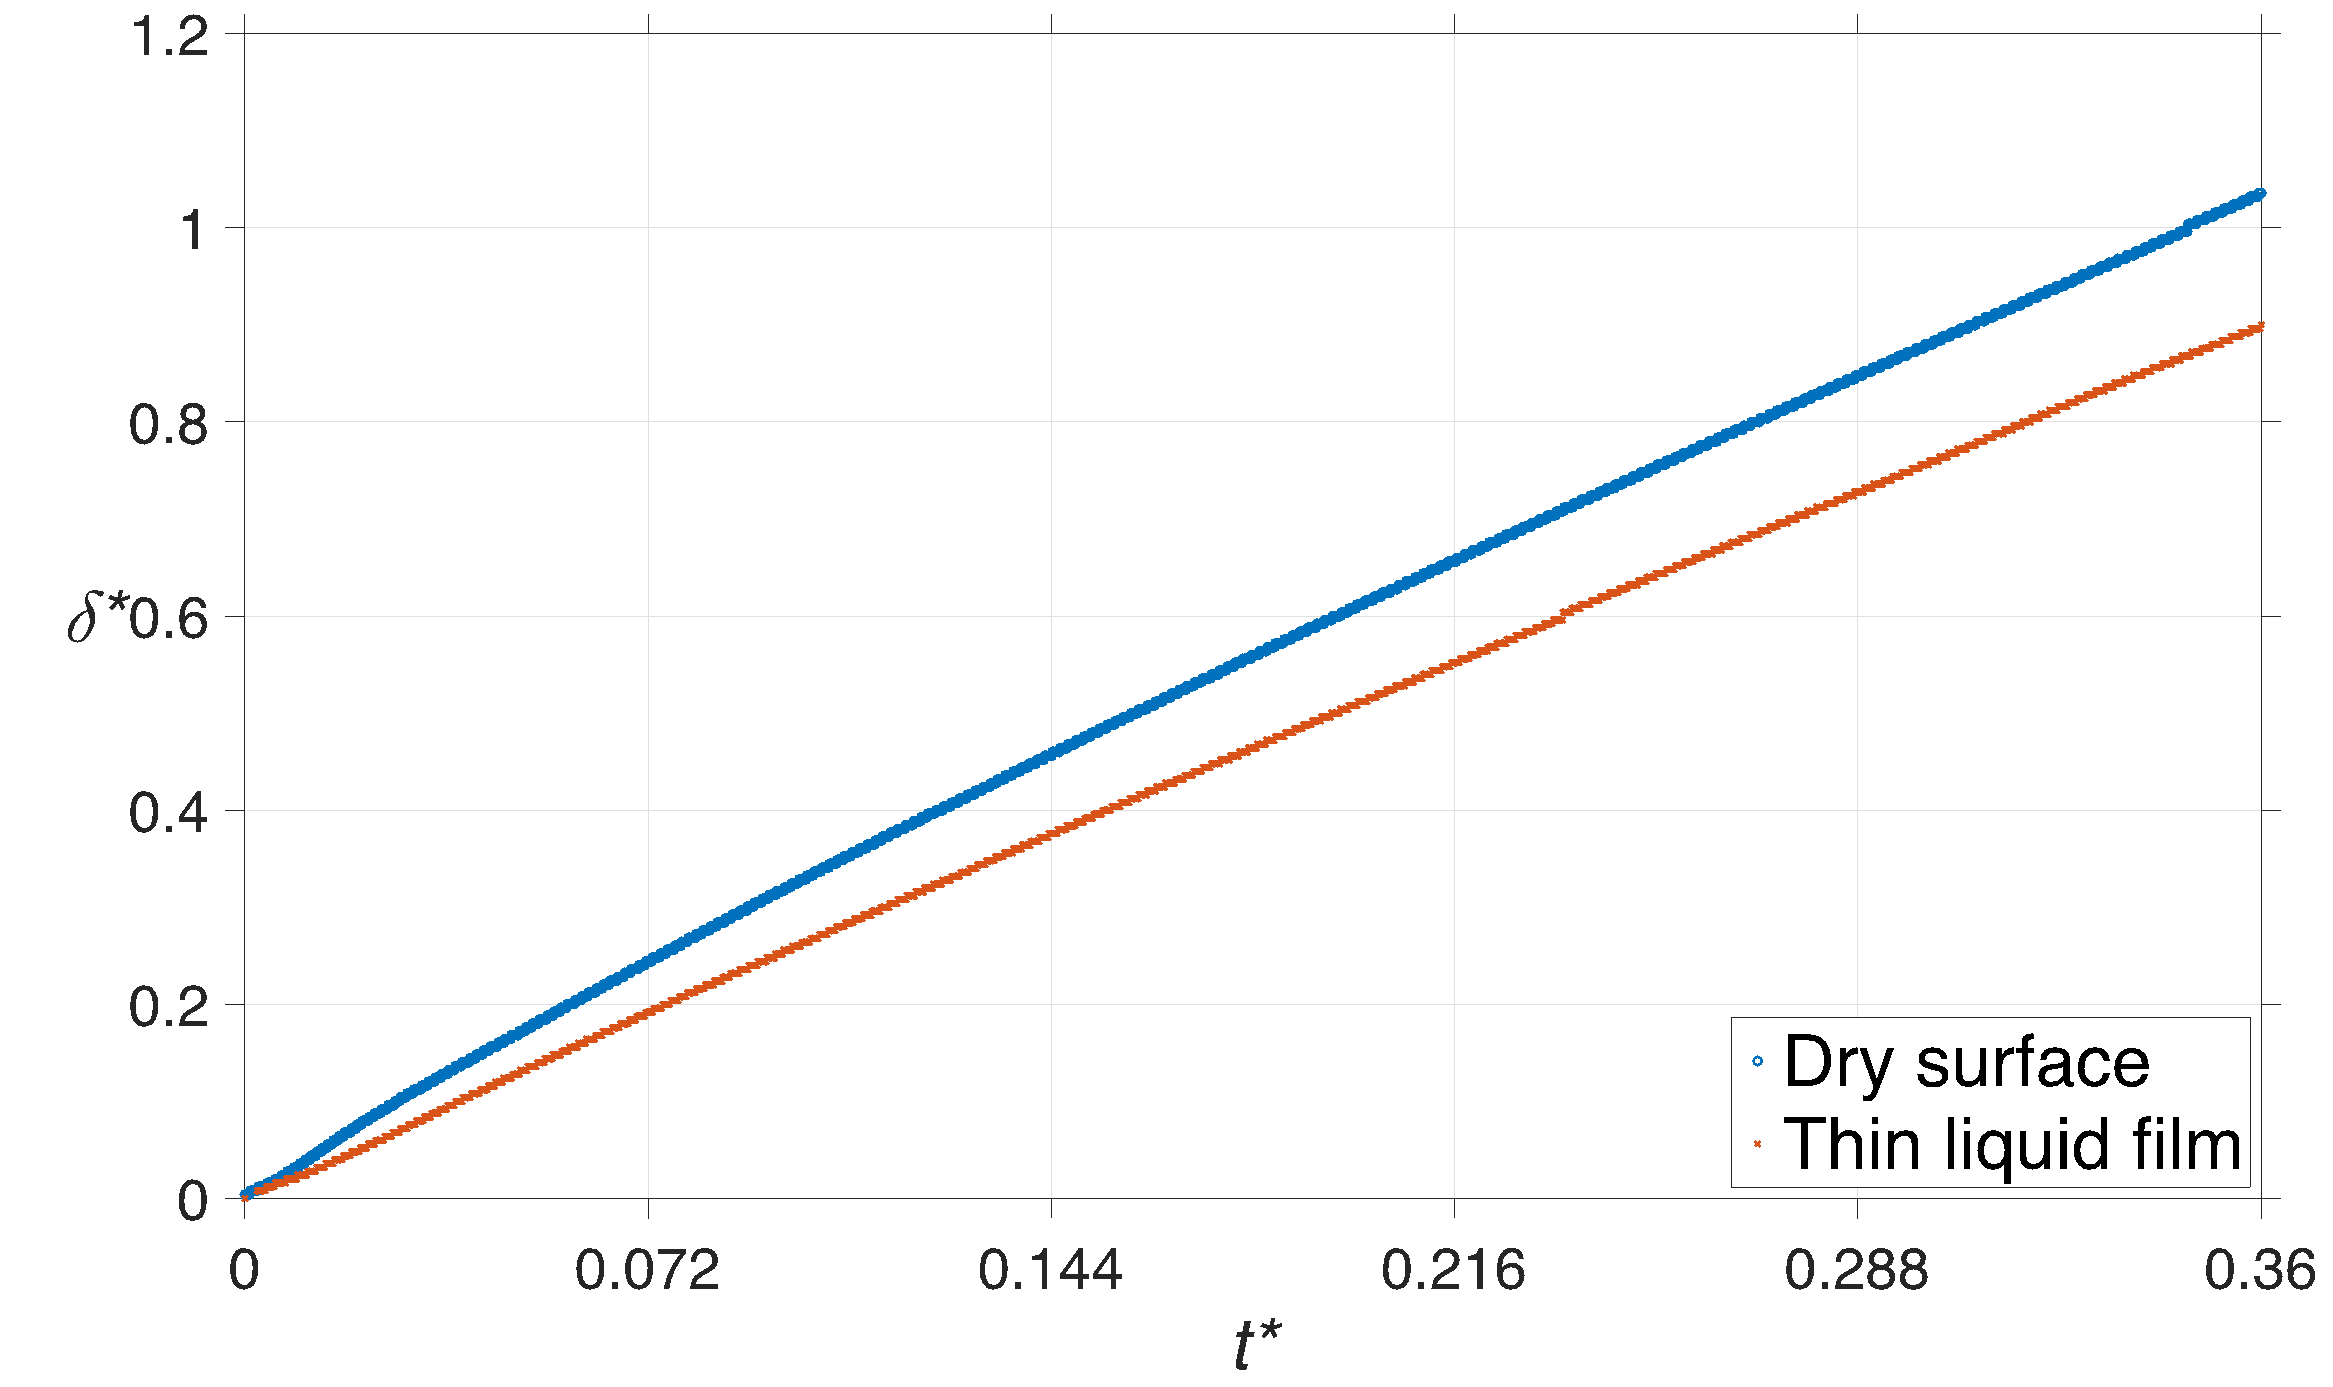
300 K and a pressure of 100 kPa. Figure 3 displays the non-dimensional height
of the compressed region, ![]() , during the impingement. The
compressed region in the liquid is formed due to the increase of density as a
result of the impact pressure. The liquid bulk outside this region, referred to
as undisturbed region, does not experience any change in its properties and
therefore is completely unaware of the impact. In both scenarios, the graph is
almost linear, and the slope, representing the speed at which the high-pressure
front penetrates into the liquid bulk, is equal to 1410 m/s and 1246 m/s for
the dry surface and thin liquid film, respectively.
, during the impingement. The
compressed region in the liquid is formed due to the increase of density as a
result of the impact pressure. The liquid bulk outside this region, referred to
as undisturbed region, does not experience any change in its properties and
therefore is completely unaware of the impact. In both scenarios, the graph is
almost linear, and the slope, representing the speed at which the high-pressure
front penetrates into the liquid bulk, is equal to 1410 m/s and 1246 m/s for
the dry surface and thin liquid film, respectively.
It is worth mentioning that the speed of compressed region propagation of 1410 is very close to the speed of sound in undisturbed water, i.e. 1430 m/s under ambient conditions, for the case of the impact on a dry rigid surface. This is to be expected as the information about the solid obstacle, in the path of the fluid, travels at the speed of sound via compression waves across the liquid region. These series of compressions waves, formed when liquid particles impact the solid surface, are responsible to bring the liquid to rest as it touches down on the surface, leading to the formation of stagnation region. It should be noted that the speed of the compression waves inside the compressed region is above the speed of sound in undisturbed water due to an increase in water density. This is the main reason behind the development of the high-pressure front which separates the compressed region from the rest of the liquid. On the other hand, this propagation speed is reduced by 11.6% when the impact occurs on a film.
As the water drop collides with the water film, it is able to deform the liquid film, as opposed to a rigid solid, and a large portion of its inertia is dissipated during this deformation. As a result, the strength of the compression waves that are formed and their speed is weakened, which explains why the growth rate of the compressed region in the water drop is reduced. It was demonstrated in our previous study [28] that a compressed region is also formed inside the water film which would lead to the formation of a secondary high-pressure front when it reaches the solid surface. The main reason behind this phenomenon is the fact that the reflection of a compression wave from a solid surface is also a compression wave. Another interesting phenomenon that is observed during the impingement of a liquid droplet on a solid surface is the formation of a strong tangential flow on the surface. Figure 4 demonstrates the variation of the non-dimensional radial velocity of the gas and liquid phases during the impact. As the droplet touches down on the surface, it compresses the air beneath it and the negative pressure gradient that is generated in the air would lead to its escaping, hence, a tangential flow is developed which can reach up to 5 times the impingement velocity. This radial flow is also seen in the liquid phase, although with a time lag. As the droplet starts spreading on the surface due to its high inertia, the contact line, which has a very high velocity initially, would be slowed down due to the viscous effects and eventually overtaken by the high-pressure front. At such a moment, a very large difference in pressure and density would exist in the three-phase region, i.e., solid-liquid-gas, which would lead to the eruption of a lateral jet at the droplet periphery, reaching a velocity of up to 3.75 times the impact speed. As it was discussed in our previous studies, i.e., [27] and [28], the formation and eruption of lateral flow from the droplet edge is delayed when the impact occurs on a thin liquid film compared to a dry surface which is due to the damping effect caused by the presence of the liquid layer between the droplet and solid surface.
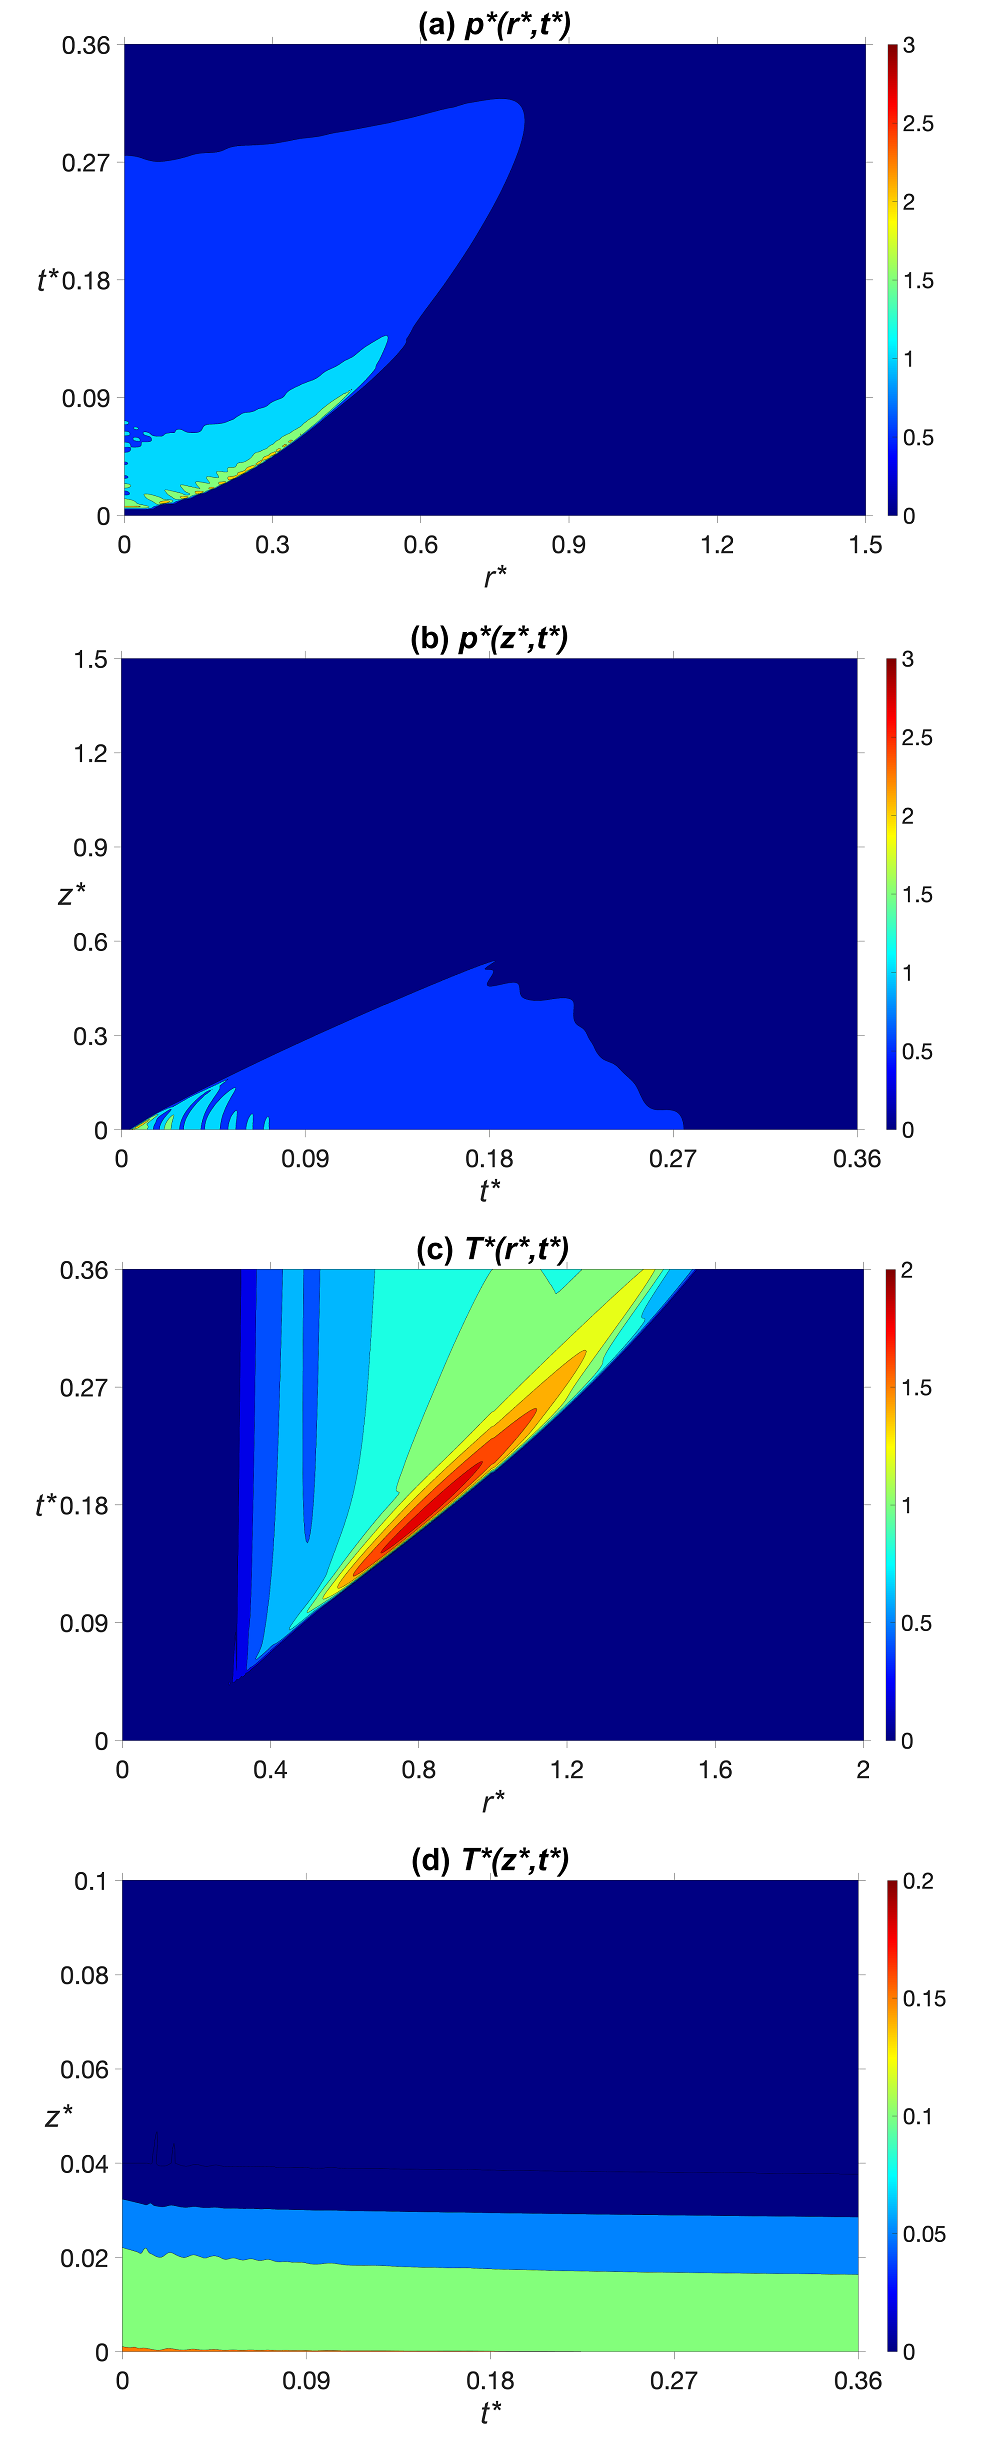
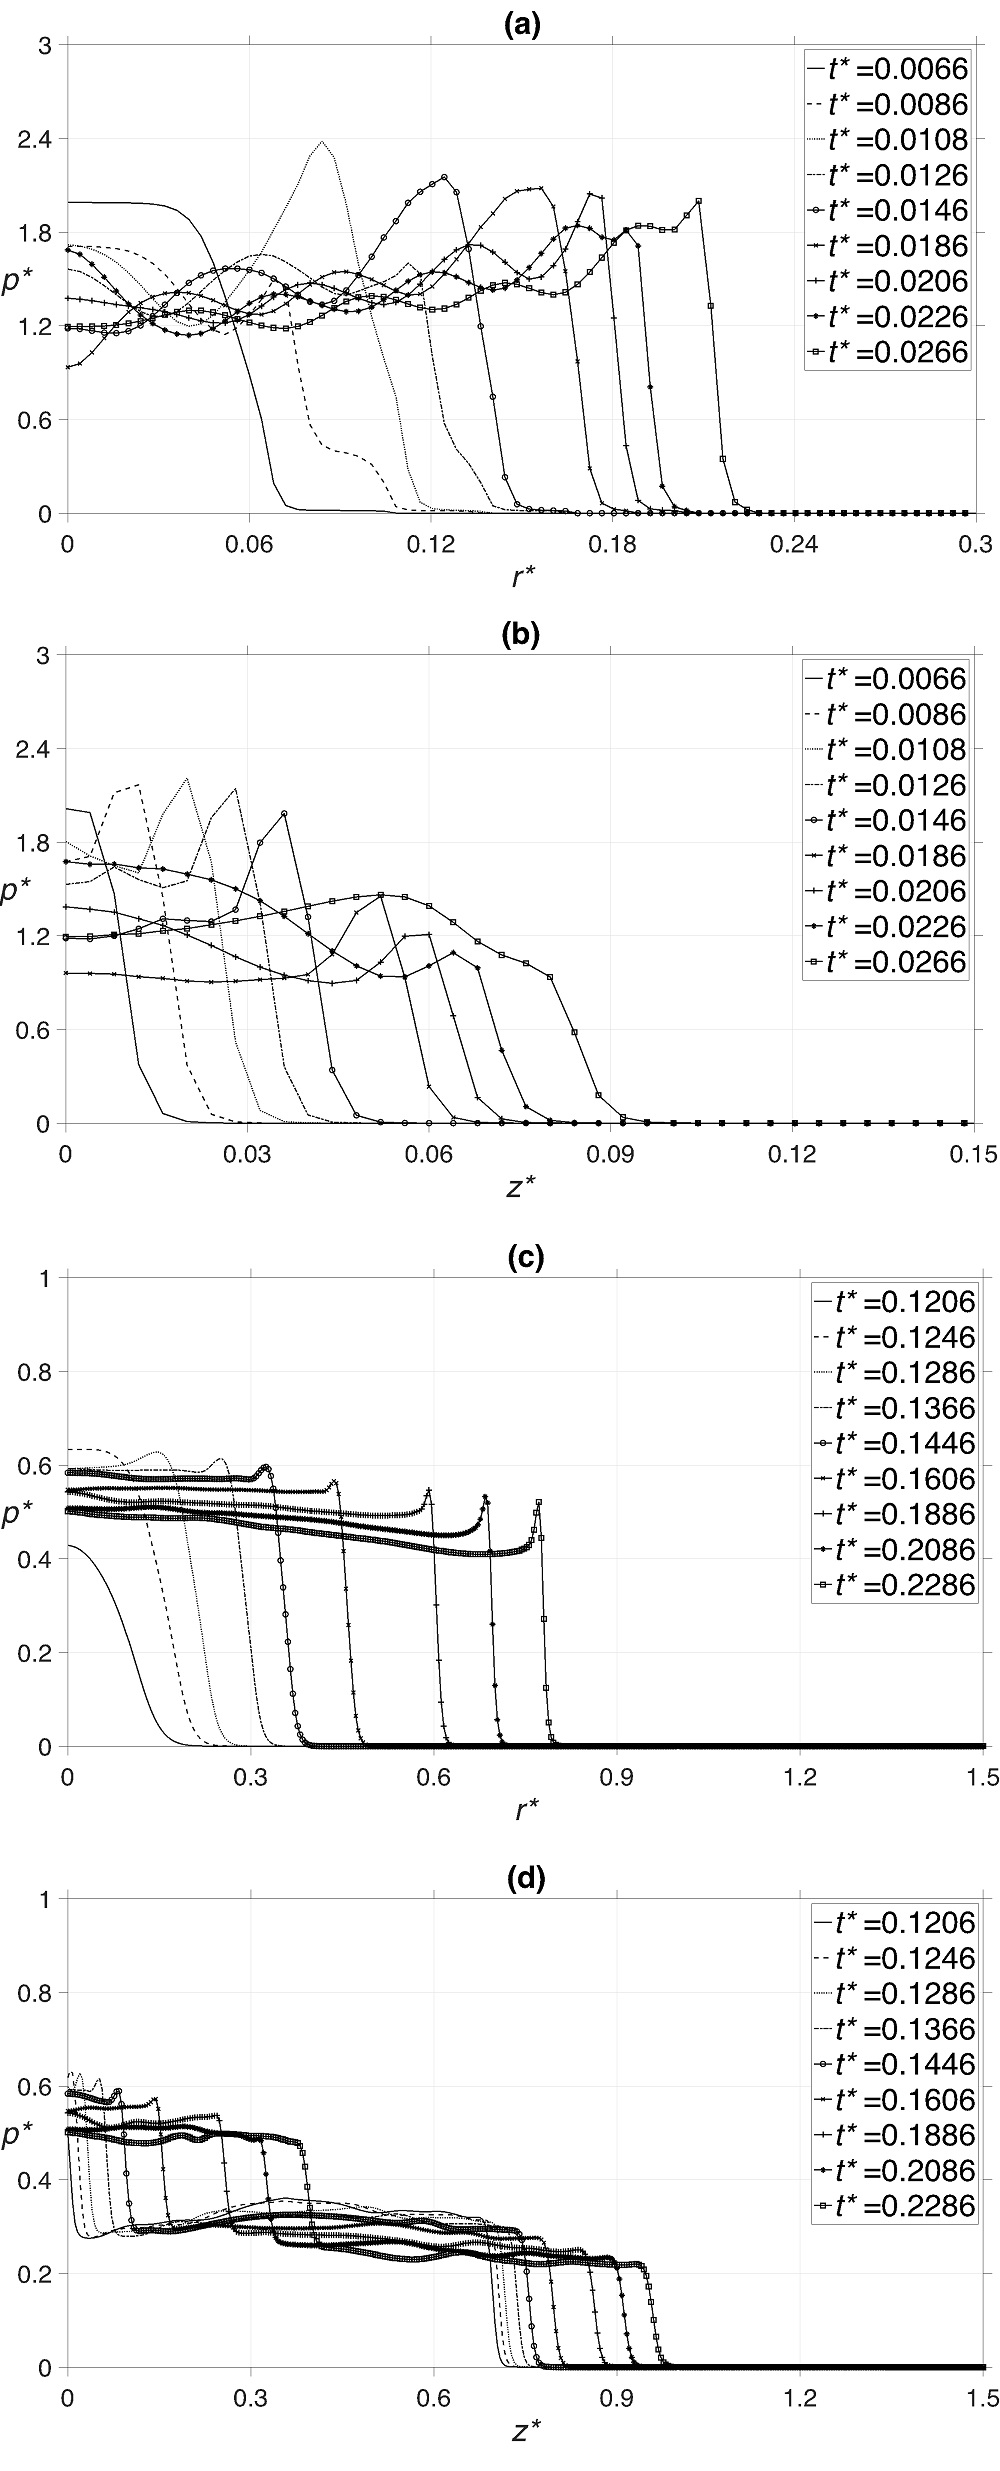
The time evolution of non-dimensional pressure and temperature along radial and axial directions is presented in figure 5. As it can be seen in figure 5 (a), the radius on the surface that would experience a large pressure is less than 80% of the drop radius. This is due to the fact that the high pressure dissipates quickly when the droplet spreads over the surface. The appearance of the high-pressure front and its movement toward the droplet edge is also clear. The high-pressure stripes, observed in figure 5 (b) along the drop axis, is due to superimposition of compression waves traveling in the compressed region faster than the speed of sound. The contours of non-dimensional temperature, shown in figure 5 (c) and (d), suggest that the fluid temperature can increase by 200% in certain areas due to the viscous heating that is taking place on the surface. Provided that the pressure in this area is almost atmospheric, the water can evaporate which may, in return, cause cavitation on the surface. It should be noted that the current model lacks phase change equations, therefore, is not capable of simulating boiling, which can be addressed in future studies.
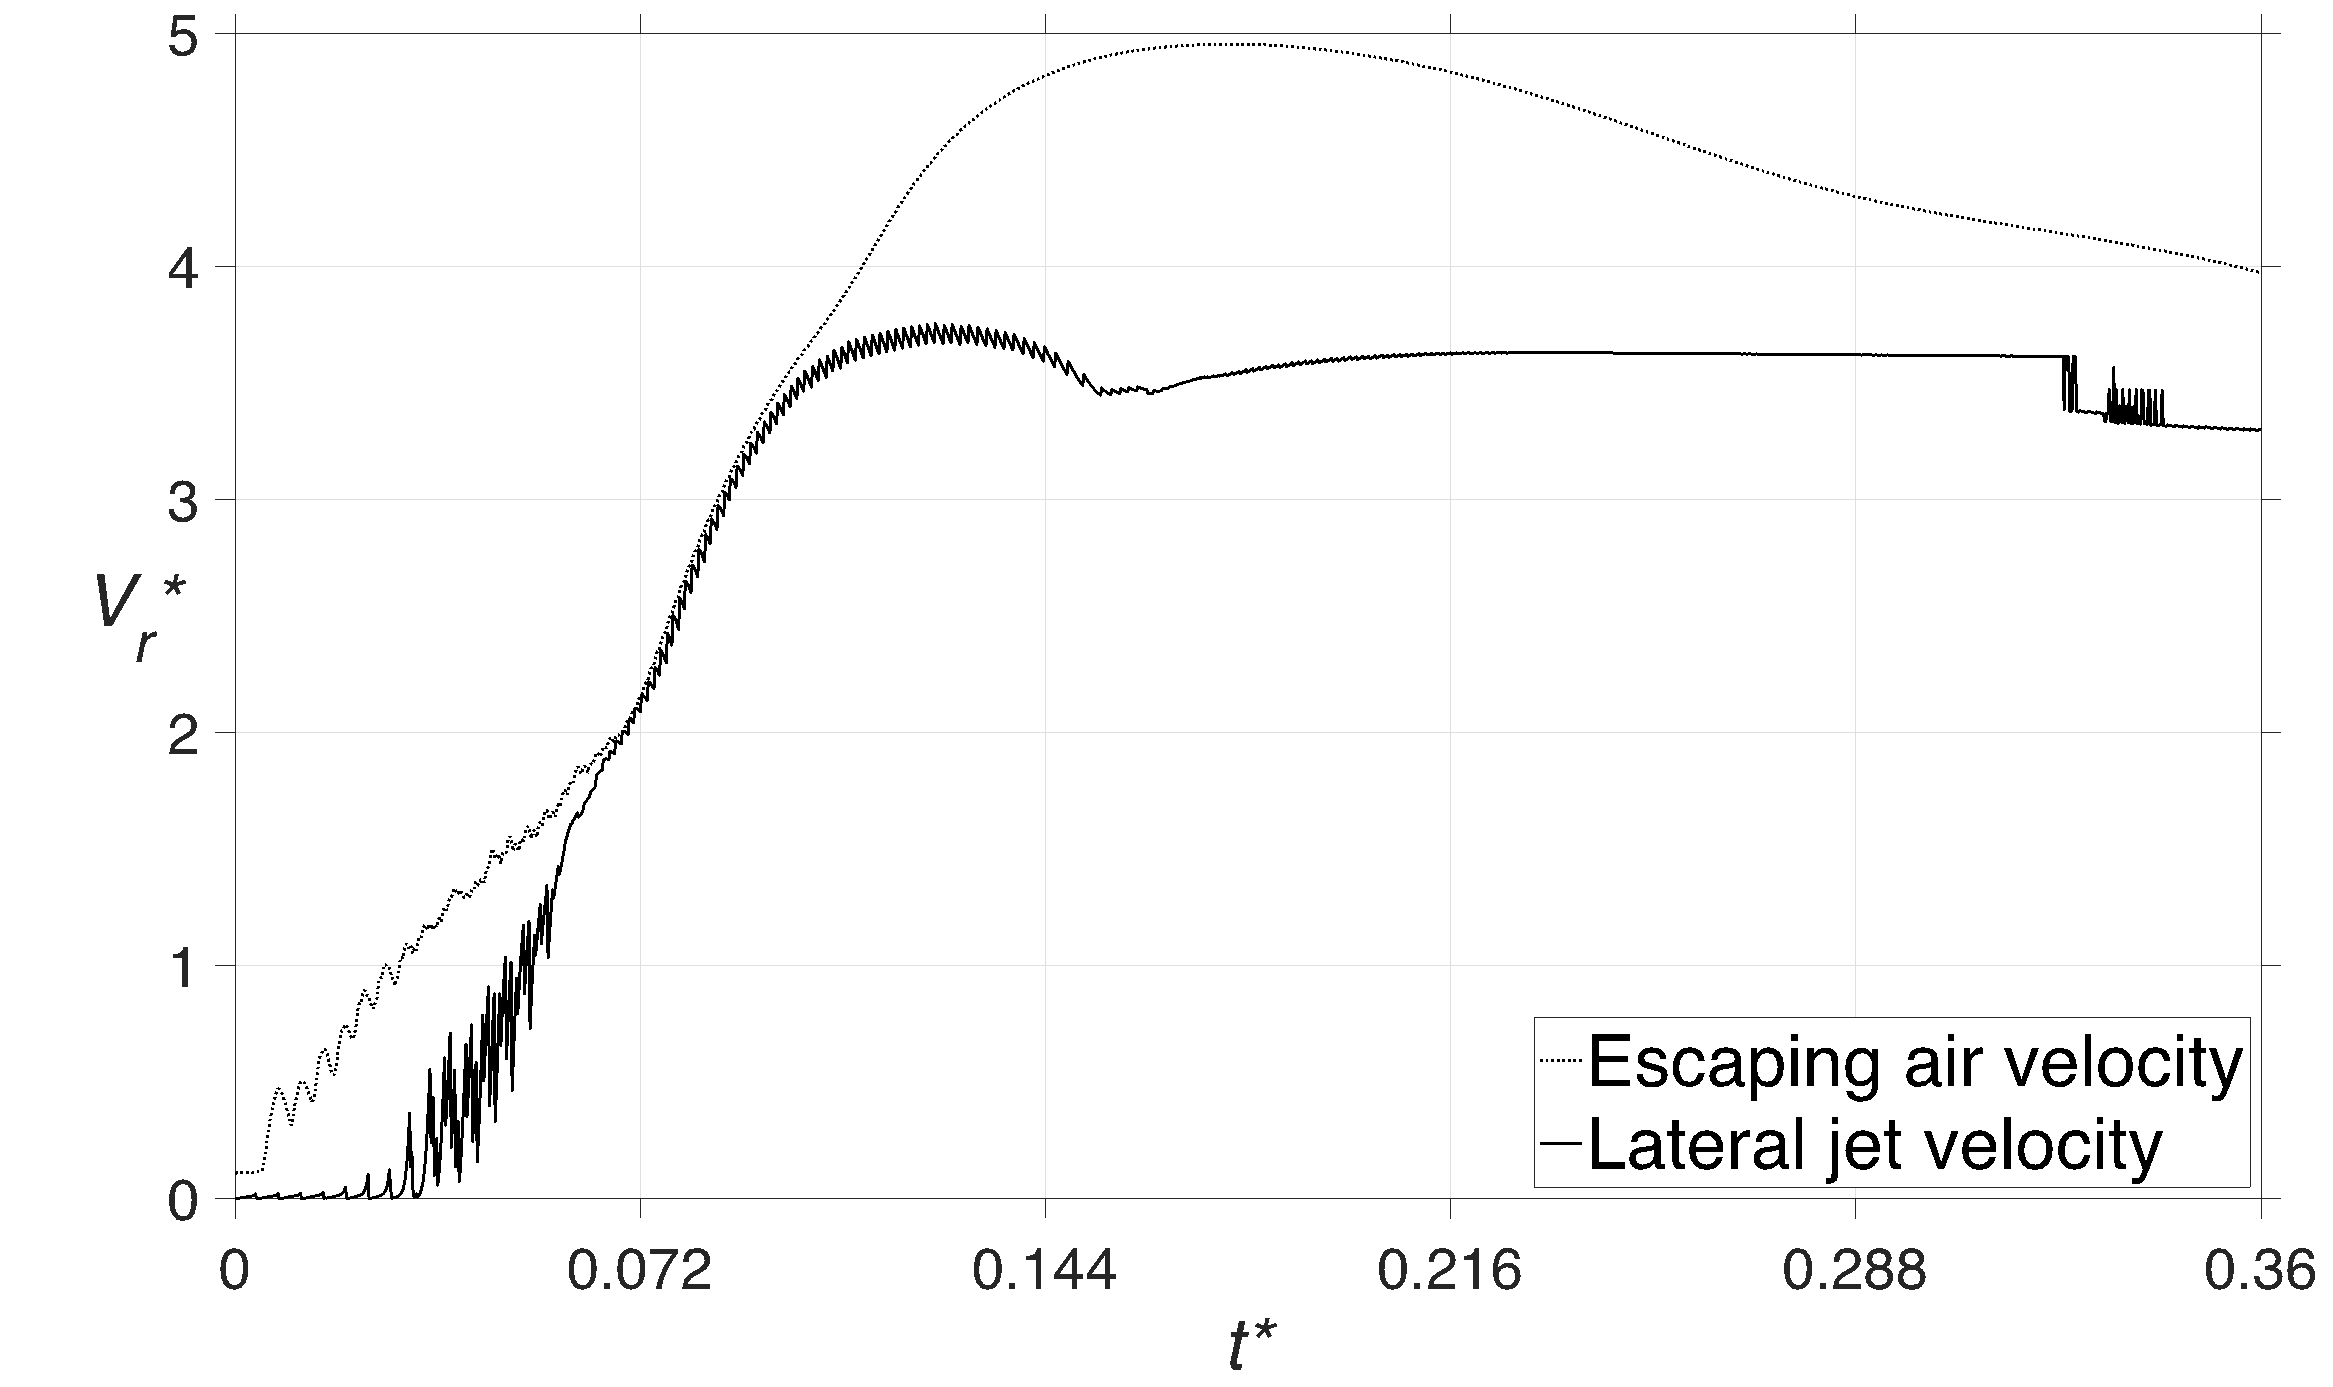
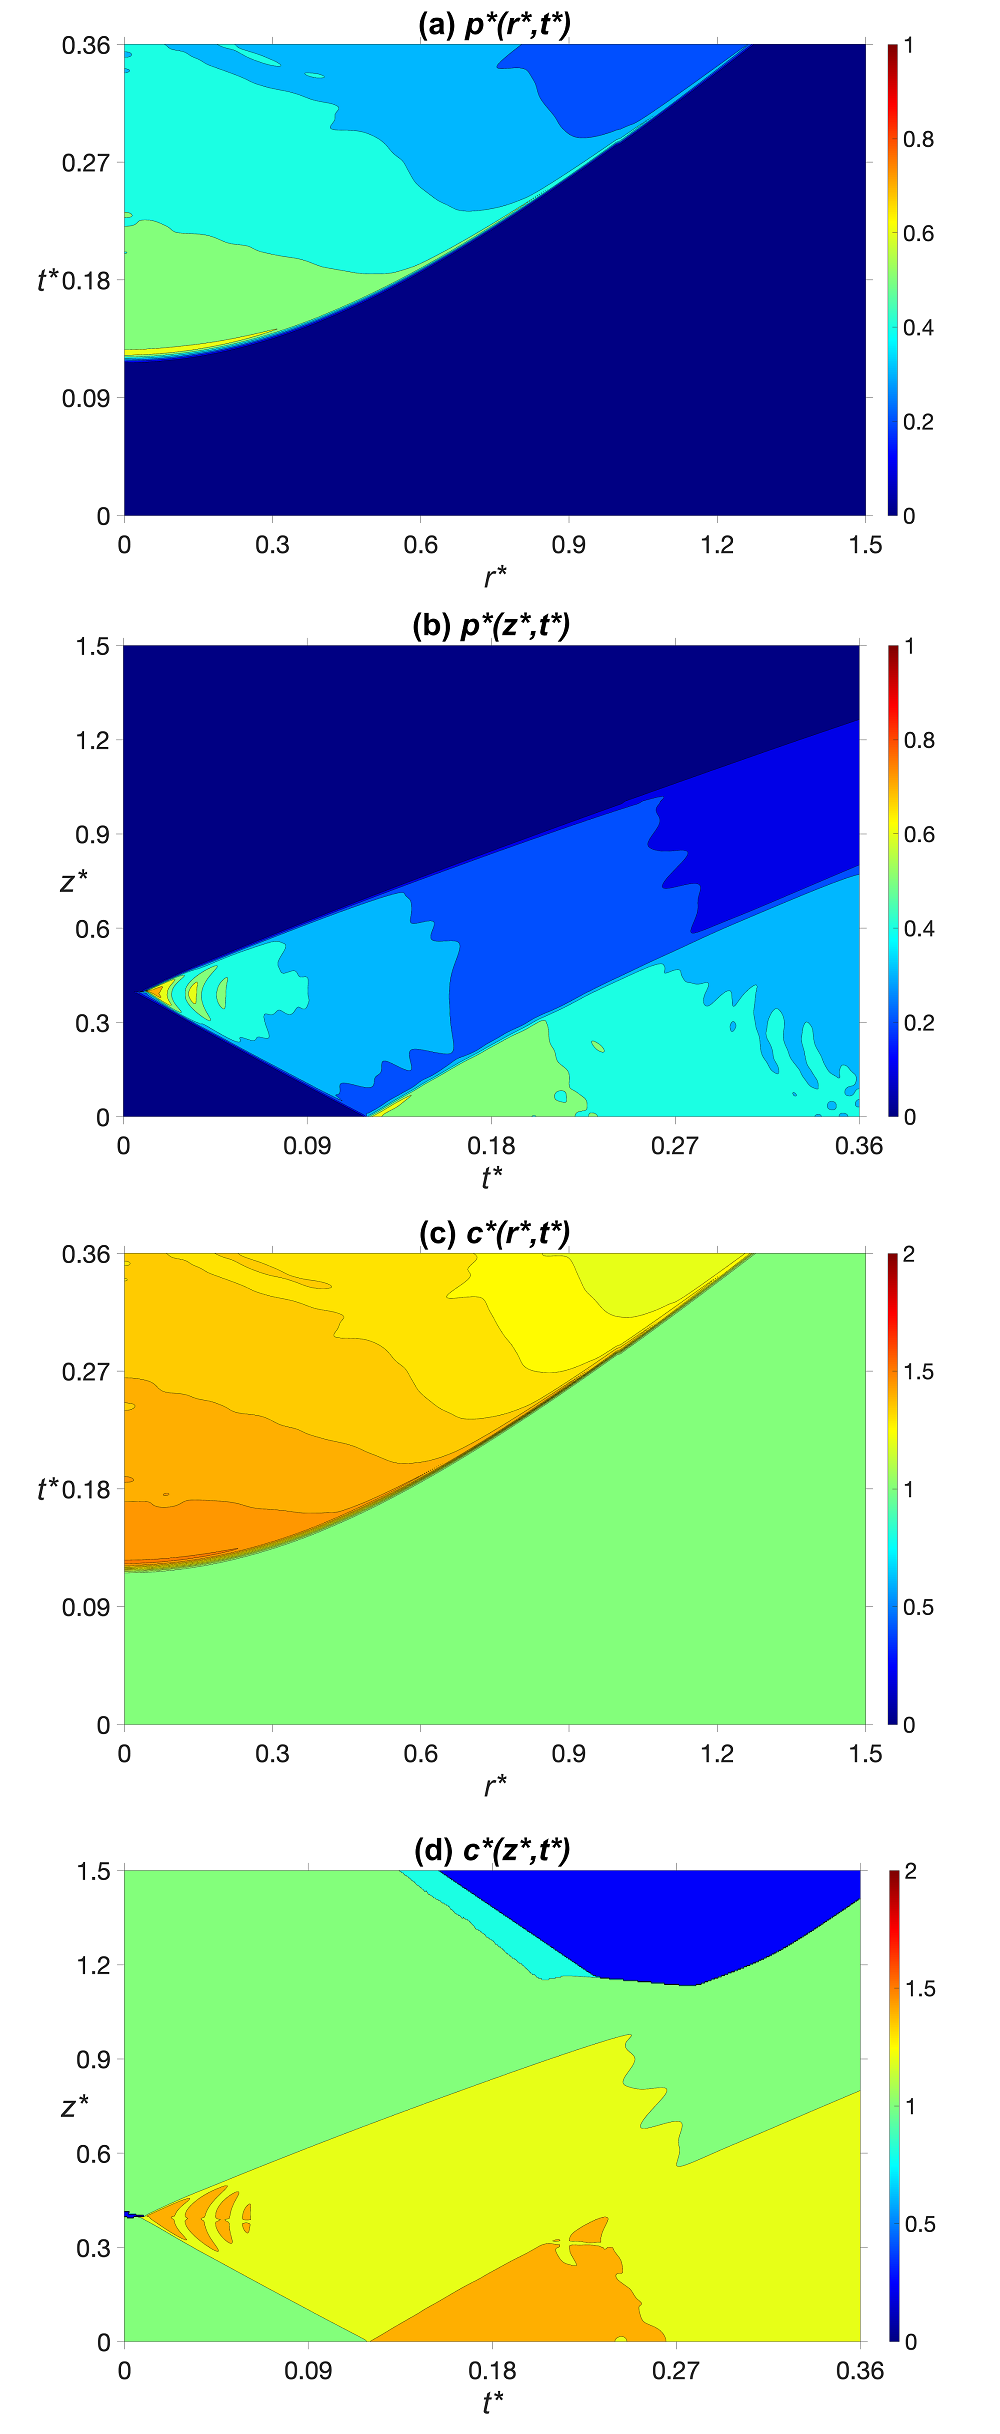
Figure 6 illustrates the contour of non-dimensional pressure and speed of sound for droplet impact on a liquid film. Figure 6 (a) clearly demonstrates that the generated pressure is significantly reduced and the pressure build-up on the surface is delayed until t* = 0.12. However, the radius of influence is widened to 1.2 times the initial drop radius due to the presence of the liquid film between the droplet and the solid surface. This is also observed in figure 6 (c) which shows the compressed region where the speed of sound is above the value for undisturbed water, i.e., for c* > 1. The behavior of non-dimensional pressure and speed of sound along the drop axis, presented in figure 6 (b) and (d), respectively, is very interesting. The initial height of the water film is 100 µm, corresponding to z* = 0.4, where the onset of compressed region growth is located. It is evident that the high-pressure front travels in both directions, i.e., in the liquid droplet (z* > 0.4) and liquid film (z* < 0.4). This is the reason why the speed of compressed region propagation into the liquid droplet, as mentioned above, is less than the case of impact on dry surface.
The dark blue color in figure 6 (b) corresponds to the undisturbed region in the liquid, which is separated from the compressed region with a straight line. The slope of this line, that is equal to 1246 m/s, indicates the speed at which the high-pressure front travels in both liquid droplet and film. This growth continues until the bottom portion of the compressed region reaches the solid surface at t* = 0.12 and a secondary high-pressure front starts to propagate upward. The second straight line in figure 6 (b), that has a sharper gradient, corresponds to the speed of the secondary high-pressure front, which equals to 1773 m/s, that is 24% above the initial speed of sound (1430 m/s). The propagation speed of the secondary compression wave is larger than the first wave since this liquid region has been compressed once already, therefore, the speed of sound in this area would be higher. This can be also seen in yellow and orange areas displayed in figure 6 (d). From the pressure contour in figure 6 (b), it is clear that the secondary wave travels across the liquid film until it reaches the initial film height at t* = 0.23. Around this time, the secondary high-pressure front traveling upward is met with the compression waves emitted by the liquid particles continuing their downward motion and as a result the pressure would decrease due to this cancelation effect.
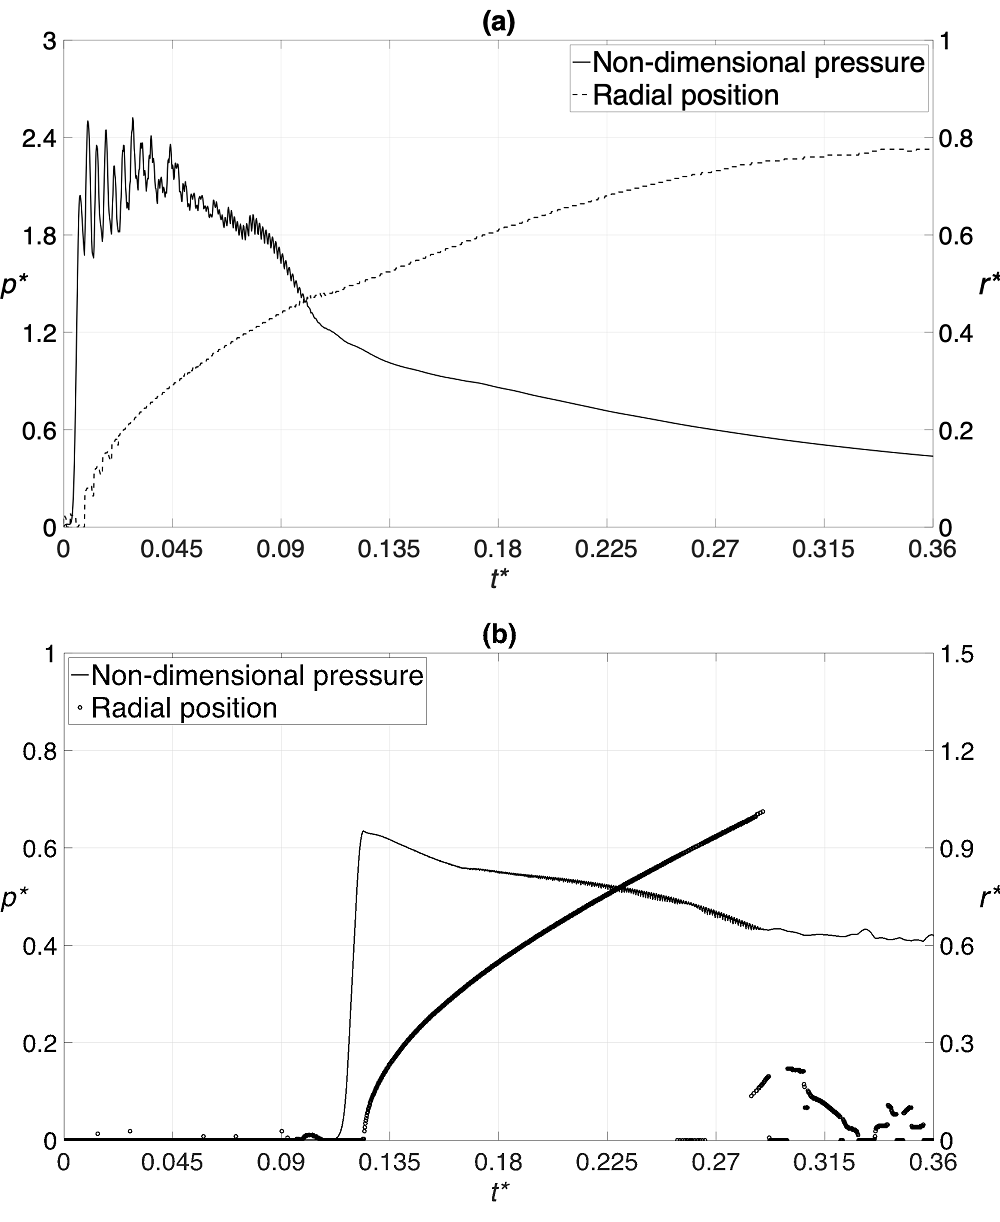
The profiles of non-dimensional pressure at various times along radial and axial directions for impact on both dry surface and liquid film are displayed in figure 7. It should be mentioned that the onset of impact, i.e., t* = 0, is defined as the time when the droplet reaches the solid surface and the liquid film surface for the case of impingement on a dry surface and liquid film, respectively. This is reason behind the time lag of t* = 0.12 in figure 6 (a), as previously discussed. The highest pressure is observed around the drop axis at early times after the impact and then moves out radially toward the droplet edge until it reaches its maximum magnitude when the lateral jetting occurs. It is worth noting that the maximum pressure along the drop axis is slightly above the surface where the high-pressure front is located. In figure 8, the loci of maximum non-dimensional pressure on the solid surface and its radial location are plotted for both cases. The maximum pressure that is recorded on the solid is 2.52 times the waterhammer pressure and occurs at r* = 0.22 for the impact on the dry surface and 0.63 times the waterhammer pressure and occurs at r* = 0 for the impact on the liquid film. Therefore, the maximum impact pressure on the solid is 4 times higher on the dry surface compared to the thin liquid film.
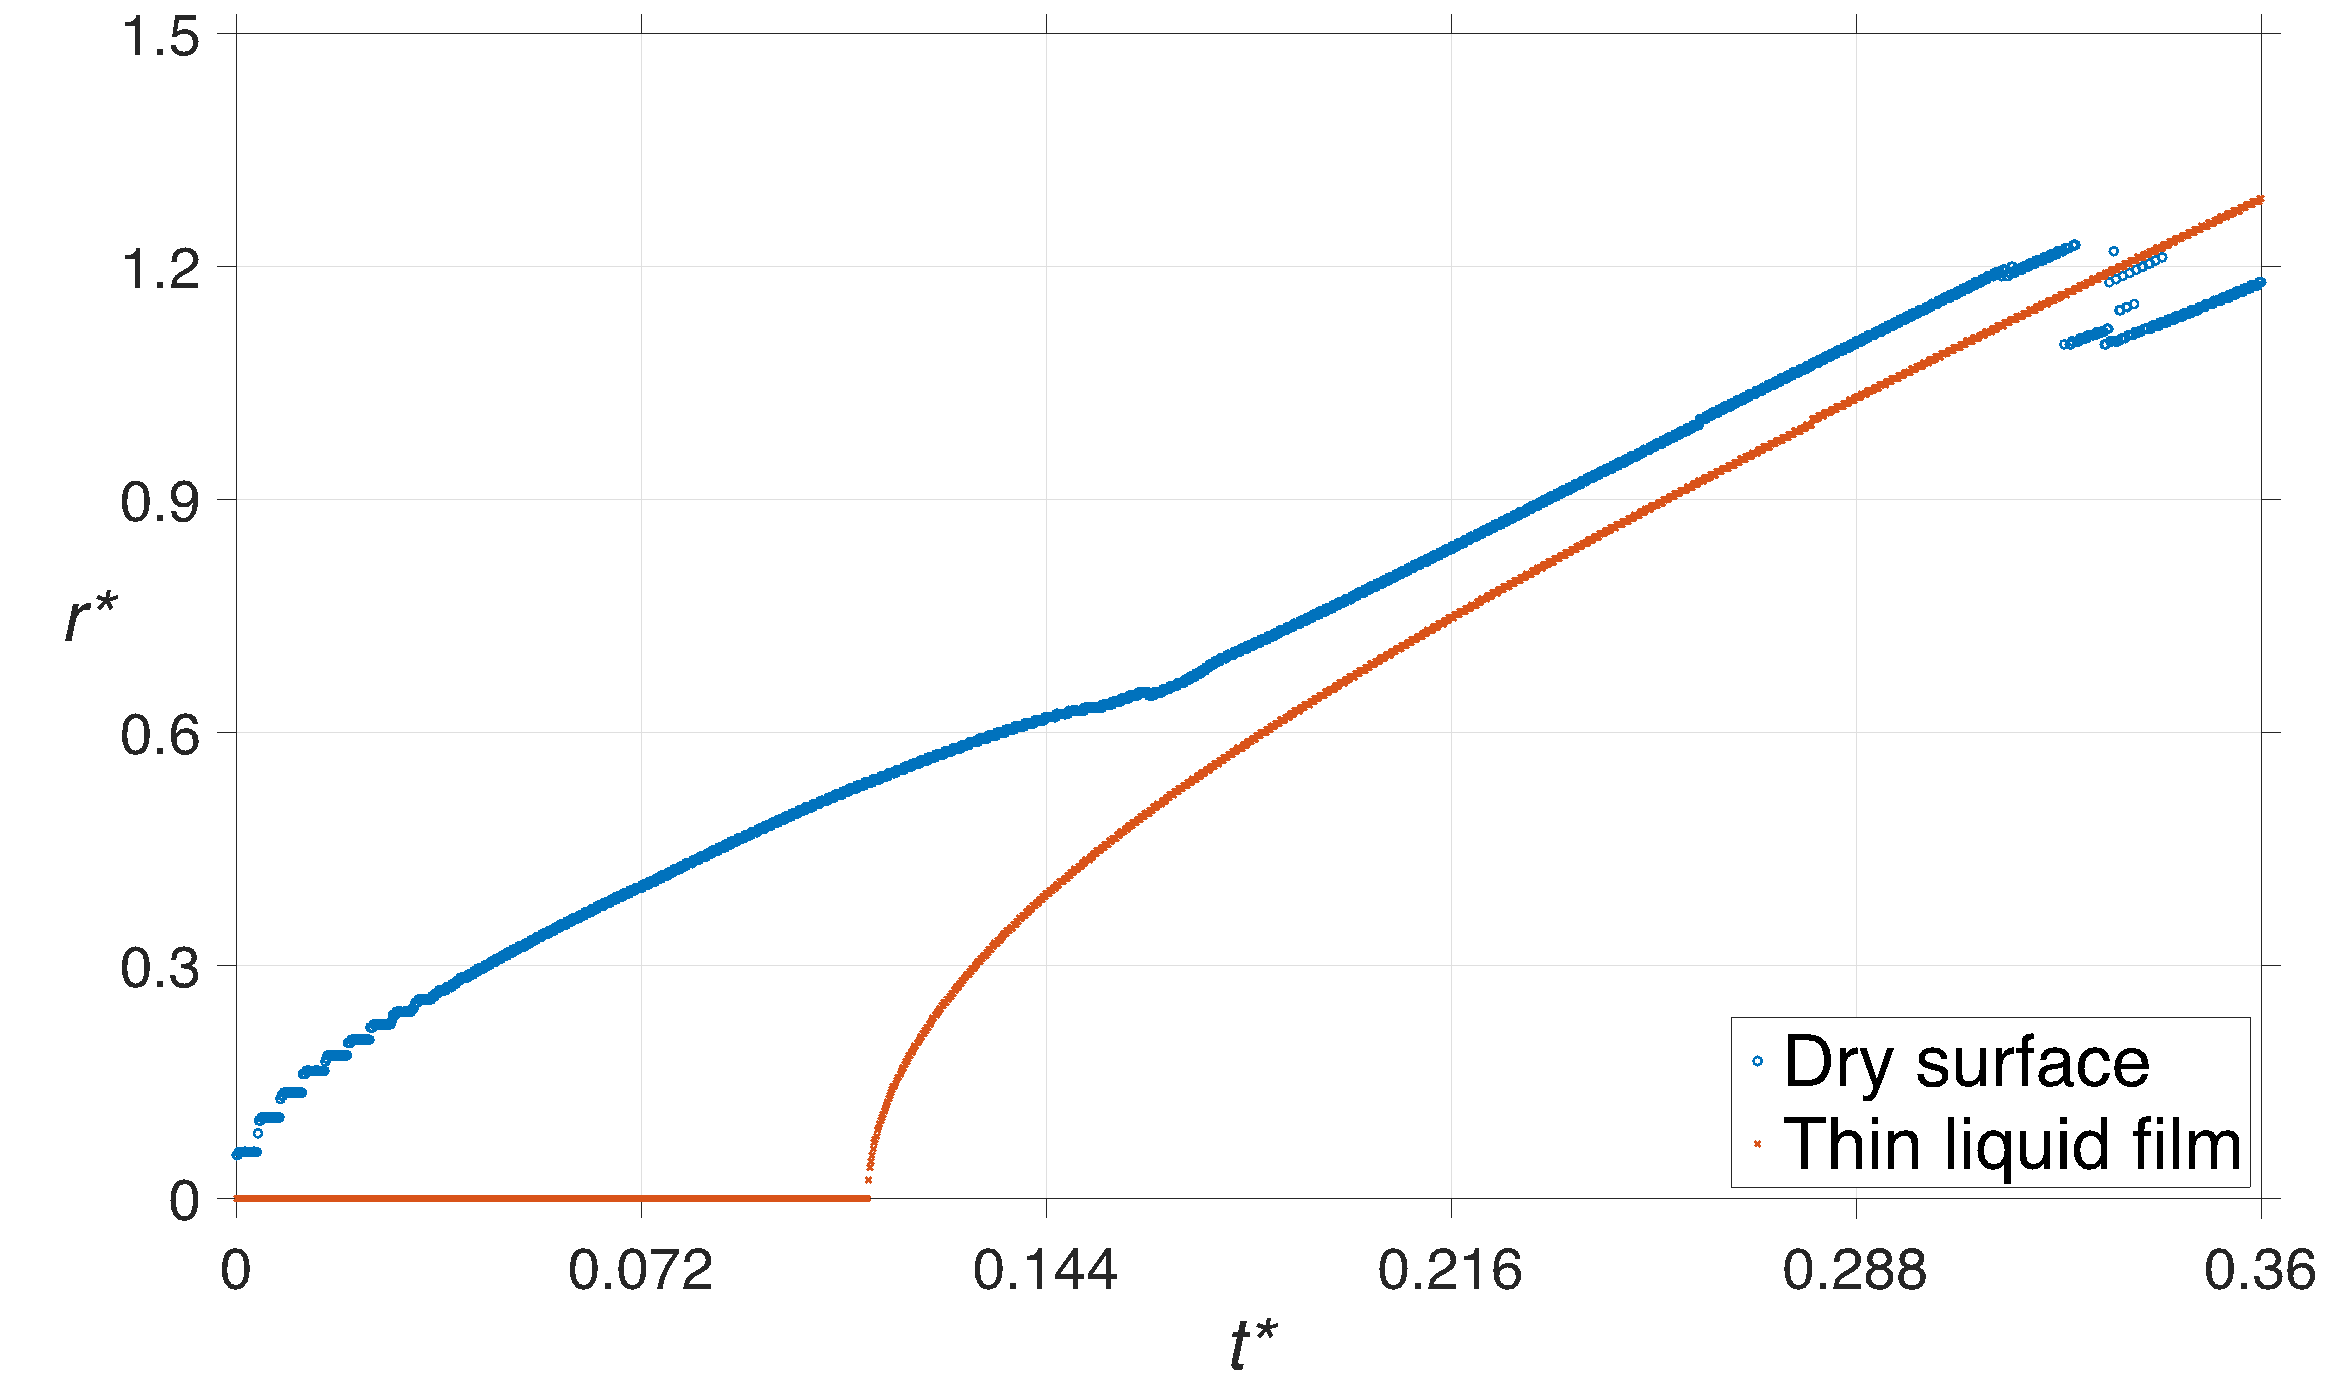
The non-dimensional radius (r*) of the compressed region that is formed on the solid surface is plotted in figure 9 for both cases. In case of the impact on a dry surface, the compressed region has a finite radius at t* = 0, which indicates the time of touch-down on the solid. This is to be expected since the droplet is slightly flattened, due to the presence of compressed air that is beneath it, as it approaches the solid surface, which would not occur during the impact on the liquid film. The radius of compressed region increases with time for both cases as the droplet continues its downward motion and it suddenly decreases around t* = 0.33 on the dry surface since ligaments of liquid are detached from the droplet as primary breakup takes place.
Figure 10 illustrates the value of the non-dimensional pressure integrated over the compressed region area and is compared to the 1D waterhammer pressure, which is a constant for a given impingement velocity. The waterhammer pressure corresponds to the impact of a liquid column on a rigid surface, which leads to a uniform pressure on the surface since it is assumed to be one-dimensional. All the pressure values in figure 10 are non-dimensionalized with respect to the waterhammer pressure of 500 m/s liquid-solid impact, which is equal to 714 MPa.
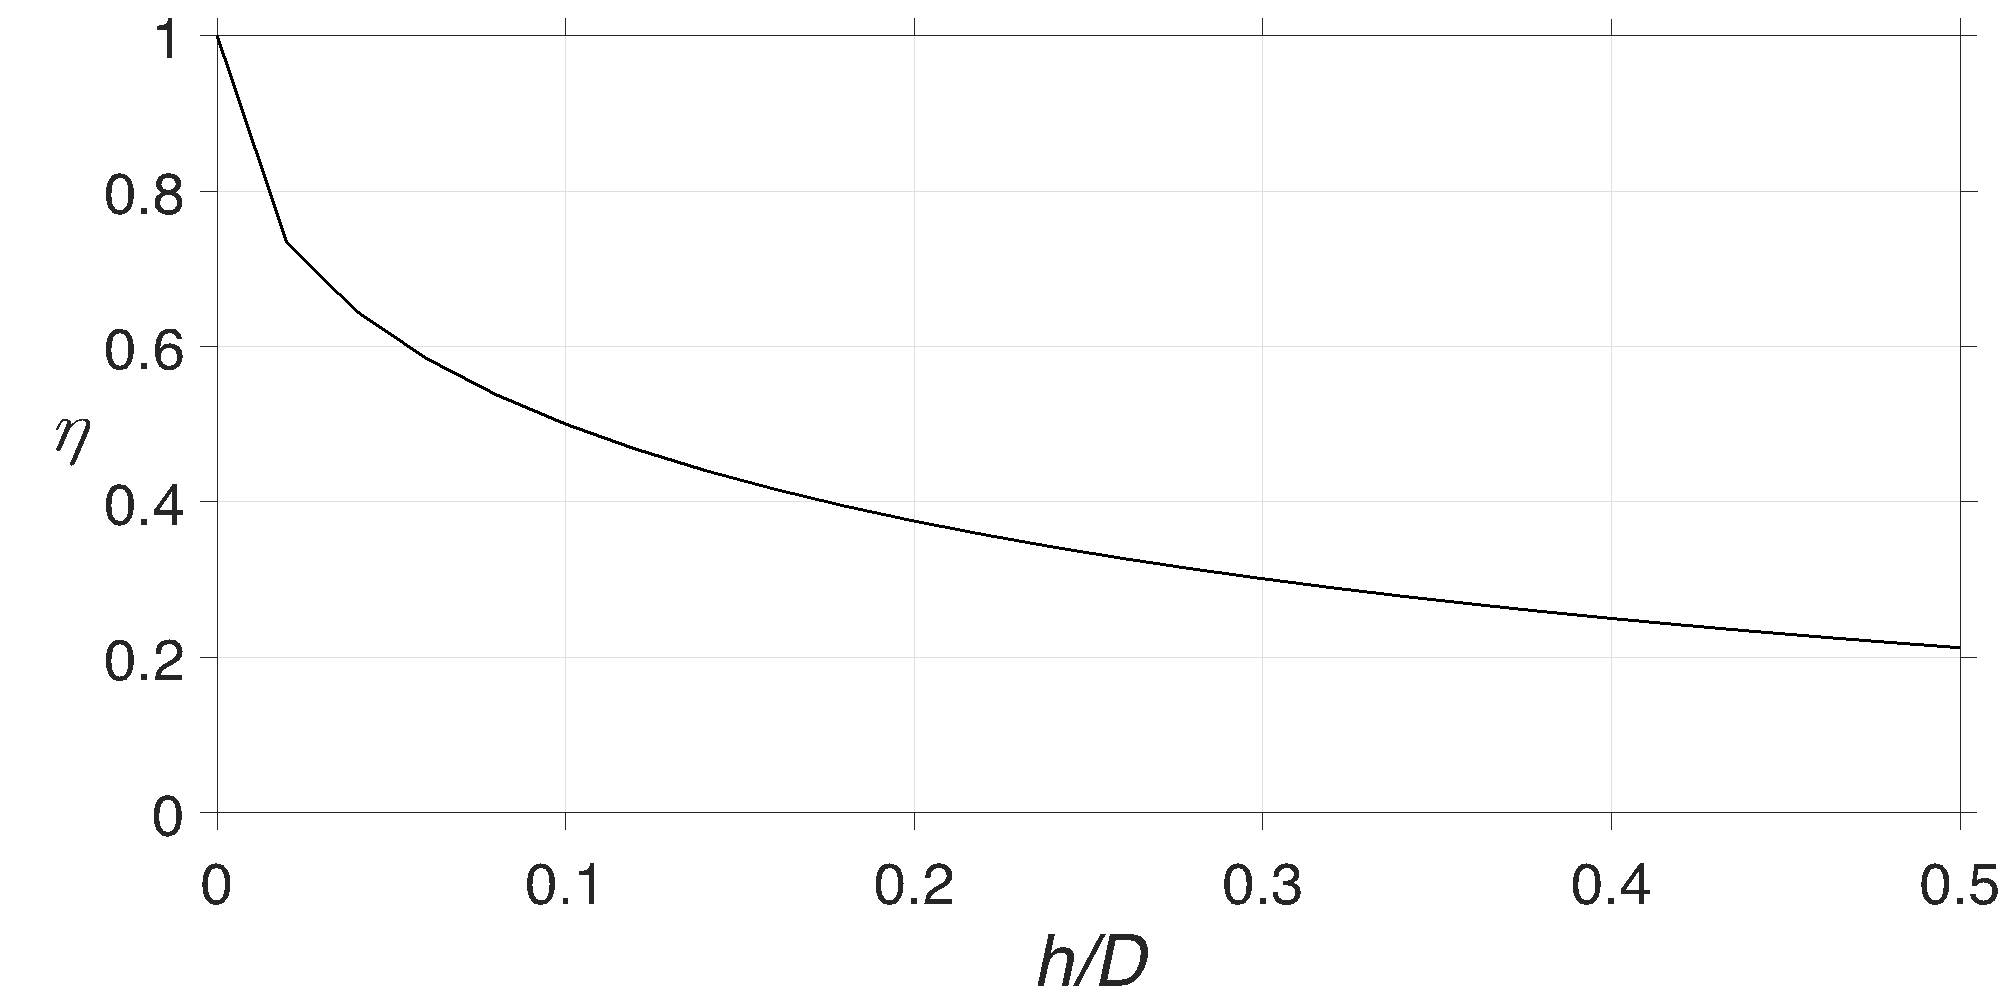
The non-dimensional waterhammer
pressure is reduced for the case of the drop impact on the wetted surface since
the liquid film beneath the droplet would absorb part of the impingement inertia
and therefore reduce the impact pressure. In order to calculate the reduced
waterhammer pressure, the empirical relation developed by Sasaki et
al. [33] for the damping coefficient (![]() ) of water
droplet impact on a carbon steel plate, plotted in figure 11 versus film
thickness to droplet diameter ratio (h/D) for an impact velocity of
500 m/s, is utilized which is as follows,
) of water
droplet impact on a carbon steel plate, plotted in figure 11 versus film
thickness to droplet diameter ratio (h/D) for an impact velocity of
500 m/s, is utilized which is as follows,
Based on equation (10), the impact force decreases exponentially as the liquid film thickness to droplet diameter ratio increases, at the same impingement velocity. For the impact scenario plotted in figure 10, i.e., droplet diameter of 500 μm and film thickness of 100 μm, h/D is equal to 0.2, which would result in a damping coefficient of 0.37. This value indicates that the impact pressure is reduced by 63% if the water droplet is impinged onto a liquid pool with a height of 100 μm, as opposed to a dry surface at the same speed.
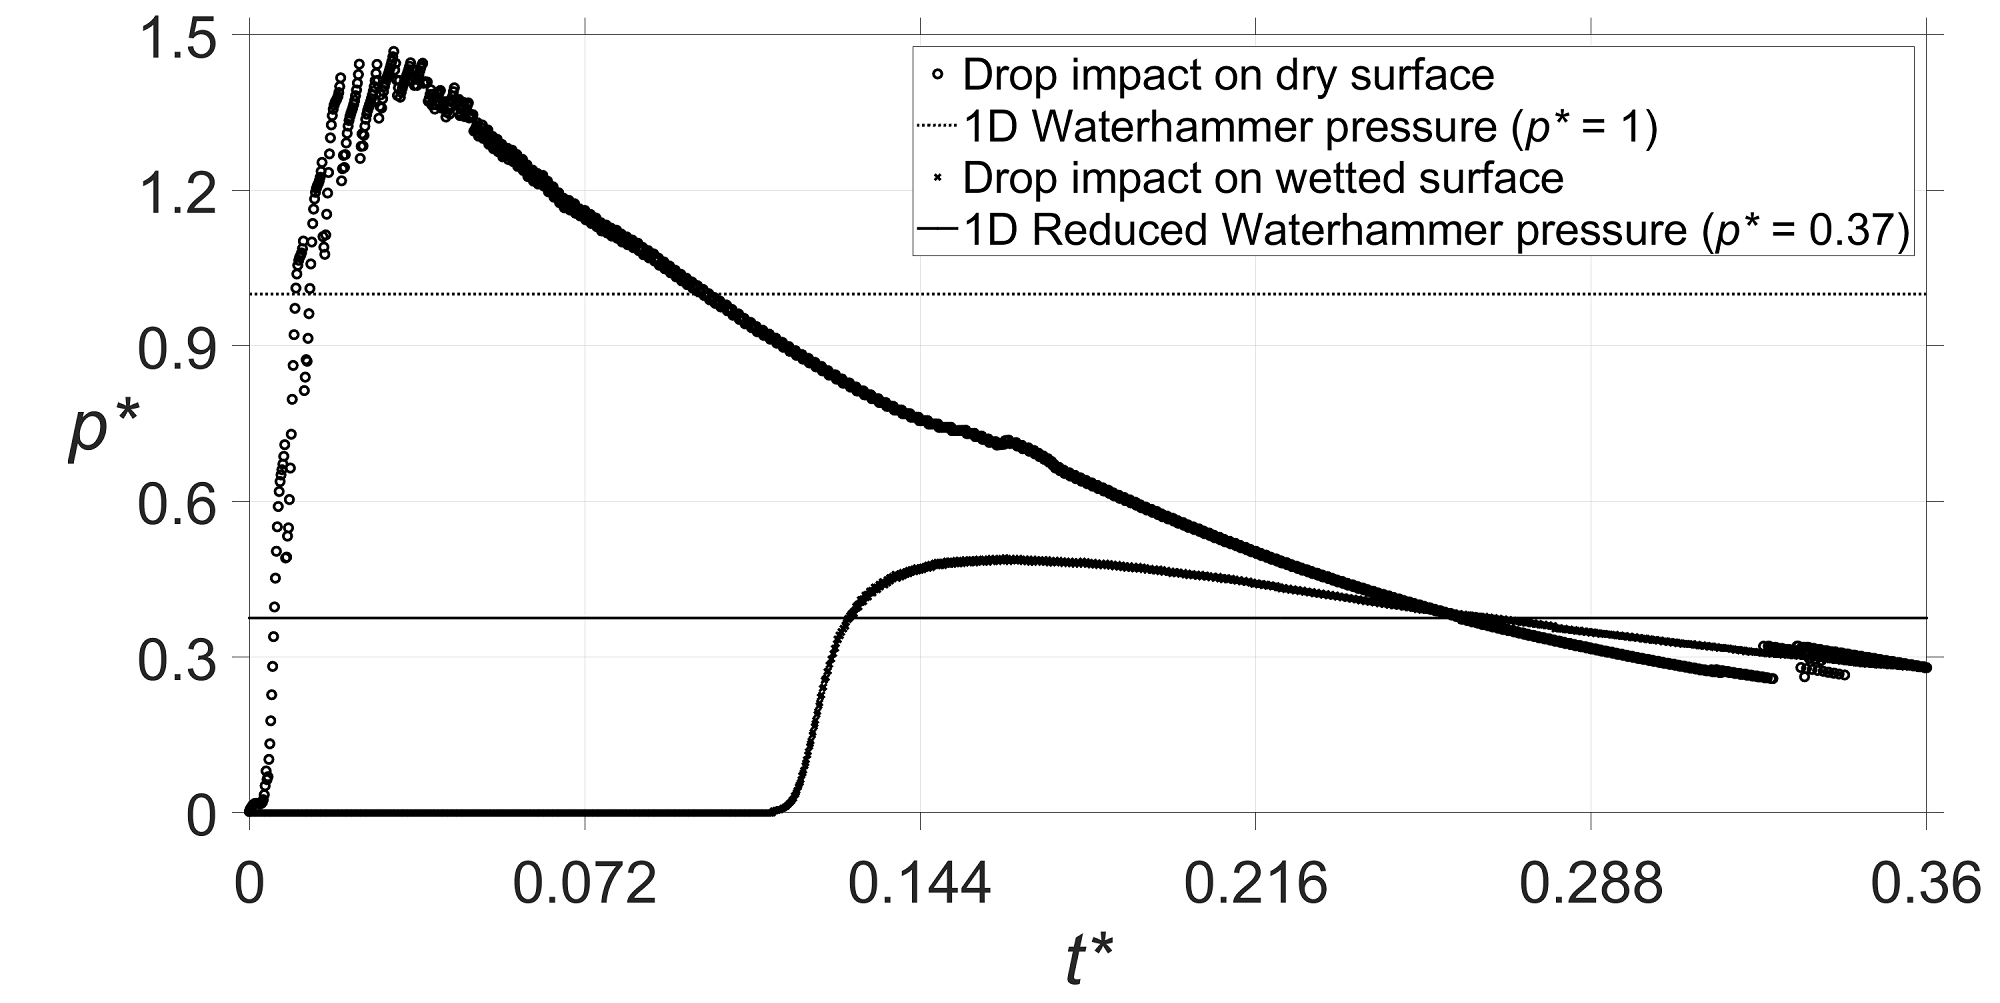
As it can be seen in figure 10, the maximum magnitude of average pressure is 1.47 times the waterhammer pressure, although it locally reaches 2.52 times that value. In addition, the average pressure is above the waterhammer pressure from t* = 0.01 to 0.1 and is below that value before and after this period for the dry surface. On the other hand, the average pressure remains close to the reduced waterhammer pressure of 0.37 during impact on the liquid film and its maximum magnitude is equal to half of the waterhammer pressure on a dry surface, which is slightly lower than the maximum non-dimensional pressure of 0.63 observed locally, as shown in figure 8 (b). As mentioned previously, the liquid film partially absorbs the impact inertia, therefore, lowers the generated pressure. It is worth noting that the waterhammer pressure is of great importance for liquid impingement erosion problems since its magnitude is utilized to predict the solid failure in practical fatigue analyses. Therefore, approximating the droplet impact by the one-dimensional waterhammer pressure may lead to serious underestimation of the solid stresses, which in return, results in an overestimation of the material’s lifetime.
4. Conclusions
In summary, the impact of a 500-µm water droplet impinged at a speed of 500 m/s onto a dry rigid substrate and a 100-µm water film was modeled utilizing a compressible VOF solver. The development of the compressed region and its growth inside the liquid region as the high-pressure front penetrates into the liquid droplet has been shown. The variation of speed of sound in water due to the increase in pressure and its effect on the compressed region was compared for both impacts on dry surface and liquid film. The high-pressure front, which separates the undisturbed region from compressed region in the liquid, travels at the speed of sound in undisturbed liquid for the case of impact on a dry surface, however, its propagation speed is reduced by 11.6% if a liquid film with a thickness of 100 µm is present on the surface prior to the impact. A very strong tangential flow is formed at the droplet periphery when it splashes on the solid. The escaping air and the lateral liquid jet reach velocities of 5 and 3.75 times the impact speed, respectively. In addition, it is highly likely that liquid water reaches its vapor state at the droplet periphery due to the high temperature that was observed at almost atmospheric pressure. As a continuation of the present work, the phase change model can be added to the solver to study the cavitation in more details.
When a liquid droplet with the same size and speed is impinged on a thin liquid film, the formation of the lateral jet is delayed due to the damping effect and the stagnation region is not developed until the compression waves reach the solid surface, at which time, a secondary high-pressure front appears in the liquid and it travels upward 24% faster compared to the dry surface, since the speed of sound is increased in the compressed region. The secondary pressure front is eventually neutralized by the newly emitted compression waves from the impacting droplet. Furthermore, the maximum generated pressure on the solid is reduced significantly, i.e., by four times, when the liquid film is present on the surface, as it partially absorbs the impact force. It was also demonstrated that the location of peak pressure moves from the droplet axis toward its edge very early after the droplet touches down on the surface. Finally, the magnitude and duration of average pressure above the waterhammer pressure (up to 50% higher in case of impact on dry surface) should be taken into account when carrying out the fatigue analysis of the material in order to achieve a more realistic estimation of the lifetime. A parametric study for a wide range of impingement scenarios has been performed in order to develop a correlation between maximum impact pressure, impingement velocity, droplet size and liquid film height, that can be used in practical liquid impingement erosion analysis, and the obtained results and equations will be published in the near future.
Acknowledgments
This work was sponsored by Concordia University, Consortium de Recherche et d'Innovation en Aérospatiale au Québec (CRIAQ), Natural Sciences and Engineering Research Council of Canada (NSERC), Nano-Quebec, Hydro Quebec and Siemens Canada. Computations were made on the supercomputer "Mammouth-Mp2b" from "uSherbrooke", managed by Calcul Québec and Compute Canada. The operation of this supercomputer is funded by the Canada Foundation for Innovation (CFI), the ministère de l'Économie, de la science et de l'innovation du Québec (MESI) and the Fonds de recherche du Québec - Nature et technologies (FRQ-NT).
References
[1] A. Worthington, "On the forms assumed by drops of liquids falling vertically on a horizontal plate," in Proceedings of the Royal Society of London, 1876.
[2] T. von Kármán, "The impact on seaplane floats during landing.," National Advisory Committee on Aeronautics, Washington, DC., 1929.
[3] A. A. Korobkin, "Second-order Wagner theory of wave impact," Journal of Engineering Mathematics, vol. 58, p. 121–139, 2007. View Article
[4] A. A. Korobkin and V. V. Pukhnachov, "Initial Stage of Water Impact," Annual Review of Fluid Mechanics, vol. 20, pp. 159-185 , 1988. View Article
[5] A. A. Korobkin, "Asymptotic theory of liquid–solid impact," Philosophical Transactions of the Royal Society of London. Series A: Mathematical, Physical and Engineering Sciences, vol. 355, no. 1724, pp. 507-522, 1997. View Article
[6] A. Korobkin and A. Iafrati, "Numerical study of jet flow generated by impact on weakly compressible liquid," Physics of Fluids, vol. 18, no. 3, p. 032108, 2006. View Article
[7] J. Fukai, Y. Shiiba, T. Yamamoto, O. Miyatake and D. Pouli, "Wetting effects on the spreading of a liquid droplet colliding with a flat surface: experiment and modeling," Physics of Fluids, vol. 7, no. 2, pp. 236-247, 1995. View Article
[8] Chandra S. and C. T. Avedisian, "On the Collision of a Droplet with a Solid Surface," Proceedigs of the Royal Society, vol. 432, no. 1884, 1991. View Article
[9] M. Pasandideh-Fard, . Y. M. Qiao, S. Chandra and J. Mostaghimi, "Capillary effects during droplet impact on a solid surface," Physics of Fluids, vol. 8, no. 3, 1996. View Article
[10] I. V. Roisman, R. Rioboo and C. Tropea, "Normal impact of a liquid drop on a dry surface: model for spreading and receding," Proceedings of the Royal Society, vol. 458, no. 2022, 2002. View Article
[11] V. Mehdi-Nejad, J. Mostaghimi and S. Chandra, "Air bubble entrapment under an impacting droplet," Physics of fluids, vol. 15, no. 1, pp. 173-183, 2003. View Article
[12] P. Hicks and R. Purvis, "Liquid–solid impacts with compressible gas cushioning," Journal of Fluid Mechanics, vol. 735, pp. 120-149, 2013. View Article
[13] N. Z. Mehdizadeh, S. Chandra and J. Mostaghimi, "Formation of fingers around the edges of a drop hitting a metal plate with high velocity," Journal of Fluid Mechanics, vol. 510, pp. 353-373, 2004. View Article
[14] T. D. Blake and J. De Conick, "The influence of solid–liquid interactions on dynamic wetting," Advances in Colloid and Interface Science, vol. 96, no. 1-3, pp. 21-36, 200. View Article
[15] M. Pegg, R. Purvis and A. Korobbkin, "Droplet impact onto an elastic plate: a new mechanism for splashing," Journal of Fluid Mechanics, vol. 839, pp. 561-593, 2018. View Article
[16] M. Marzbali, "Numerical Analysis of High-speed Droplet Impingement on Elastic and Rigid Substrates," Concordia University, 2017.
[17] M. Marzbali, A. Dolatabadi and P. Jedrzejowski, "Fluid-Solid Interaction Modeling of Compressible Droplet Impact onto Elastic Substrates," in 21st AIAA Computational Fluid Dynamics Conference, San Diego, 2013.
[18] M. Marzbali and A. Dolatabadi, "Modeling of Liquid Droplet Impingement onto Ti-6Al-4V Substrate," in The 5th World Congress on Mechanical, Chemical, and Material Engineering, Lisbon, 2019.
[19] P. Jedrzejowski, W. K. Omielan, A. Dolatabadi, M. Marzbali and M. Tembely, "Method and system for reducing liquid droplet impact damage by superhydrophobic surfaces". World Intellectual Property Organization (WIPO) Patent WO/2017/222516, 2017.
[20] F. J. Heymann, "High-speed impact between a liquid drop and a solid surface," Journal of Applied Physics, vol. 40, pp. 5113-22, 1969. View Article
[21] J. P. Dear and J. E. Field, "High-speed photography of surface geometry effects in liquid/solid impact," Journal of Applied Physics, vol. 63, pp. 1015-21, 1988. View Article
[22] J. E. Field, J. P. Dear and J. E. Ogren, "The Effects of Target Compliance on Liquid Drop Impact," Journal of Applied Physics, vol. 65, pp. 533-40, 1989. View Article
[23] M. C. Rochester and J. H. Brunton, "Erosion by Liquid and Solid Impact," in International Conference on Erosion by Liquid and Solid Impact (5th), Cambridge, 1979.
[24] M. B. Lesser, "Analytic Solutions of Liquid-Drop Impact Problems," Proceedings of the Royal Society A, vol. 377, no. 1770, pp. 289-308, 1981. View Article
[25] M. B. Lesser and J. E. Field, "The Impact of Compressible Liquids," Annual Review of Fluid Mechanics, vol. 15, pp. 97-122, 1983. View Article
[26] K. Haller, "High-Velocity Impact of a Liquid Droplet on a Rigid Surface: The Effect of Liquid Compressibility," Swiss Federal Institure of Technology, Zurich, 1972.
[27] M. Marzbali and A. Dolatabadi, "High-speed Droplet Impingement in Compressible Regime," in Proceedings of the 5th World Congress on Mechanical, Chemical, and Material Engineering, Lisbon, 2019. View Article
[28] M. Marzbali and A. Dolatabadi, "2D Axisymmetric Modelling of Single Liquid Droplet Impingement at High Speeds on Thin Liquid Films in Compressible Regime," in Proceedings of the 6th World Congress on Mechanical, Chemical, and Material Engineering, Prague, 2020. View Article
[29] P. G. Tait, "Report on some of the physical properties of fresh water and sea water," Physical Chemistry, vol. 2, p. 1–17, 1888.
[30] J. U. Brackbill, D. B. Kothe and C. Zemach, "A continuum method for modelling surface tension," vol. 100, no. 2, p. 335−354, 1992. View Article
[31] C. Hirt and B. Nichols , "Volume of Fluid (VOF) Method for the Dynamics of Free Boundaries," vol. 39, no. 1, pp. 201-225, 1981. View Article
[32] D. L. Youngs, "Time-Dependent Multi-Material Flow with Large Fluid Distortion," Numerical Methods for Fluid Dynamics, 1982.
[33] H. Sasaki, N. Ochiai and Y. Iga, "Numerical Analysis of Damping Effect of Liquid Film on Material in High Speed Liquid Droplet Impingement," International Journal of Fluid Machinery and Systems, vol. 9, no. 1, pp. 57-65, 2016.View Article