Journal of Fluid Flow, Heat and Mass Transfer (JFFHMT)
ISSN: 2368-6111

Volume 7 - Year 2020 - Pages 66-72
DOI: 10.11159/jffhmt.2020.007
A Comparative Study of Diffusion Coefficients from Convective and IR Drying of Woodchip
Pryce M.J.*, Cheneler D., Martin A. and Aiouache F.*
*Authors for correspondence
Department of Engineering
Lancaster University,
Bailrigg, Lancaster
United Kingdom
Email: f.aiouache@lancaster.ac.uk, m.pryce1@lancaster.ac.uk
Abstract - Convective and infared (IR) Halogen Drying
processes are used in the woodchip biomass industry to test the
moisture content of woodchip. Woodchip drying, though energy
intensive, is necessary to increase the calorific content of
woodchip, in turn increasing combustibility. The bulk process
within the production of woodchip uses convective drying with
agitation. Analysis of the diffusion in wood can be used to
estimate the time to dry lumber to a specified moisture content
value. Relationships between the effect of temperature and
moisture content allow more accurate predictions and
operational evaluations of driers.
The aim of this study
was to investigate constant heat source convective and IR drying by comparing
the drying curves when batch drying a sample of woodchip biomass whilst
controlling the heat source temperature at 328K, 338K, 348K and 358K. This was
achieved through comparison of pre-exponential diffusion coefficients and
activation energy, determining the temperature dependency of these terms in
convective and IR drying of wetted wood. Lower temperatures increased drying time
for both convective and IR drying, with convective drying taking up to 5 times
longer than IR. The pre-exponential diffusion coefficient and activation
energy found for IR drying were ![]() m2.s-1 and
m2.s-1 and ![]() J.mol-1. The
convective drying pre-exponential diffusion coefficient and activation energy
calculated was
J.mol-1. The
convective drying pre-exponential diffusion coefficient and activation energy
calculated was ![]() m2.s-1 and
m2.s-1 and ![]() J.mol-1
respectively.
J.mol-1
respectively.
Keywords: Drying, Convective, Infrared, Activation Energy, Diffusion.
© Copyright 2020 Authors - This is an Open Access article published under the Creative Commons Attribution License terms Creative Commons Attribution License terms. Unrestricted use, distribution, and reproduction in any medium are permitted, provided the original work is properly cited.
Date Received: 2020-09-15
Date Accepted: 2020-09-23
Date Published: 2020-11-16
1. Introduction
Woodchip production consists of processing wood through three main stages (i) sourcing timber, (ii) chipping of logs, and (iii) drying the chipped wood. With the calorific (MJ/kg) value of woodchip being linearly proportional to its moisture content [1], drying wet chip is necessary to achieve greater combustion per weight of biomass. Biomass boilers are therefore rated to a defined moisture content of wood feed. Other benefits of drying include quality, characterisation of wood allowing comparison between various origins, reduced energy consumption for transport and storage, driven by a reduction in mass and fungal build up. On the other hand, the fuel sourced from woodchip is generally in higher demand over the winter period when the supply faces a higher moisture content due to both the colder and wetter weather. Therefore, in winter months drying is required to not only improve the fuels quality but also preserve and keep a consistent supply.
Both convective and infrared (IR) drying are used to find the moisture content of woodchip, though British Standards recommend convective drying [2]. Convective drying is in general slower than IR drying as energy, in the form of heat, is first transferred to the air and then the woodchip, whereas in IR, drying energy is transferred directly to the woodchip and water via radiative heat transfer. The rate of heat transfer by convection is commonly described using Fourier’s law of conduction and Newton’s Law of Cooling, comparatively IR heat transfer is described using the Stefan-Boltzmann’s law of radiation (Equations 1, 2 and 3 respectfully)[3].


where q is heat transfer (W.m-2),
h is the convective heat transfer coefficient (W.m-3K-1),
A is the heat transfer area (m2), k is a conductive heat transfer
coefficient (W.m-1K-1), ![]() is surface
emissivity,
is surface
emissivity, ![]() is the
Stefan-Boltzmann constant (W.m-2K-4), Ts
is
the solid surface temperature (K) and T∞ is the ambient temperature (K).
is the
Stefan-Boltzmann constant (W.m-2K-4), Ts
is
the solid surface temperature (K) and T∞ is the ambient temperature (K).
These show the impact of temperature on heat transfer. For IR drying the effect of temperature increase is amplified by the fourth power, compared to that of convective drying for which the equation of heat transfer contains no exponent. The driving force for heat transfer is the temperature gradient along the woodchip and between the atmosphere and the woodchip.
2. Mathematical Models
The falling rate period of drying shows the behaviour of moisture diffusing through material. After an initial evaporation of the surface moisture, the rate of mass loss decreases as moisture has to diffuse from the centre of the material to the surface of the solid, obeying Fick’s law of mass transfer;

Where
the mass flux Ji is defined by the diffusion coefficient, D, and the
concentration gradient, ![]() . Transforming the second Fick’s law [4], by considering the
rate of accumulation of a substrate, Ci, in this case water vapour
in a control volume, the resulting relationship is;
. Transforming the second Fick’s law [4], by considering the
rate of accumulation of a substrate, Ci, in this case water vapour
in a control volume, the resulting relationship is;

Expressing the ratio of moisture, MR, within the woodchip at time t from the current Mi, initial M0 and final masses Me;

Using the assumptions of:
- Symmetric uniform distribution of moisture within the initial sample.
- Symmetric mass transfer with respect to the centre of the solid.
- Constant diffusion coefficient.
- Negligible shrinkage
- Instantaneous evaporation at the surface (i.e. the concentration on the face from which the diffusing substance emerges is maintained at effectively zero).
- Steady state conditions for the finite interval of time is defined after IR drying at 105℃ [5].
The drying rate, WD, is defined as the amount of moisture removed from the dried material per unit time and unit surface area [6];

Where X is the moisture content on a dry basis, Me is the equilibrium dry mass, A is area and t is time in seconds. For a constant surface area, A, and mass of dried solid, Me, the rate, WD, can therefore be determined through differentiation of the moisture ratio over time.
To define the moisture ratio diffusion coefficients and activation energy can be calculated from singular pieces of chip of known thickness L.
Using the following model by Crank [7];
Using time, t (s), the effective diffusion
coefficient, ![]() (m.s-1) and thickness, L(m).
(m.s-1) and thickness, L(m).
For long drying times;
Temperature Dependence
The impact of temperature on effective diffusivity can be estimated using the Arrhenius profile of effective diffusivity, Equation 11.

Within
these equations the pre-exponential diffusion coefficient, ![]() (m2.s-1) and activation
energy,
(m2.s-1) and activation
energy,![]() (J.mol-1) are calculated constants,
while temperature, T(K), and the ideal gas constant, R(8.314J.K-1.mol-1)
are predefined and time is a dependent measured variable.
(J.mol-1) are calculated constants,
while temperature, T(K), and the ideal gas constant, R(8.314J.K-1.mol-1)
are predefined and time is a dependent measured variable.
3. Materials and Method
The woodchip was supplied by Bowland Bioenergy Ltd. This wood had been externally stored as logs and chipped, with no prior drying other than natural weathering. A single chip of softwood was used which was then soaked in deionised water for 12 hours resulting in a wetted chip weighing ≈3g prior to the drying procedure.
3. 1. Drying Procedure
Convective Drying
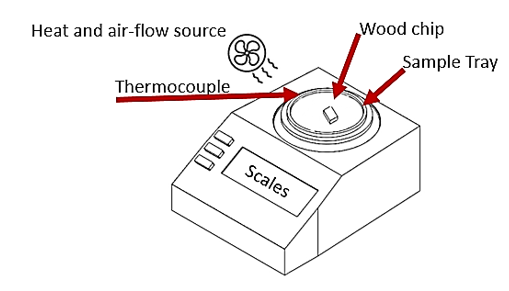
Adjacent
to a set of scales, with an accuracy of ![]() 0.0005 g, a variable temperature heat gun was
mounted (shown in Figure 1)which passes
air at 1.6m/s over a sample tray. The weight on this tray was recorded every 5
seconds, with the heat gun causing an initial constant fluctuation in the
weight and variations around this caused by changes in the air flow. The
temperature of the air was measured 4cm from the outlet of the heat gun and 5cm
from the centre of the 10cm ø sample tray. This temperature stayed at the set
temperature ±5℃ and has an on/off controller set to turn off +6℃
from the set point which turns the heat source off until the temperature drops
below this value. The ambient temperature of the room was 22℃ at the
start of every experiment and the equipment was uncovered, increasing this
ambient temperature close to the sample over time.
0.0005 g, a variable temperature heat gun was
mounted (shown in Figure 1)which passes
air at 1.6m/s over a sample tray. The weight on this tray was recorded every 5
seconds, with the heat gun causing an initial constant fluctuation in the
weight and variations around this caused by changes in the air flow. The
temperature of the air was measured 4cm from the outlet of the heat gun and 5cm
from the centre of the 10cm ø sample tray. This temperature stayed at the set
temperature ±5℃ and has an on/off controller set to turn off +6℃
from the set point which turns the heat source off until the temperature drops
below this value. The ambient temperature of the room was 22℃ at the
start of every experiment and the equipment was uncovered, increasing this
ambient temperature close to the sample over time.
IR Drying
The
infrared (IR) halogen drier contains scales with a weight accuracy of ![]() 0.0005 g, and was programmed to stop when a
change of 0.001g per 99 seconds was reached and the total weight recorded every
5 seconds. The moisture balance was setup to have a target temperature of 145%
of the set temperature for the first instance and when the set temperature is
reached the temperature is maintained. This setup resulted in some overshoots
in temperature control by a few degrees in the first minute and then remained
at the set drying temperature
0.0005 g, and was programmed to stop when a
change of 0.001g per 99 seconds was reached and the total weight recorded every
5 seconds. The moisture balance was setup to have a target temperature of 145%
of the set temperature for the first instance and when the set temperature is
reached the temperature is maintained. This setup resulted in some overshoots
in temperature control by a few degrees in the first minute and then remained
at the set drying temperature ![]() 1℃, with tighter temperature control than
the convective drying. The ambient temperature was found to have no discernible
effect on the results of IR drying due to the enclosed chamber of the dryer.
The halogen heater had a heat duty of 400W.
1℃, with tighter temperature control than
the convective drying. The ambient temperature was found to have no discernible
effect on the results of IR drying due to the enclosed chamber of the dryer.
The halogen heater had a heat duty of 400W.
For Both Experiments
A
single woodchip weighing ~3g was used for investigating both convective and IR
drying. This woodchip has known dimensions of 6.13![]() 29.87
29.87![]() 25.61mm3. The drying temperatures
used were 328K,
338K, 348K and 358K.
25.61mm3. The drying temperatures
used were 328K,
338K, 348K and 358K.
In both cases mass data were logged using a bi-directional RS-232 cable connected to a laptop with appropriate data logging software. The mass over time, Mt, was recorded until the mass over time levelled out for 30minutes or until the IR drier automatically stopped and after this original session stopped saved to a file. The first mass recorded in this session is the starting mass M0.
To obtain the equilibrium value, Me, the IR drying apparatus was used with the temperature set to 105℃ and weight recorded every 5 seconds, and the balance was again programmed to stop when a change of 0.001g per 99 seconds was reached. The final mass value from this session was Me relating to the previous saved session.
Once
Me was obtained the woodchip was then soaked again in deionised
water, until the mass reached M0![]() g after draining, which took up to 24 hours. The drying
procedure for the next set temperature was then repeated to obtain Mt
and Me data for each experimental setup.
g after draining, which took up to 24 hours. The drying
procedure for the next set temperature was then repeated to obtain Mt
and Me data for each experimental setup.
4. Results Analysis
A fit to Equation 15 to experimental results for the moisture ratio has been evaluated using MATLAB and Non-linear Least Squares regression analysis. To identify the goodness of the fit commonly used statistical criteria were used; these include the sum of the square estimate errors (SSE), Equation 12, residual squared (R2), Equation 13, and root mean squared error (RMSE), Equation 14.
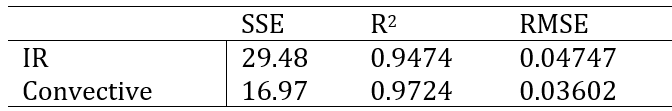
These results show the goodness of fit to the models within Table 1. The closer to 1 R2 is and the smaller the SSE and RMSE values are, the better the goodness of fit [8].
5. Results And Discussion
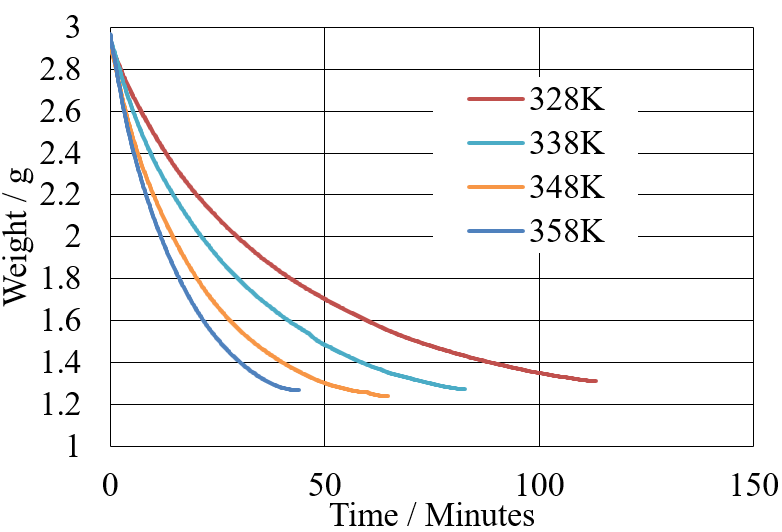
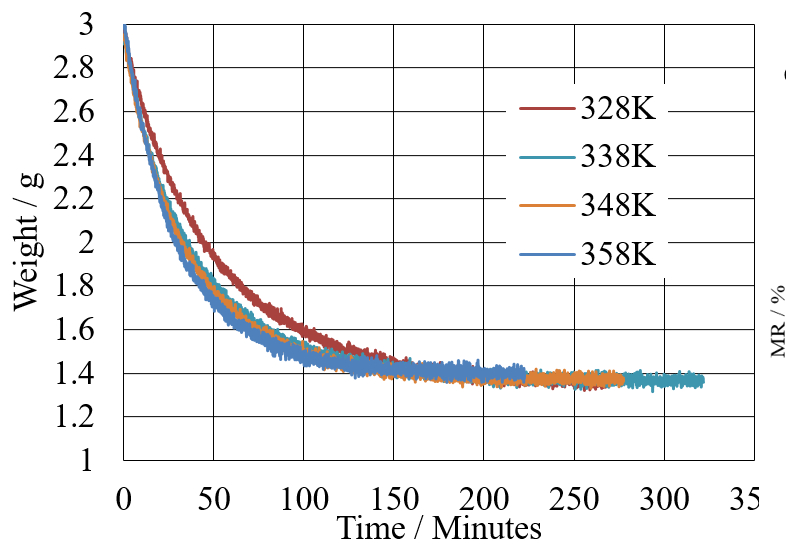
The measured mass vs time data for IR and convective drying shows that convective drying takes longer than IR at the same temperature shown in Figure 2 and Figure 3. The drying time was up to 5 times longer for Convective drying than IR drying. IR drying also resulted in a lower final mass.
The thickness of the woodchip, L in Equation 10, was measured as 0.00613 m. Equations 10 and 11 can therefore be combined making Equation 15, which can be fitted to the data using MATLAB Curve Fitting Tool.
It is noticeable that rate, or steepness of the curves in Figure 2 and Figure 3 increases with temperature. Therefore the effective diffusivity term will also increase with temperature, as suggested by the Arrhenius equation (Equation 11). From Equation 15 a lower activation energy and pre-exponential diffusion coefficient decrease the drying time, the wider distribution of the IR drying curves in Figure 2 in comparison to Figure 3 suggests a greater activation energy, and the faster drying time suggests a larger pre-exponential diffusion coefficient.
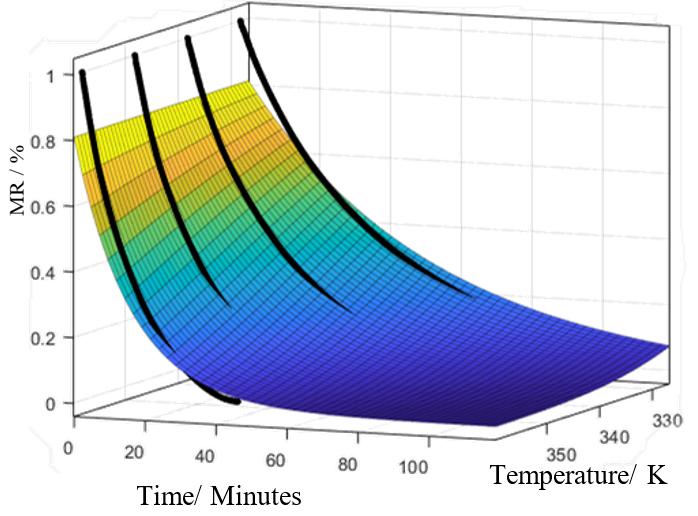
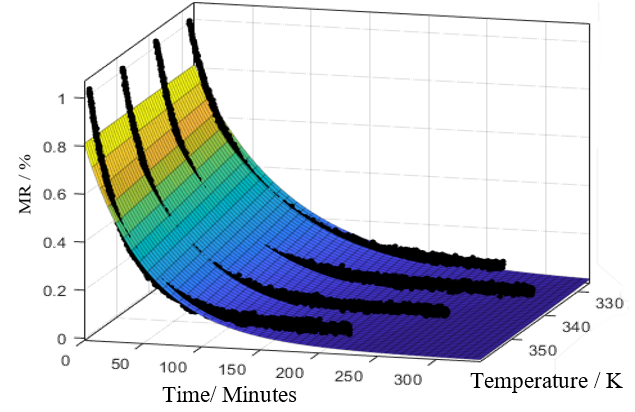
Table 1. Pre-Exponential Diffusion Coefficient and Activation Energy Results (with 95% confidence bounds).
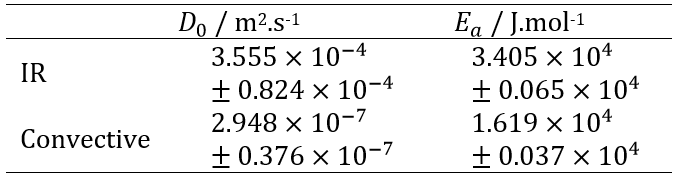
The activation energy and pre-exponential
diffusion coefficient for IR drying, from Table 1, are greater
than the convective results. The order of magnitude of pre-exponential
diffusion coefficient was much greater for IR drying, whereas for the
activation energy the orders of magnitude are the same for both IR and
convective drying. Previous experiments have found that for Casuarina
Equisetifolia wood the pre-exponential diffusion coefficient, ![]() , and activation energy,
, and activation energy, ![]() , were determined as 2.15×10⁻² m2
.s-1and 4.527
, were determined as 2.15×10⁻² m2
.s-1and 4.527![]() J.mol-1 respectively[9]. The IR drying results
obtained in this analysis are of the same order of magnitude and a similar
value to those reported in [8] . The most commonly reported data relating to
Equation 15 are for foodstuffs, the general range reported for the
pre-exponential diffusion coefficients of foodstuffs are generally within 10−11–10−6
m2 s−1 [10]
which the convective pre-exponential diffusion coefficient for convective
drying is within. For food materials, activation energy is 1.27 to 11
J.mol-1 respectively[9]. The IR drying results
obtained in this analysis are of the same order of magnitude and a similar
value to those reported in [8] . The most commonly reported data relating to
Equation 15 are for foodstuffs, the general range reported for the
pre-exponential diffusion coefficients of foodstuffs are generally within 10−11–10−6
m2 s−1 [10]
which the convective pre-exponential diffusion coefficient for convective
drying is within. For food materials, activation energy is 1.27 to 11![]() J.mol-1[11] which both results are within.
The diffusivity value found for IR drying of woodchip is outside of this range,
but between this range for fruit and the results for drying of Casuarina
Equisetifolia wood.
J.mol-1[11] which both results are within.
The diffusivity value found for IR drying of woodchip is outside of this range,
but between this range for fruit and the results for drying of Casuarina
Equisetifolia wood.
Something
to note from Equation 10 is that, though this model is widely used [12,13,14], the equation itself will never
be an exact fit to moisture ratio (MR) based on the definition of MR. As MR is
the percentage moisture in the sample based on the initial moisture content.
From time zero the value of MR is 1, however, Equation 10 will always be ![]() when t is zero and after time zero MR will be
below this value, shown by the offset of the curve fits in Figure 5 and Figure 4. This is
further supported by the evaluation of goodness of fit shown in Table 2 with a large
SSE value and an R2 value below 0.95, below the R2 values
found from previous fits of woodchip drying to other experimental models[15,16] with multiple terms. The model
used was formed from the first term of Equation 9, a different method to fit
this equation would be to fit the experimental data to multiple terms of the
Fourier series equations [17].
when t is zero and after time zero MR will be
below this value, shown by the offset of the curve fits in Figure 5 and Figure 4. This is
further supported by the evaluation of goodness of fit shown in Table 2 with a large
SSE value and an R2 value below 0.95, below the R2 values
found from previous fits of woodchip drying to other experimental models[15,16] with multiple terms. The model
used was formed from the first term of Equation 9, a different method to fit
this equation would be to fit the experimental data to multiple terms of the
Fourier series equations [17].
Table 2. Statistical Analysis of Goodness of Fit to Equation 15
Equation 15 is exponential approaching zero, as the equilibrium mass after secondary heating (used as the dry mass) was less than that at the end of the measured mass over time period, shown in Table 3, the final plotted results for MR are offset from zero. This difference in mass from the plotted period and IR drying at 105℃ is due to the activity of water; at lower temperatures and moisture content water activity is lower[18], reducing the total moisture loss over the drying period.
Table 3. Experimental Initial Mass, Final Mass During Experiments, and Equilibrium Mass.
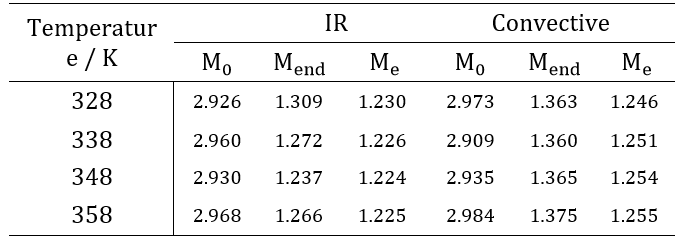
Table 3 shows the starting masses for all experiments were within a range of 0.1g, for IR drying the weights at the end of the temperature-controlled experiment varied by 0.5g, for convective the lowest measured weight was taken which differs by 0.015g. The equilibrium weights for all experiments were within 0.03g of each other showing a good repeatability.
6. Conclusions
This study showed the drying behaviour of a single woodchip, exhibiting falling rate characteristics and suggesting that the drying process was diffusively dominant. The temperature dependency of the drying process in the model used was determined through the Arrhenius equation.
Key Findings
- Convective drying takes longer than IR drying
- The pre-exponential diffusion coefficient and activation energy found for IR drying using Equation 10 proposed by Crank was found to be 3.555 × 10⁻⁴ ± 0.824 × 10⁻⁴ m2.s-1 and 3.405 × 10⁴ ± 0.065 × 10⁴ J.mol-1, for convective drying 2.948 × 10⁻⁷ ± 0.376 × 10⁻⁷ m2.s-1 and 1.619 × 10⁴ ± 0.037 × 10⁴ J.mol-1 respectively
- Crank’s equation could not effectively represent MR data due to the equation for MR using the initial mass as an 100% reference mass.
- IR drying resulted in a higher mass loss over the drying period than convective drying.
Highlights and Limitations
In the convective drying experimental test fluctuations in weight from airflow patterns made it difficult to produce live weight measurements of samples as noise within results through this method increased the measurement error. The ambient air temperature increased over time with convective drying, making it difficult to alter the sample temperature rather than the heat source temperature, the heat source temperature did not equate to the temperature of the air that reached the sample and so temperature control in IR drying was more effective due to the contained space.
7. Recommendations
The
Crank model used contains a lumped diffusion term governing moisture transport,
however, water moves through woodchip via diffusive moisture transport and
capillary moisture transport. Thus, to properly account for this physical
phenomena, separate terms for diffusive and capillary transport of liquid water
and water vapour could be used to further describe the movement of moisture. For
example the diffusion through a porous media ![]() can be split into a liquid and vapour term, as shown
in Equation 16 proposed by Millington and Quirk in 1961[19].
can be split into a liquid and vapour term, as shown
in Equation 16 proposed by Millington and Quirk in 1961[19].
Where ![]() is vapour diffusion,
is vapour diffusion, ![]() is liquid diffusion,
is liquid diffusion, ![]() and
and ![]() are vapour and liquid saturation,
are vapour and liquid saturation,![]() is the porosity and KH is henrys
constant.
is the porosity and KH is henrys
constant.
A different method to fit data to the Crank model could be to use multiple terms of the Fourier series expansion of Equation 9[20] (note the Crank model used was formed from only the first term of Equation 9).
The moisture content also depends on several other factors for instance, it can be affected by airflow, temperature, pressure, relative humidity, and structure on diffusivity. The full effects of drying type and conditions on moisture loss over time can be found using computational and experimental investigation. This analyses could consider effects such as; responses to high temperature drying, low temperature drying , convective drying, IR drying, microwave drying or freeze drying using different models and situations.
Acknowledgements
This work is supported by the Centre for Global Eco Innovation and the ERDF. The woodchip used is supplied by Bowland Bioenergy Ltd with which this work is presented in partnership. Special thanks to industry advisors, Anne Seed and Mike Ingoldby, and for laboratory use, Dr John Crosse and Jessica Fisher.
References
[1]] Gebreegziabher, T., A. Oyedun, and D. Hui, Optimum biomass drying for combustion – A modeling approach. Energy, 2013. 53: p. 67–73. View Article
[2] British Standards Institution (2019) BS ISO 13061-1. Physical and mechanical properties of wood. Test methods for small clear specimen. Part 1. Determination of moisture content for physical and mechanical tests. Available at: bsol-bsigroup-com
[3] Radiation Heat Transfer: A Statistical Approach, J. Robert Mahan, John Wiley & Sons, 2002
[4] Crank, J. and E.P.J. Crank, The Mathematics of Diffusion. 1979: Clarendon Press. pp.50
[5] British Standards Institution (2017) BS EN ISO 18134-2:2017: Solid biofuels. Determination of moisture content. Oven dry method. Total moisture. Simplified method. Available at: bsol-bsigroup-com
[6] Gavhane, K., Unit Operations-II. 2014: Nirali Prakashan.
[7] Crank, J. and E.P.J. Crank, The Mathematics of Diffusion. 1979: Clarendon Press.
[8] Reddy, T.A., Applied Data Analysis and Modeling for Energy Engineers and Scientists. 2011: Springer US. View Article
[9] Sridhar, D., Madhu, G. M. “Drying Kinetics and Mathematical Modeling of Casuarina Equisetifolia Wood Chips at Various Temperatures”, Periodica Polytechnica Chemical Engineering, 59(4), pp. 288-295, 2015.View Article
[10] Olanipekun, B., Tunde‐Akintunde, T., Oyelade, O., Adebisi, M. and Adenaya, T. (2015), Modeling of Pineapple Drying. Journal of Food Processing and Preservation, 39: pp. 1431-1441. View Article
[11] Mortaza Aghbashlo, Mohammad H. kianmehr, Hadi Samimi-Akhijahani, Influence of drying conditions on the effective moisture diffusivity, energy of activation and energy consumption during the thin-layer drying of berberis fruit (Berberidaceae), Energy Conversion and Management, Volume 49, Issue 10, 2008, Pages 2865-2871. View Article
[12]Dengyu Chen, Yan Zheng, Xifeng Zhu, Determination of effective moisture diffusivity and drying kinetics for poplar sawdust by thermogravimetric analysis under isothermal condition, Bioresource Technology, Volume 107, 2012, Pages 451-455 View Article
[13]T.M. Afzal, T. Abe, Diffusion in potato during far infrared radiation drying, Journal of Food Engineering, Volume 37, Issue 4, 1998, Pages 353-365 View Article
[14] A. Nieto, D. Salvatori, M.A. Castro, S.M. Alzamora, Air drying behaviour of apples as affected by Blanching and glucose impregnation Journal of Food Engineering, 36 (1998), pp. 63-79 View Article
[15] Pryce, M, Cheneler, D, Martin, A & Aiouache, F 2020, Mathematical Model Analysis for Mass and Rates of Woodchip IR Drying. Proceedings of the 6th World Congresson Mechanical, Chemical, and Material Engineering. Avestia , 2020. HTFF 177 ( Proceedings of the 6th World Congresson Mechanical, Chemical, and Material Engineering).
[16] Górnicki, K., Kaleta, A., Bryś, A., & Winiczenko, R. (2016). Thin-layer drying of sawdust mixture, Polish Journal of Chemical Technology, 18(4), pp. 65-70. View Article
[17] S. Simal, F. Bauza de Mirabo, E. Deya, C. Rossello, A simple model to predict mass transfers in dehydration by osmosis, Zeitschrift fur Lebensmittel-Untersuchung und-Forschung A—Food Research and Technology, 204 (1997), pp. 210-214 View Article
[18] A.K. Datta, Porous media approaches to studying simultaneous heat and mass transfer in food processes. II: Property data and representative results, Journal of Food Engineering, Volume 80, Issue 1, 2007 View Article
[19]Millington, R.J, and Quirk, J.M., Permeability of Porous solids, Trans. Faraday Soc., 1961, pp. 1200- 1207. View Article
[20] S. Simal, F. Bauza de Mirabo, E. Deya, C. Rossello, A simple model to predict mass transfers in dehydration by osmosis, Zeitschrift fur Lebensmittel-Untersuchung und-Forschung A—Food Research and Technology, 204 (1997), pp. 210-214 View Article