Journal of Fluid Flow, Heat and Mass Transfer (JFFHMT)
ISSN: 2368-6111

Volume 7 - Year 2020 - Pages 27-36
DOI: 10.11159/jffhmt.2020.003
A Computational and Experimental Study of Wake of Thin Flexible Wires
Chelakara S. Subramanian1, Harika Gurram2
1,2 Florida Institute of Technology
APSS Department, 150 W. University Boulevard, Melbourne, FL, USA
1subraman@fit.edu (corresponding author), 2hgurram@tacc.utexas.edu
Abstract - This work aims to understand the wake structure affecting the drag coefficient of thin flexible wires in a cross flow at low Reynolds numbers. The experiments and computations are performed on a thin flexible wire, diameter ranging from 0.7mm - 1mm for Reynolds numbers ranging from 260 to 1250. The fluid dynamic mechanism causing the drag reduction in the subcritical range of Reynolds numbers is investigated using pitot static and hot wire anemometer measurements. To compliment the experimental analysis, we performed time resolved Direct Numerical Simulation for the similar flow conditions using the commercial CFD solver code ANSYS Fluent and the mesh generator ICEM-CFD. The drag coefficient shows 20% reduction when compared to the results of a convectional rigid cylinder. Similar reduction was observed in the computations performed. The reduction of drag coefficient can be associated to the transition in the wake due to the presence of instability waves shown in near wake vorticity/velocity contours. We also observe at subcritical Reynolds number the laminar boundary layer separation occurs earlier than the supercritical Reynolds number, resulting in reduced wake width and pressure drag.
Keywords: Drag coefficient of flexible wire; DNS; Wake transition; Hot wire wake survey.
© Copyright 2020 Authors - This is an Open Access article published under the Creative Commons Attribution License terms Creative Commons Attribution License terms. Unrestricted use, distribution, and reproduction in any medium are permitted, provided the original work is properly cited.
Date Received: 2020-02-19
Date Accepted: 2020-03-21
Date Published: 2020-09-07
1. Introduction
Previous studies [1], [2] performed on large rigid cylinders (no flow induced deformation of the cylinder) with diameter in the order of centimetres for a wide range of Reynolds numbers discuss how different regimes of the flow affects the drag coefficient. These results were mostly focused on influence of boundary layer instability and transition around the cylinder which causes drag crisis or drag reduction near the critical Reynolds number.
A numerical study of a steady viscous flow past a circular cylinder with small diameters by Fornberg [5] reported low drag coefficient values for Reynolds numbers range 100 - 300. The earliest wake flow instability study has been by Williamson [6], who observed a dip in the base pressure coefficient of a 2D cylinder for similar range of Reynolds numbers. He attributes this to the wake unsteadiness. Finn [7] used a fine wire suspended as a pendulum in a uniform stream of air flowing at a known rate and measured the wire drag force by the amount of deflection. He also observed around 8% reduction in the drag coefficient at low Reynolds numbers compared with the cylinder literature values. Whereas Newman and Karniadakis [8] have used direct numerical simulations to compare forced cable vibration with flow induced vibration at Reynolds numbers between 100-300. All these studies do not consider the interactions between the boundary layer and wake flow which could explain the mechanism behind the reduction of drag coefficient of small diameter cylinder at low subcritical Reynolds numbers.
The present study is the first one to analyse the wake phenomenon on flexible thin cylinder, whose experimental measurements were rigorously discussed by the current authors [3]. The experiments presented were conducted on flexible wire of diameter in the range of 0.7-1mm for the Reynolds number in the range of 250-1000. The results show that the drag coefficient values are around 20% lower than the laminar flow values for rigid cylinders as previously reported in the literature. This work aims to understand the effect of transitioning wake structure behind thin flexible cylinder and its interaction with the cylinder boundary layer. Here, the flexible cylinder refers to the cylinder material with low Young’s modulus (E) which is constrained on both the ends, allowing slacking and deformation of cylinder due to the force induced by the flow. In the sections below, we discuss the experimental and computational procedures followed by the results of mean, root-mean square (rms) velocities, power spectral analysis and flow structures in the wake causing the drag reduction.
2. Experimental Description
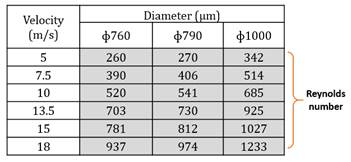
The experiments are conducted in Florida Tech low-speed subsonic wind tunnel facility. The test section cross section is 0.54 m x 0.54 m and, 1.72 m long. Three flexible wires with the diameters 760, 790 and 1000 microns, with corresponding fineness ratio (length(l)/diameter (d)) of 710, 684, 540, respectively, are used. The wire is stretched taut vertically across the 0.54m test section. The freestream speed for the wake survey tests is varied between 5 m/s to 18 m/s. This combination provided the Reynolds number range based on the freestream speed and wire diameter between 260 to 1250, as given in Table 1. For the drag determination by the momentum balance, the mean dynamic pressure in the wire wake are measured with a pressure transducer by traversing a 3 mm diameter semi-hemispherical tip pitot static tube. The pitot static tube wake survey is carried out with a manual traverser, using 0.1 mm step size across the wire in the wake region. For calculating the averages, one hundred samples at a sampling rate of 5 samples per second are used. The wake surveys are performed at 5d and 13d downstream locations from the rear stagnation point of the wire. For the turbulent velocity measurements in the wake, a single 5 mm Platinum plated tungsten hotwire operated by a constant temperature anemometer is used. The wire is calibrated in the potential flow region of the wind tunnel for speeds ranging between 5m/s to 18m/s. A linearized calibration relationship is used to convert the measured voltage data to velocity. For the hot wire wake survey, we used a Dantec, Inc. L-shaped wire which is right angled prongs sensors perpendicular to probe axis to minimize the influence of probe body. Twenty thousand samples of instantaneous velocities are collected at 10,000 samples per second Nyquist frequency. This assumes a useful resolved frequency of about 5 kHz. The National Instruments data acquisition system (CompactDAQ) with two different LabView programs (one for the Pitot - static tube survey and one for hotwire survey) are used for the data processing. Overall experimental uncertainties are estimated by repeating the experiments thrice. The maximum uncertainty in the drag coefficient estimates were within ± 4.0 percent and the mean velocities about ± 3.5 percent.
Table 1. Range of Reynolds number used for the experimental and computational study
3. Computational Studies
The simulation is performed for the same diameters and velocities as mentioned above for the experiments to estimate the drag coefficient and the wake flow features. The Direct Numerical Simulation (DNS), a pressure based steady-state solver with second-order upwind flow discretization is used to compute all the test cases. The analysis is performed considering an undeformed cylinder and a flexible cylinder accounting for the elastic deformation. The boundary conditions similar to the experiment were used in the simulation i.e. the edges of the wire were fixed. To account the numerical simulation errors due to different grids and good convergence results a grid independent study discussed below was performed.
3.1 Grid Independence
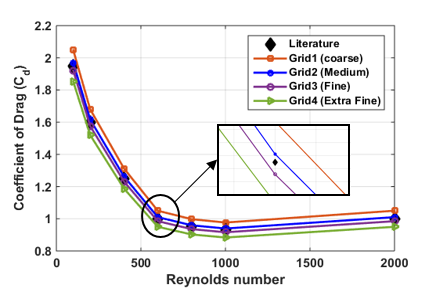
This study was conducted on a 2D circular cylinder with a radius of 25mm and Reynolds number ranging from 200 to 1000. The resulting coefficient of drag from numerical simulation was validated against the literature values [4]. Computations were carried on four different 2D-structured grids on a circular cylinder of the following sizes, grid1 (~10000 elements), grid2 (~50000 elements), grid3 (~150000 elements), and grid4 (~450000 elements). Figure 1 shows the comparison of the results of coefficient of drag versus Reynolds number for the above given grid sizes. The simulation results with grid3 gave the most satisfactory agreement with the literature values at every data point, hence this grid size is used to calculate the drag coefficients for all the other circular cylinder diameters.
3.2 Rigid Cylinder Simulation
Initial simulations were conducted on the cross-section of the wire assuming the cylinder to be rigid and infinitely long. The inlet/outlet boundary condition were used for fluid entering/exiting the domain, whereas the far-field covering the rest of the domain and circular cylinder are given wall boundary conditions. The grid size3 from the grid independent study was used for 3 different diameters of the wire i.e. 760, 790 and 1000 microns and the velocity ranging from 5m/s to 18m/s. The values of average dynamic pressure and velocity profile were extracted by slicing the domain at the downstream locations at 5d, 8d and 13d from the wire rear stagnation point, similar to the pitot static and hot wire measurements extracted from the experiment.
The resulting values show about 8% less drag coefficient than the experimental results. This difference is expected due to neglecting the flow induced deformation on the thin cylinder. To account for the deformation, another set of study was performed by considering the deformation of the wire in the simulation. To reproduce the similar experimental conditions the rigidity modulus of the wire is changed in the simulation and coupled with fluid structure interaction.
3.3 Fluid Structure Interaction Simulations
The fluid structure interaction (FSI) 3D simulations for different wire diameters are conducted to study the effect of wire deformation on the drag coefficient and wake flow structure.
To do this, one-way FSI model is used. The workflow for this case was setup in the workbench linking the fluid flow analysis (ANSYS Fluent) -> structural analysis (ANSYS Mechanical) -> grid generator (ICEM-CFD) -> fluid flow analysis (ANSYS Fluent).
As the first step in this workflow the fluid analysis is computed using DNS model in Fluent. The pressure loads at given velocity on undeformed 3D cylinder are computed. In the second step for structural analysis, Young’s modulus and the fixed end boundary conditions were used similar to the experiment. The pressure loads output from fluid analysis are used as the inputs for static structural analysis and projected on the undeformed 3D cylinder. The total deformation due to the pressure loads depending upon the Young’s modulus of the material is exported as a deformed 3D cylinder geometry in the ‘STL (STereoLithography)’ format and imported to ICEM-CFD to generate solid body and the mesh. Mesh generated is similar to the grid size3 (grid independence study) on the deformed 3D cylinder and exported to the fluid analysis. The boundary conditions used is same as explained in rigid cylinder simulation. The DNS model is used to compute the average dynamic pressure and velocity profile on the deformed 3D cylinder. The drag coefficient is calculated based on the pressure values from the wake profile at the downstream locations i.e. 5d, 8d and 13d from the wire rear stagnation point (similar to the experiment). The drag coefficient values from one- way FSI is compared with the experimental data.
4. Results and Discussion
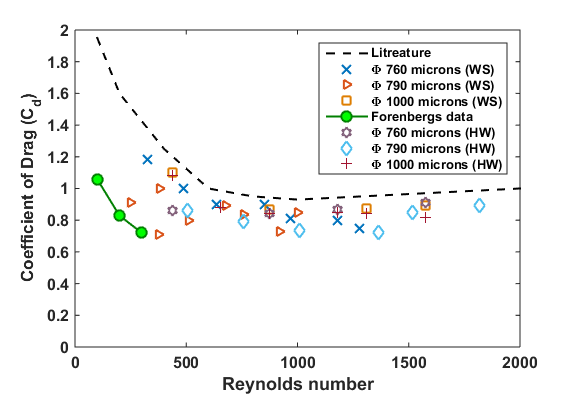
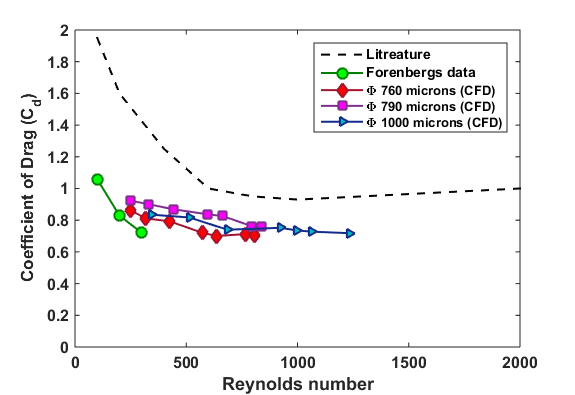
About 20% of reduction in the drag coefficient is observed with respect to the literature values for the cylinder. The figure 2 shows the coefficients of drag vs Reynolds number plot obtained from the pitot-static tube and hot wire wake surveys compared against the literature values. The plot evidently shows the low drag coefficient values and agree with Forenberg’s data. Figure 3 shows coefficient of drag versus Reynolds number for rigid cylinder along with literature and Forenberg’s data. The rigid cylinder simulation showed up to 8% additional lower drag coefficient value compared to the experiments and more than 20% lower drag coefficient values compared to the literature results.
The figure 4 shows the drag coefficient vs Reynolds’s number plot comparing the experiments and FSI simulation results. The FSI simulation results shows reduction in the drag coefficient closer to that observed in the experiments. The observed reduction in drag coefficient in Figures 2,3 and 4 can be explained based on the flow past over a large fineness ratio cylinder having a thin wake region. The drag forces are largely due to skin friction, i.e. the shear stresses of the base boundary layer. For bluff bodies (or small l/d ratio), due to the pressure gradient effect on the boundary layer, the flow usually separates near points at the maximum cross-section and forms a broad wake. The difference in stream wise component of the pressures in the fore and aft parts of the cylinder results in the pressure (form) drag, which is predominant portion of the total drag. The flow separation regions and the boundary layer instabilities for relatively large cylinders are defined and discussed by many researches. Therefore, this work only focuses on the effect of flow induced deformation of thin flexible cylinders and on their wake structures.
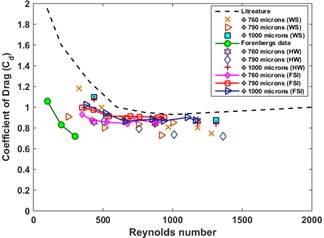
Figure 5 shows the normalized mean velocity with respect to freestream velocity for the wire diameter of 760 microns from the hot wire measurements. It is observed that with increasing Reynolds number the wake width is increased approximately by 10 % of the wake width value corresponding to Re = 260. Similar trends were observed for 790 microns and 1000 microns diameter wires. As the Reynolds number increases the coefficient of drag decreases hence increasing the wake width.
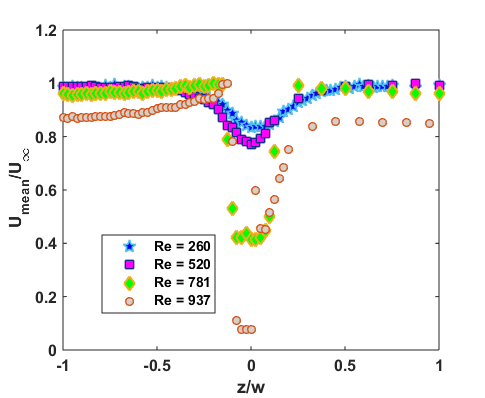
Figure 6 shows plot of the velocity deficit for the 760, 790 and 1000microns diameter wires, normalized with the maximum deficit velocity as a function of Reynolds number. It is observed that with increasing Reynolds number the velocity deficit increases, nearly independent of the wire diameter. The drag coefficient is calculated by integrating the momentum deficit profile in the wake at 5d downstream with respect to the undisturbed upstream profile. It is observed that for Reynolds number below 500 the experimental values are noticeably lower than the literature values and this difference gradually diminishes for Reynolds number greater than 1000. This combination of same wake width and increasing maximum velocity deficit gives rise to increase in the velocity gradients which eventually leads to wake instability and transition. The velocity measurements are taken in the transitioning wake.
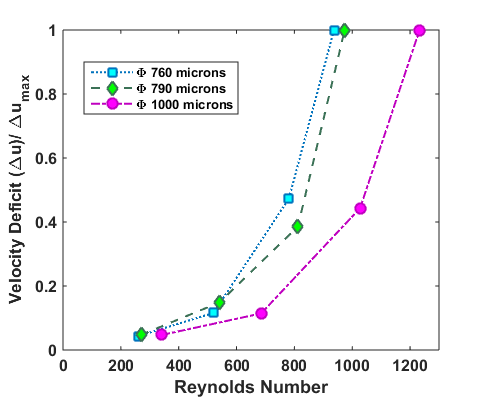
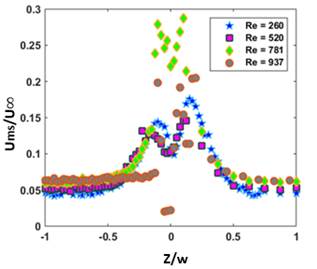
Figure 7 shows the plot of root-mean square (RMS) fluctuations, normalized with freestream velocity as a function of Reynolds number for 760 microns diameter wire. The RMS fluctuation profile is measured in both laminar and transitional wake regions. The downstream decay of normalized RMS velocity fluctuations shows varying rates of decay for the given range of Reynolds numbers.
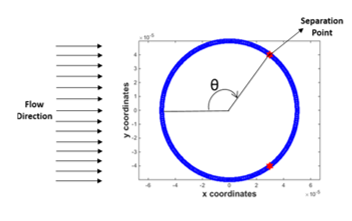
The Figure 8 shows the comparison of the normalized mean velocity variation for flexible wire simulation, rigid wire simulation and hot wire data of diameter 760 microns and Re = 260. The flexible wire simulations showed the same wake width as the hot wire experiments whereas the rigid wire simulation showed a narrow wake width but with peaky profile which results in lower drag coefficient value. The flexible wire simulation wake results of the vector flow field are further analysed using contour plots (shown in Figure 16). The flow separation is calculated using the zero wall shear stress data from the FSI simulation for all the range of Reynolds numbers.
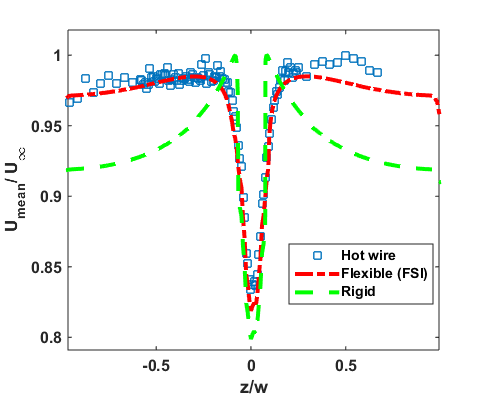
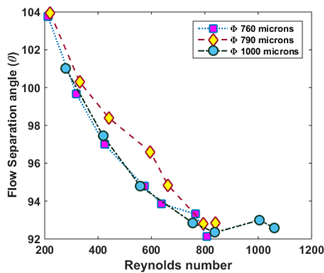
Figure 9 shows the flow with symmetric flow separation locations and figure 10 is the plot of flow separation angles for varying Reynolds numbers. These figures indicate that for sub-critical Reynolds numbers, the boundary layer is laminar and the separation occurs early on the front side of the wire. The wake is large and laminar initially. With increasing Reynolds number, the deformation of the wire triggers instability waves in the wake of the Tollmein-Schlichting type and setting up the wake transition process. The eddy motions in the near wake field energizes the cylinder boundary layer and moves the separation point downstream to the rear of the cylinder with a consequent decrease in the wake deficit and drag coefficient. With the increase in Reynolds number the wake instability grows into 3-d waves and spreads to the far field.
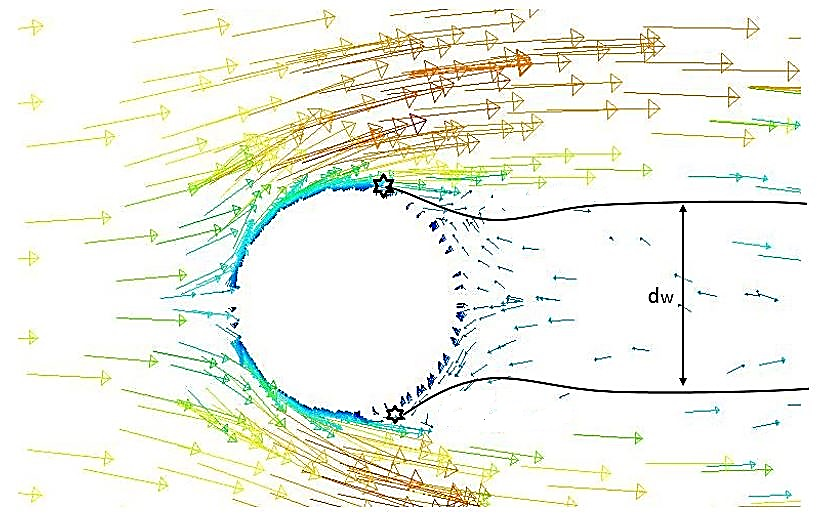
The impact of the wake instability on the wire boundary layer is diminished as the wake becomes fully turbulent in the far-field as illustrated in Figure 18. This observation is similar to Williamson’s [6] results which show a noticeable dip in the base pressure due to unsteady wake beyond Reynolds number of about 200. The figure 11 shows the velocity vectors in the wake region of the wire. Roshko [1] refers it to type ‘B’ separation which is a characteristic transcritical flows, i.e., the separation is on the back of the cylinder and the ratio of the wake width (dw) to wire diameter is less than one.
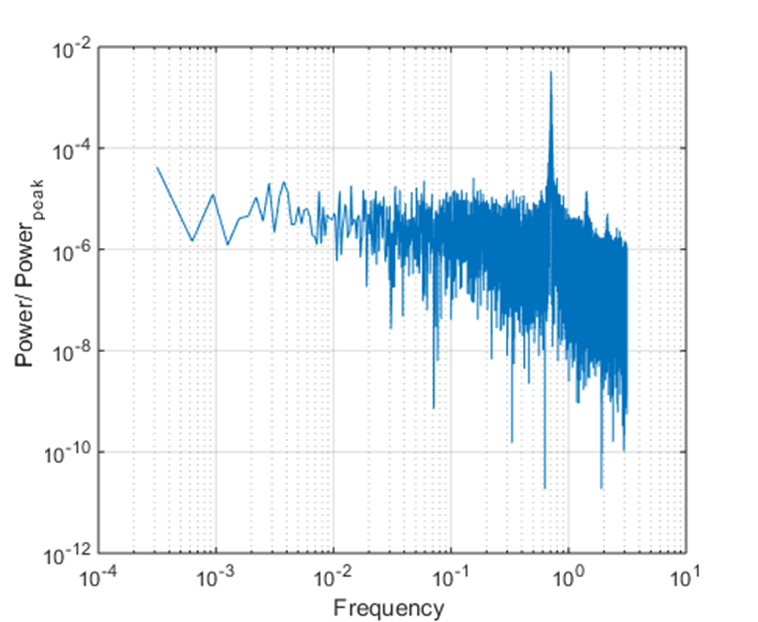
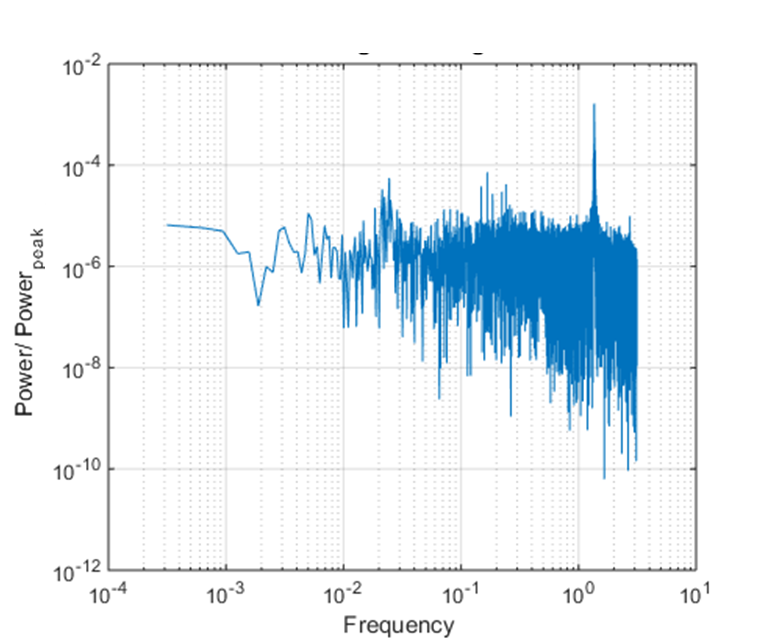
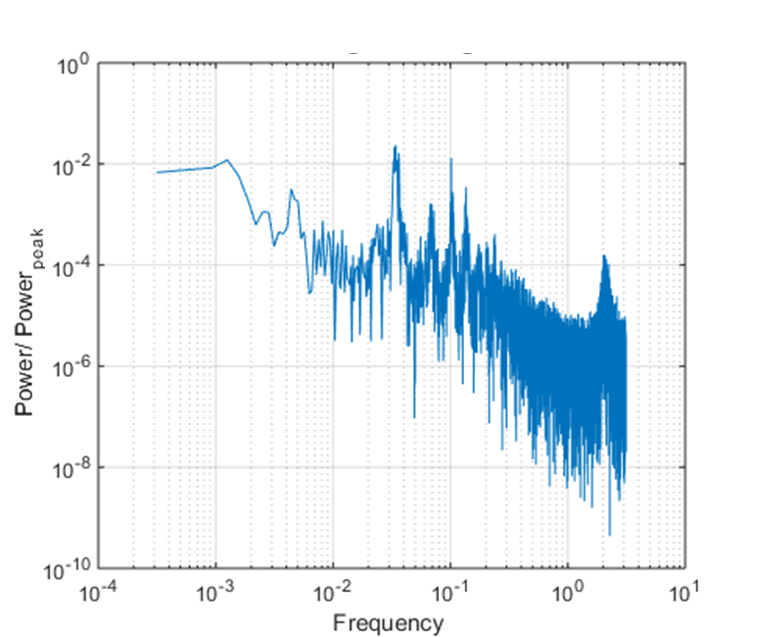
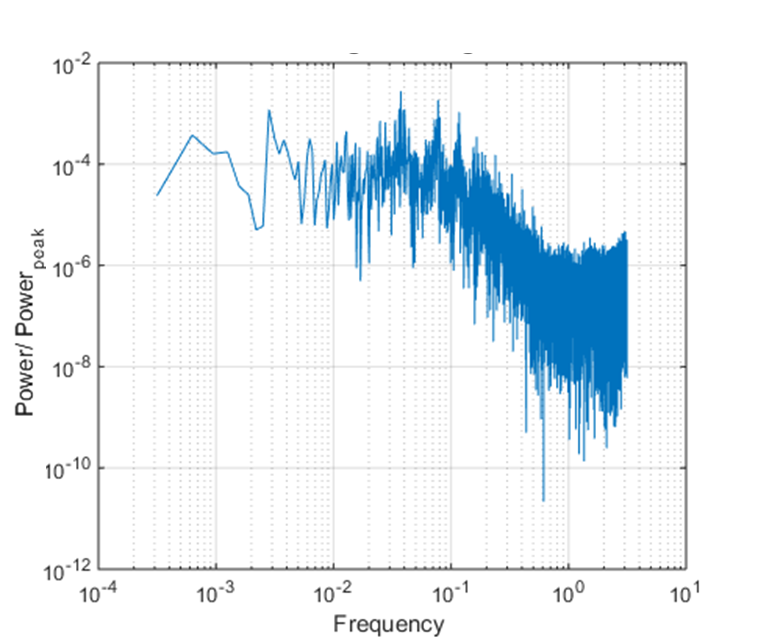
To further analyse the wake structure and calculate the frequency of vortices, power spectra of the flow velocities in the wake region is determined and figures 12 to 15 shows the plot of power spectral density normalized with maximum power for Reynolds number of 260, 520, 781 and 931 for the wire diameter 760 microns. The Strouhal frequency (fundamental) and its harmonics are characterized by distinct sharp peaks in the spectra. The Strouhal frequency increases with the increase in Reynold’s number and the lowest Strouhal frequency of 0.27 occurs at Re 260, which is close to the frequency in transcritical flows as reported by Roshko [1]. His result shows the Strouhal frequency of 0.25 for Reynold’s number of 250. The lower Strouhal number corresponds to the lower vortex shedding frequency as the drag coefficient approaches to minimum value [9]. The frequency spectrum also shows broadband energy which indicates the shear-layer turbulent fluctuations occurring downstream where the narrowband peak vanishes. This kind of large fluctuating energy is also observed in the flow spectra by Roshko [1]. His results and the current result have shown the origin of the large low-frequency irregularities in wake transition which are due to growth of large vortical structures in the wake.
The flow induced deformation causes turbulent separation and the flow detaches forming trailing vortices of equal strengths but alternating signs and this shedding decreases with increasing Reynolds number as shown in the figure 16, the velocity contour plot shows vortex shedding with respect to the Reynolds number based on diameter 760, 790 and 1000 microns. Figure 17 shows the structural deformation when pressure from the fluid simulations are imposed on the wire at time step 0, 1s and 2s respectively.
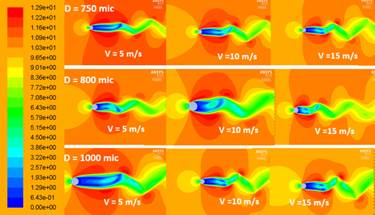
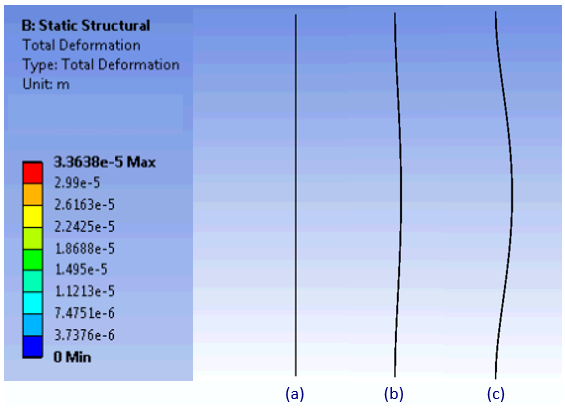
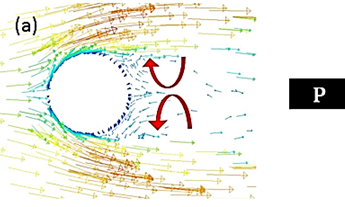
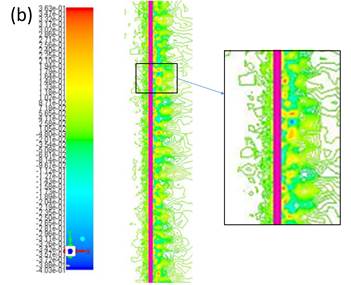
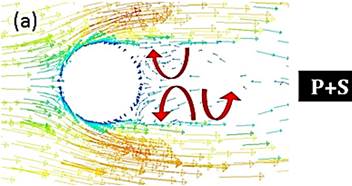
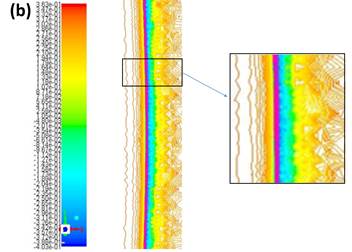
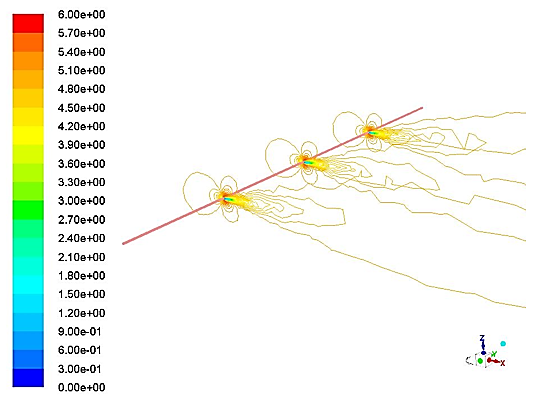
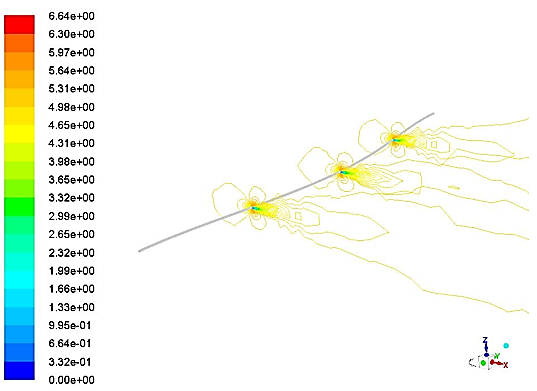
Figure 18 and figure 19 shows the comparison of the shedding types for the wire before and after deformation, (a) and (b) shows the cross-sectional view with flow vectors for an un-deformed and deformed wire respectively. The rigid wire has a narrow wake compared to the flexible wire. It shows a pair of vortices released from the un-deformed wire which is also known as ‘P’ mode, the deformation alters the shedding mode to a pair vortex combined with single vortex also known as P+S mode and this variation in the wake contributes to the drag reduction [2]. The figure 20 shows the spanwise velocity magnitude for the un-deformed wire which shows uniform shedding and strong normal velocity gradients in the near wake and figure 21 shows the almost uniform span wise velocity and less strong normal velocity gradient in the near wake.
These observations and results encourage to further investigate the nature of the wake and its interaction with the boundary layers. It is observed that the wake in the downstream is altered due to the deformation and shows the significate effects of wake transition effecting the coefficient of drag for the experiments and computations.
6. Conclusions
The drag coefficient of thin flexible cylindrical wire in a cross flow is investigated for Reynolds numbers 200 to 1000. Experiments using pitot static tube and single hotwire anemometer and, the DNS simulations using 0.15 million grid elements are used for the study. Compared to the generally accepted details of the wake characteristics this study suggests approximately 20% reduction in the drag coefficient at Reynolds numbers between 260 and 1250. The evidence of unsteady wake flow structure leading to turbulence in the wake is believed to be responsible for local drag reduction in the nearfield. A semblance of periodic narrowband unsteadiness (vortex shedding) is noticed at lower Reynolds numbers. As the Reynolds number increases, the periodic unsteadiness changes to a broadband random unsteadiness, leading to a fully turbulent wake.
The fluid structure interaction study for the flexible wire gave small deflection values and less strong shear and vorticity in the wake as compared to rigid wire. Consequently, less fluctuation in velocity and wake mixing is expected. This gives rise to somewhat less reduction in the drag coefficient for flexible thin wire than a rigid wire. But variation in wake structure due to the deflection for large diameter wires is to be investigated.
References
[1] A. Roshko, Experiments on the flow past a circular cylinder at very high Reynolds number. Journal of fluid mechanics, 1961, 10 (3). pp. 345-356. View Article
[2] C. H. K. Willamson and A. Roshko, "Vortex formation in te wake of an oscillating cylinder," Journal of fluids and strucutres , vol. 2, pp. 355-381, 1988.
[3] C. Subramanian and H. Gurram, "Drag coefficient of thin flexible cylinder," in 68th Annual meeting of APS Division of fluid dynamics , Boston , 2015.
[4] R. Munson. B, Y. D. F and O. T.H, Fundamentals of fluid mechanics, John Wily & Sons p 526, 2006.
[5] B. Fornberg, "Numerical study of steady viscous flow past a circular cylinder," Journal of fluid mechanics , vol. 98, pp. 819-855, 1980. View Article
[6] C. H. K. Williamson, "Vortex dynamics in the cylinder wake," Annual Review fluid mchnaics , New York , 1996. View Article
[7] R. Finn, "Determination of the drag on a cylinder at low Reynolds number," Journal of fluids and strucutres , vol. 24, no. 6, 1953.
[8] D. Newmman and G. E. Karnidakis, "Simulation of flow over a flexible cable: A comparision of forcd and flow induced vibration," Journal of fluids and structures , vol. 10, pp. 439-453, 1996. View Article
[9] O. Lehmkuhl, I. Rodriguez, R. Borrell, J. Chiva and A. Oliva, "Unsteady forces on a circular cylinder at critical Re numbers," Spain, 2014. View Article