Journal of Fluid Flow, Heat and Mass Transfer (JFFHMT)
ISSN: 2368-6111

Volume 6 - Year 2019 - Pages 49-59
DOI: 10.11159/jffhmt.2019.004
Numerical Study of Patient Respiration Effect on Bacterial Dispersion in a Surgery Room
Alireza Khademi1, Mohammad Hassan Saidi2, Masoud Darbandi1, Gerry E. Schneider3
1Sharif University of Technology, Department of Aerospace Engineering Azadi Ave, Tehran, Iran P.O. Box 11365-11155
khademi_alireza@ae.sharif.edu; darbandi@sharif.edu
2Sharif University of Technology, Department of Mechanical Engineering
Azadi Ave, Tehran, Iran P.O. Box 11365-11155
saman@sharif.edu
3University of Waterloo, Department of Mechanical and Mechatronics Engineering 200 University Ave W, Waterloo, ON, Canada N2L 3G1
gerry.schneider@uwaterloo.ca
Abstract - This study aims to present a numerical investigation of respiration influence on the particle concentration in a surgery room. Controlling the temperature and contamination in the surgery room is essential for safe and risk-free surgical procedures. Generally, in many hospital cleanrooms, utilized for operations such as open-heart surgery, organ transplantation, and neurosurgery, the reduction of pollutant particles is vital as a factor that can lead to capillary clogging during an operation. Also, reducing the concentration of large particles is very important, because dust particles may contain various pathogenic bacteria and viruses. Therefore, particle distribution and temperature control were numerically investigated in this study. At first, the particle concentration at specific zones was investigated to obtain the stability of the respiratory cycle. Then, the concentration and aggregation of particles around the patient’s head were measured on different pages along the coordinate axes while patient’s breathing was quite stable. Furthermore, the effect of the air conditioning system of the room on temperature distribution control by was studied in a specific area. The simulation results showed a considerable decrease in the particle concentration, but the particles were not eliminated from the room completely. Moreover, the higher temperature of the area around the patient's head caused by his breathing had little effect on room temperature, and the inlet air controlled the room temperature properly.
Keywords: Patient respiration, bacterial dispersion, surgery room, particle concentration, CFD.
© Copyright 2018 Authors - This is an Open Access article published under the Creative Commons Attribution License terms Creative Commons Attribution License terms. Unrestricted use, distribution, and reproduction in any medium are permitted, provided the original work is properly cited.
Date Received: 2019-08-23
Date Accepted: 2019-09-30
Date Published: 2019-10-04
Nomenclature
![]() Drag
coefficient (dimensionless)
Drag
coefficient (dimensionless)
![]() Particle
diameter (m)
Particle
diameter (m)
![]() Additional
acceleration (N/kg)
Additional
acceleration (N/kg)
![]() Gravitational
acceleration (m/s2)
Gravitational
acceleration (m/s2)
![]() Turbulent
kinetic energy (m2/s2)
Turbulent
kinetic energy (m2/s2)
![]() Mean
pressure (Pa)
Mean
pressure (Pa)
![]() Relative
Reynolds number (dimensionless)
Relative
Reynolds number (dimensionless)
![]() Source
term (kg.m/s)
Source
term (kg.m/s)
![]() Temperature
(K)
Temperature
(K)
![]() Time
(s)
Time
(s)
![]() Mean
velocity components (m/s)
Mean
velocity components (m/s)
![]() Fluctuating
velocity component (m/s)
Fluctuating
velocity component (m/s)
![]() Particle
velocity (m/s)
Particle
velocity (m/s)
![]() Coordinate
(m)
Coordinate
(m)
Greek Symbols
![]() Density
(kg/m3)
Density
(kg/m3)
![]() Particle
density (kg/m3)
Particle
density (kg/m3)
![]() Fluid
viscosity (Pa.s)
Fluid
viscosity (Pa.s)
![]() Eddy
viscosity (Pa.s)
Eddy
viscosity (Pa.s)
![]() Kronecker
factor (dimensionless)
Kronecker
factor (dimensionless)
1. Introduction
A cleanroom is usually considered as an environment with minimum amount of environmental pollutants with respect to the regular level of a closed environment, which is necessary to produce products or carry out scientific and industrial researches. Dating back to more than one hundred years ago, designing and manufacturing of cleanroom originated from the efforts to control the spread of the viruses and diseases in hospitals. However, in the advanced present-day societies, the necessity for clean spaces to manufacture industrial equipment seems indispensable. Nowadays, cleanrooms have numerous applications in modern industries [1-7].
According to ISO standard 14644-1, a cleanroom is a space where the concentration of the particles is controlled, constructed and operated in a way that the admittance, generation, and settlement of the particles in the environment are minimized [8]. Many numerical studies focus on determining the effective parameters such as the particle distribution in a cleanroom, since considering these parameters is crucial in the design and fabrication process. For accurate assessment of the condition of the flow circulation, it is essential to determine the particle concentration distribution [9, 10].
In short, the knowledge of air distribution, which includes air velocity, temperature, and pollution, can lead to an optimal design of the heating, ventilation, and air conditioning (HVAC) system to create an acceptable level of comfort and a suitable quality of indoor processes. This knowledge is acquired through experimental investigation and numerical modeling. These two are the main available methods for obtaining quantitative information about local velocity distribution around the occupants [11, 12]. The most reliable method for determining the air distribution is the experimental method. In most cases, the experimental investigation requires a full-scale test room with controlled environmental conditions. The cost of the equipment is also exceedingly high, and measurements are only possible at specific points. A wide range of studies in this field are experimental.
The numerical modeling methods can solve the physical governing equations and they are cheaper and faster than the experimental methods. However, the physical processes in numerical modeling are complex. Therefore, appropriate approximations are often applied. Hence, the accuracy of numerical calculations must be validated against verified experimental data [13-15]. In recent years, computational fluid dynamics (CFD), which numerically solve the mass, momentum, energy, and concentration equations, has found numerous applications for solving the indoor air distribution. The experimental and numerical studies in such spaces have widely attracted the attention of the researchers. In order to establish the principles of cleanroom design, a meticulous investigation on the airflow pattern in such spaces is one of the most important factors; and to obtain such criterion, it seems crucial to study the flow pattern and particle concentration distribution in that space. Extensive studies have been conducted on the modeling of airflow in interior space, both numerically and experimentally.
Rui et al. [16] carried out a series of experiments on cleanrooms with ISO 5 and ISO 6 cleanliness levels. The governing equations were solved with the Eulerian-Lagrangian approach, using the standard k-ε turbulence model to represent the particle deposition in the surgery room. The numerical results had an acceptable agreement with the experiments suggesting that the particle deposition increases up to a critical point as the velocity increases. Phuong and Ito [17] investigated the flow behavior and particle deposition, both numerically and experimentally using particle image velocimetry in a ventilation duct. At low Reynolds numbers, the k-ε turbulence model was chosen due to its suitable accuracy. The movement of the particles due to the temperature difference between the cold and hot walls was investigated. Small particles followed the streamline, but larger ones deposited and exit from the inlet.
The impact of the source displacement on the distribution of the suspended particles was determined by Saidi et al. [18]. The results indicated that the specifications of the concentration distribution such as the final efficiency and the propagation radius increased. When the movement path of the pollutant source coincided with the movement path of the air conditioner streamlines, the final efficiency represented the minimum amount of dependency on the movement path of the pollutant source. Méndez et al. [19] and Zhong et al. [20] determined the effect of the inlet and outlet gates location on the airflow pattern in clean spaces. The results indicated that the location of the inlet gates had a significant influence on the distribution of the flow specifications such as the velocity, temperature, and concentration of the pollutants while the position of the outlet gate had a negligible effect. According to research works carried out by Hagström et al. [21] and Lee and Awbi [22], the location of the obstacles and equipment drastically affected the flow pattern in the environment. However, the results of these studies were very general with respect to the diversity of the cleanrooms applications.
Subsequently, the effect of different parameters including the geometry of the inlet gates and the effect of the particle generation from the floor, which is also known as the effect of the particle suspension, were observed in various studies. However, these results were beyond the scope of this study. Airflow in cleanrooms was usually described as being a low velocity, turbulent, and unsteady movement of air with a buoyancy effect [23]. This was also the case for the so-called layered cleanrooms.
It is very important to interpret the characteristics of the turbulent flow in order to represent the internal turbulent flow. Irregularity, permeability, three-dimensionality, and dissipation are among the most notable properties of turbulence. These features hinder the thorough comprehension of turbulence. Anyhow, the practical engineering such as the design of the air conditioning systems requires accurate prediction of the turbulent flow. Following the discussed works, in the present study, the numerical simulations of the patient's breathing in the cleanroom, the distribution of the particle concentrations, and the temperature distribution caused by the patient's breathing in a steady state were studied.
2. Computational Method
Due to the computational limitations of the direct numerical simulation (DNS) method in turbulent flows, the large eddy simulation (LES) method [24] or the Reynolds averaged Navier-Stokes (RANS) could also be employed [25]. DNS or LES required more memory and had higher costs. Due to the large dimensions of clean rooms and the high number of computational cells, LES is limited to a few studies and is rarely used. The comparison of the results of Tian et al. [26] and Posner et al. [27] showed that the results of LES method had the highest consistency with the experimental results. However, the results of RANS were also acceptable. the Eulerian-Lagrangian method was employed to simulate the concentration, respecting the influence of the particle settlement at specific locations such as the patient’s body in the environmental isolated room [28]. Given the size and density (number of particles per volume) of the particles, the virtual mass, pressure, Saffman forces, and Brownian forces were neglected in this method. Due to the fact that the walls are one of the main sources of vorticity in a flow, the wall effect should also be taken into consideration which resulted in more calculations during the k-ε model simulation [29]. Because it significantly affected the turbulence level in the vicinity of the wall. Regarding the accuracy and capability of the RNG k-ε turbulence model, it was used for turbulence modeling. The solution convergence in every step was achieved when the solution residuals decreased to less than 10-3 and 10-4, for continuity and flow equations, respectively. Because of the existence of a filter box or plenum box at the air inlet of the cleanroom and the vast dimensions of the inlet gate, the velocity of the air entering the room was uniform. Constant velocity boundary condition with a rate of 0.9 meters per second was considered at the inlet. The no-slip condition was held on the walls and the standard wall function was used to apply the effects of the wall on the flow turbulence. All walls were assumed to be thermally isolated. At the flow exit, the outlet boundary condition was considered at the outlet gates, implying zero gradients for the flow variables. This was a reasonable assumption for the continuity of the channel following the return gate and the existence of the return plenum. The values of density, viscosity, and thermal diffusivity of air were assumed to be constant, which were 1.225 kg/m3, 1.7894e-05 kg/m.s, and 1.9e-05 m2/s, respectively. Boussinesq approximation was also used for density, because Buoyancy force was considered in current study.
Airflow field was solved by RANS equations as follows:
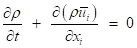
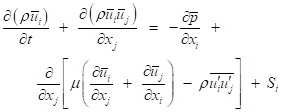
In which Si is the buoyancy term in the momentum equation which is equal to -ρβg(T- T0) [30]. Also, T0 is the inlet air temperature. T0 was considered as the reference temperature.
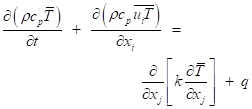
Conservation of energy:
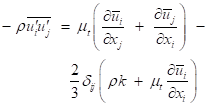
Reynolds stress:
For indoor turbulence modelling, two-equation k-ε model has proven to be practical for the prediction of the turbulent flow field [31, 32]. Between various k-ε models, RNG k-ε model can be applied for displacement airflow. RNG k-ε performs better than the standard k-ε model for predicting air velocity in indoor environments [29]. In a surgery room, however, standard k-model can be applied for the prediction of the airflow because of its relatively small turbulence level [29]. The well-known RANS equations and standard k-ε model can be applied for the calculation of the airflow field in a surgery room, the results of which will be employed to evaluate airflow pattern and to calculate particulate transport.
2. 1. Particle phase modelling
One of the most important issues of internal flows, especially in the surgery rooms, is deposition and diffusion of particles, particularly around the critical points of the room such as the bed, the patient's body and the nurse's respiratory area and modelling the particles in such spaces is inevitable. The study of multiphase flows has two different subdivisions. Generally, the concentration simulations are performed using Eulerian-Eulerian and Eulerian-Lagrangian approaches [28]. In both approaches the flow field is solved by Eulerian method but in Eulerian-Eulerian method the particle concentration is considered as a scalar quantity and a concentration transfer equation is solved for it. This method is incapable of predicting processes such as the deposition and diffusion of individual particles. In fact, Eulerian approach considers the problem volumetrically and does not provide any information about individual particles. In Eulerian-Lagrangian method the fluid field is solved using the Eulerian method, and the behaviour of solid particles is studied using Lagrangian method. In Lagrangian method [33], processes such as particle settlement and diffusion are thoroughly investigated. In fact, by solving the equilibrium equation of force, this method separately follows each particle and determines their trajectory.
The particle transport was calculated using the discrete phase model (DPM), based on the Euler-Lagrange technique, which firstly calculated the continuous-phase (air) to create an initial continuous phase situation. Following the attainment of the airflow field, the discrete-phase (particles) was combined with the flow, so the particle tracks were traced throughout the transitory procedure. Particle transfer was tracked by the Lagrangian particle trajectory-tracking model, and according to the particle force balance equation, its settlement was presented as [34]:
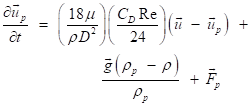
In equation 5, Fp is the sum of the most significant additional forces per unit mass affecting the movement of particle, including pressure gradient force, Thermophoretic force, Brownian motion force, Saffman lift force and virtual mass force [35]. The pressure gradient force is only significant when the particle density is lower than the fluid density. The phoretic forces are due to the gradient of scalar quantities such as temperature as well as volumetric forces such as electrostatic forces. The Brownian force has a statistical nature, and when particles are small, the random movement of particles and their collision with fluid molecules is the cause of this force. Saffman force is for the flows with shear force and includes the wall effect. Finally, the virtual mass force that is important for accelerated fluid motion and is negligible when the particle-to-fluid density ratio is high.
DPM boundary condition was adjusted as particle escaping via the nose, inlet, and outlet, and trap for the walls and body surfaces.
2. 3. Coupling between phases
When the number of particles injected into the fluid is negligible and the particle size is small, the effect of the particles on the fluid phase is negligible. Therefore, one-way coupling method was employed to model the coupling between phases [28]. In this method the effect of the particles on the flow field was ignored and only the effect of the fluid phase on the particles was considered.
3. Test Case
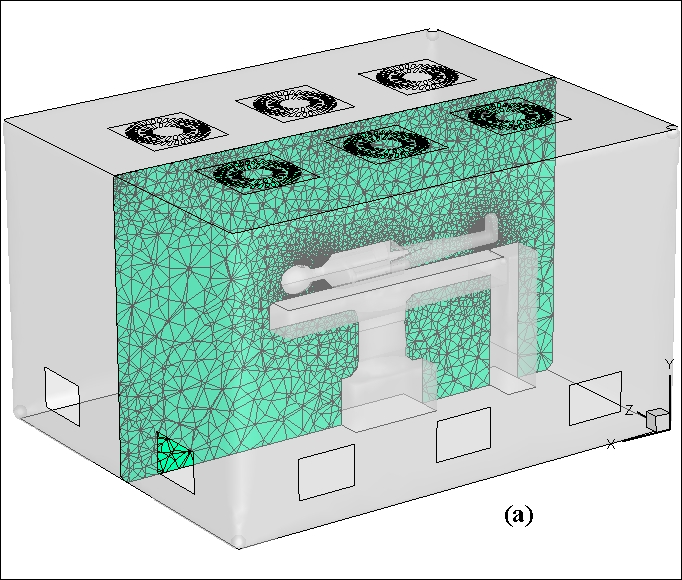
The cleanroom of the mechanical engineering department of Sharif University of Technology was constructed with a rectangular cross-section and approximate dimensions of 2.9×3.7 square meters and a height of 2.5 meters. It had six inlet gates in the ceiling with dimensions of 60×60 square centimetres and five outlet gates on the walls with dimensions of 30×45 square centimetres. The inlet arrangement could be altered by selecting the different inlet gates in the ceiling. Respiration was considered as a reciprocating flow (inhale and exhale) and a pause (2.5 second exhale, 2.5 second inhale and 1 second pause)., The respiration rate was 0.25 meters per second. The air exited from the mouth during respiration consisted of N2, O2 and CO2 which their concentrations were 80%, 16% and 4%, respectively. In addition to the gases exited from the patient mouth, some particles came out of the mouth as bacteria. It was assumed that bacterias were continuously released through the exhale at a rate of 0.25 m/s and were spread by particles existing in air with a diameter of 5 microns in the room. The particle density was considered to be 1000 kg/m3 because a significant volume of bacteria was water. In each respiratory cycle, 1000 particles were released into the room from the mouth of each patient within 2.5 seconds of exhale. Therefore, with the patient admitted to the room, total mass flow rate of the particles was 4.71e-14kg/s. The adhesion and adsorption of bacteria on surfaces were neglected due to complexity. The input air temperature was equal to the room temperature which was 20 °C and patient's exhale temperature was assumed to be 37 °C.
3. 1. Mesh Independency and Numerical Validation
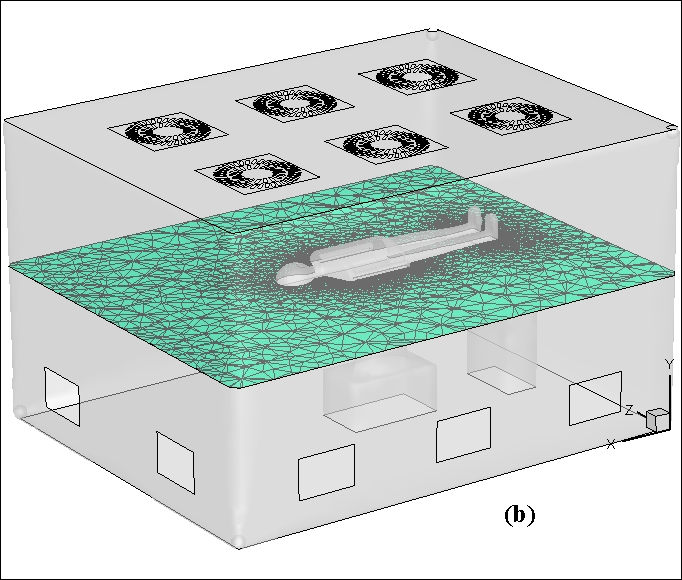
Three types of meshes with 781836, 1109468, and 1674702 cells were generated to examine the mesh independency of the solution. The mesh was unstructured and non-conformal and designed to study the bacteria concentration at a distance of 5 centimetres from the mouth. Because of its mesh-independent resolutions, the mesh with 1,109,468 cells was used for the subsequent solutions. The concentrations of these three conditions for a respiratory cycle are compared in Figure 1. The numerical results of the normalized concentration distribution with the Lagrangian method were validated with the experimental results of Chen et al. [36]. Details of this validation are not discussed here. Figure 2 shows the geometry of room, and the mesh generation in two vertical and horizontal planes.
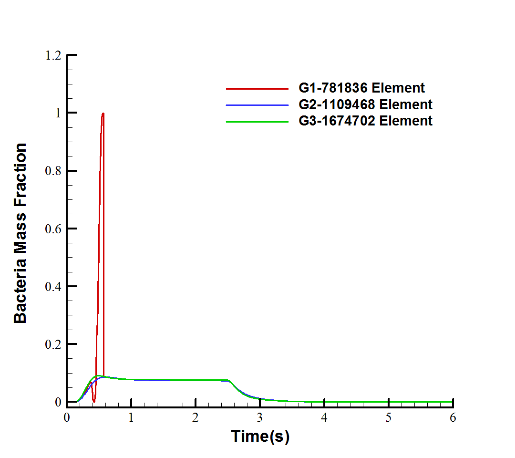
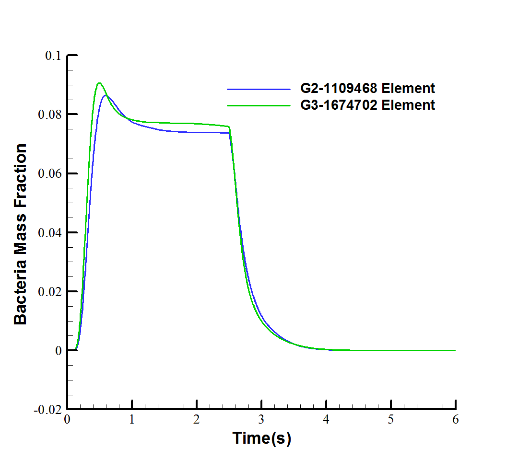
Figure 1. Mesh independency via bacteria mass fraction in (a) 3 cases, (b) 2 cases.
4. Results and Discussion
At first, the number of cycles required to reach a stable state was elapsed, because the beginning of respiration may be associated with instabilities. The mesh with 1109468 cells was selected according to the mesh independence study and employed in the subsequent simulation. Five six-second respiratory cycles (30 seconds totally), were simulated. Figure 3 shows the periodic mass fraction in breathing cycles. As stated in the diagram shown in this figure, the bacteria concentration became periodic after the first and second cycles, at a distance of 5cm from the mouth. The disparity during the first 3 cycles was due to the stagnation state at the start of the flow in the room which needed time to reach a stable state. It is evident that the existence of a peak in each cycle was related to the maximum amount of output bacteria at the end of the inhale stage.
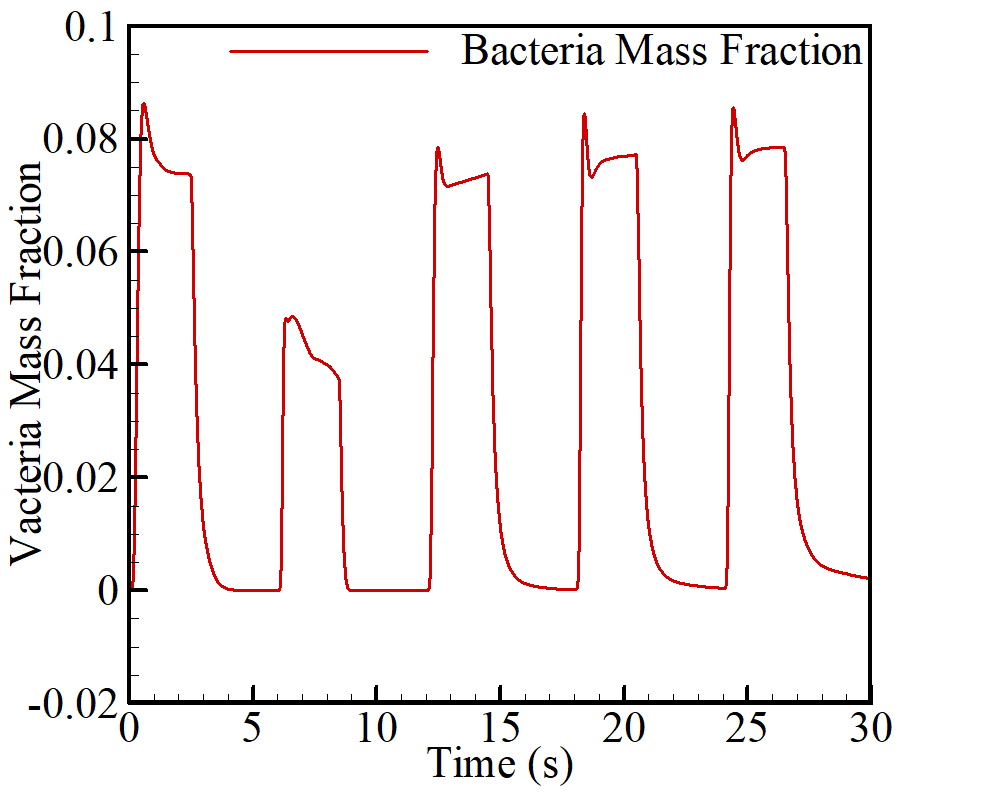
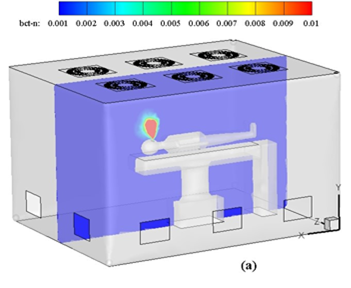
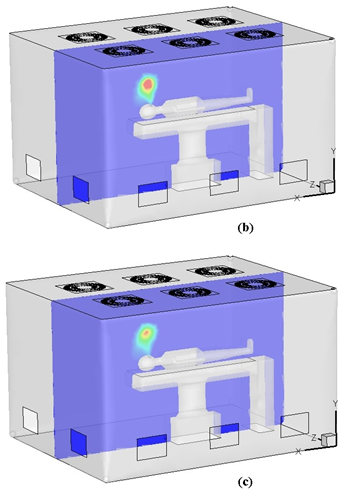
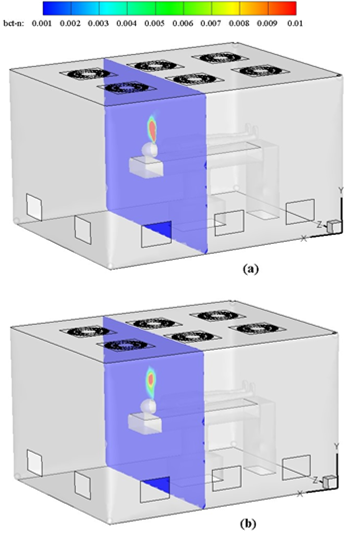
Figure 4 demonstrates the bacteria mass fraction concentration at mid-plane which is perpendicular to the z-axis of cleanroom at three different times of 26.5, 29.0, and 30.0 seconds. According to the contours shown in this figure, the concentration of bacteria accumulated around the patient’s head during respiratory cycle decreases over time, and its accumulation region will also move depending on the room input air velocity.
Considering the importance of the concentration distribution adjacent to the sensitive areas of the cleanroom, Figure 5 illustrates the concentration distribution on a horizontal plane (perpendicular to the y-axis) at a 20 cm distance from the patient's head, in addition to the concentration distribution along the vertical plane at the heart of the room. It is clearly seen that at this distance from the head, the level of the particle distribution was at its maximum amount compared to the other horizontal planes of the room. At the end of the exhale stage at 26.5 seconds, which was the start of the next inhale stage, the particle concentration on this plane reached its maximum amount. With the start of the inhale stage up to the end of the respiration cycle, the concentration decreased, although it did not reach the particle concentrations of zero.
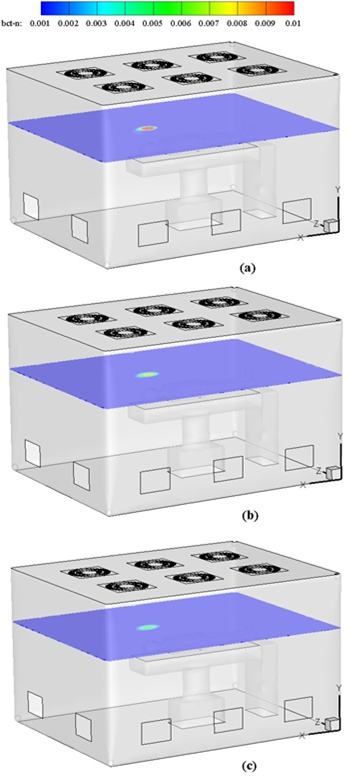
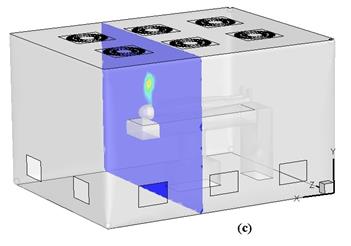
Figure 6 shows the particle concentration perpendicular to the x-axis. Similar to the previous situations, with the start of the exhale the particle concentration reached its maximum amount, and at the end of the cycle, the particle concentration around the patient's head decreased.
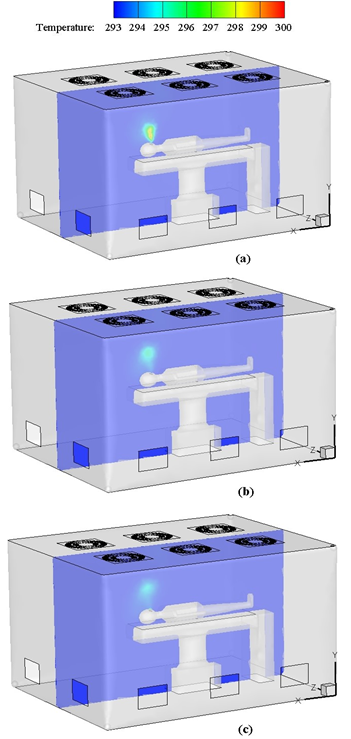
The contour in Figure 7 illustrates the temperature distribution along the vertical plane in the middle of the room at specific moments. At the end of the respiratory cycle, the input air at the end of the exhale stage (at 26.5 seconds) when the inhale stage started, the temperature of the immediate area around the patient's head reached its maximum amount. The particles disperse into the room with the warm air that came out of the patient's mouth. It should be noted that small particles (dp<10 micrometer) mainly suspended or deposited in the upper warm zone due to the buoyancy effect. With the start of the inhale, the air which came out of the patient's mouth during exhale began to disperse throughout the room which was due to the airflow entering the room and exiting from it. Therefore, the temperature of the air around the patient's head decreased, reaching a thermal equilibrium near the temperature of the room. The maximum temperature difference at the end of the respiratory cycle was about 2 °C and met the thermal comfort criteria according to the CIBSE guide.
At the end of the respiratory cycle, the particle concentrations accumulated around the patient's head was slightly above zero. Given the room arrangements, in order to reduce the particle concentration to the lowest possible amount in sensitive areas, especially around the patient's head, changes should be applied in the important parameters of the cleanroom such as the input air velocity of each of the air gates and the arrangement of the inlet air gates. The arrangement of the gates will be investigated in future studies.
5. Conclusion
In many hospital, surgery rooms are designed for open-heart surgery, organ transplantation, neurosurgery. It is exceptionally critical to disinfect the pollutant particles leading to capillary clogging during ordinary operations. The respiration influence on the particle concentration in a selected surgery room was numerically investigated in this study. The results showed that the bacteria concentration in the specified region would gradually decrease with time relative to the beginning moments the particle concentration around the respiratory area and patient’s head, decreased when the inhale phase began in each respiratory cycle. Also, the major particle concentration at the end of the exhale was in these areas. This is a significant observation in the application of isolation rooms with special conditions to reduce the risk of transmitting the micro-organisms of air to other vulnerable patients and hospital staff. Particle concentration at the sensitive areas adjacent to the patient, especially around the patient's head and respiratory tract, was controlled significantly by inlet air from air conditioning system in operating condition, and prevented the accumulation of particles in these areas. Furthermore, the temperature increase around the patient's head was properly controlled, which can help neutralize the adverse effects of concentration distribution, and the particle velocity in the immediate space around the patient's head. The air conditioning system of the room was able to control the temperature rise around sensitive areas, especially the respiratory tract and the patient's head, at the end of the respiratory cycle. In this case, increasing the temperature of the areas where accumulation of particles was more likely could have a negative effect on different parameters, such as the bacteria longevity, concentration distribution and the particle velocity in the immediate space around the patient's head. But as it was observed, the temperature difference of these areas compared to the rest of the room was approximately 2 °C at the end of the respiratory cycle, which decreased with respect to about 6 °C temperature difference at the end of the exhale phase.
Acknowledgements
The authors from Sharif University of Technology would like to thanks the support received from the Deputy of research and Technology in Sharif University of Technology.
References
[1] M. Mora, A. Mahnert, K. Koskinen, M. R. Pausan, L. Oberauner-Wappis, R. Krause, A. K. Perras, G. Gorkiewicz, G. Berg, C. Moissl-Eichinger, "Microorganisms in confined habitats: microbial monitoring and control of intensive care units, operating rooms, cleanrooms and the International Space Station," Frontiers in microbiology, vol. 7, p. 1573, 2016. View Article
[2] K. R. Meshram, N. S. Chougule, K. V. Mali, T. S. Jadhav, and M. M. Lele, "Air Conditioning for Cleanroom Applications-A Review," 2017.
[3] L. F. Shaw, I. H. Chen, C. S. Chen, H. H. Wu, L. S. Lai, Y. Y. Chen, F. Der Wang, "Factors influencing microbial colonies in the air of operating rooms," BMC infectious diseases, vol. 18, no. 1, p. 4, 2018. View Article
[4] B. D. Moore, "Air handling systems for cleanroom control," in Sterile Pharmaceutical Products: Routledge, 2018, pp. 37-88.
[5] J. Guns and R. Janssens, "Air quality management," in In Vitro Fertilization: Springer, 2019, pp. 29-37. View Article
[6] F. A. Flitsch, "Customized smart devices and touchscreen devices and cleanspace manufacturing methods to make them," ed: Google Patents, 2019.
[7] M. Tršan, K. Seme, and S. Srčič, "The environmental monitoring in hospital pharmacy cleanroom and microbiota catalogue preparation," Saudi Pharmaceutical Journal, vol. 27, no. 4, pp. 455-462, 2019. View Article
[8] I. Cleanrooms, "associated controlled environments-Part 1: Classification of air cleanliness," ed: ISO, 1999.
[9] A. Khademi, M. H. Saidi, and M. Darbandi, "Numerical Investigation of Particle Accumulation Effect Due to Human Respiration," in 27th Annual International Conference on Mechanical Engineering, April 30 – May 2, 2019, Tarbiat Modares University, Tehran, Iran, 2019, vol. 27, no. Fluid Mechanics: The Iranian Society of Mechanical Engineers, pp. 723-726.
[10] A. Khademi, M. H. Saidi, M. Darbandi, and G. E. Schneider, "Numerical Study of Bacterial Influences Caused by Patient Breathing." View Article
[11] C. Chao and M. Wan, "Airflow and air temperature distribution in the occupied region of an underfloor ventilation system," Building and Environment, vol. 39, no. 7, pp. 749-762, 2004. View Article
[12] M. Krajčík, A. Simone, and B. W. Olesen, "Air distribution and ventilation effectiveness in an occupied room heated by warm air," Energy and Buildings, vol. 55, pp. 94-101, 2012. View Article
[13] Z. Zhang, W. Zhang, Z. J. Zhai, and Q. Y. Chen, "Evaluation of various turbulence models in predicting airflow and turbulence in enclosed environments by CFD: Part 2—Comparison with experimental data from literature," Hvac&R Research, vol. 13, no. 6, pp. 871-886, 2007. View Article
[14] F. Kuznik, G. Rusaouen, and J. Brau, "Experimental and numerical study of a full scale ventilated enclosure: Comparison of four two equations closure turbulence models," Building and Environment, vol. 42, no. 3, pp. 1043-1053, 2007. View Article
[15] M. Wang and Q. Chen, "Assessment of various turbulence models for transitional flows in an enclosed environment (RP-1271)," Hvac&r Research, vol. 15, no. 6, pp. 1099-1119, 2009. View Article
[16] Z. Rui, T. Guangbei, and L. Jihong, "Study on biological contaminant control strategies under different ventilation models in hospital operating room," Building and environment, vol. 43, no. 5, pp. 793-803, 2008. View Article
[17] N. L. Phuong and K. Ito, "Experimental and numerical study of airflow pattern and particle dispersion in a vertical ventilation duct," Building and Environment, vol. 59, pp. 466-481, 2013.View Article
[18] M. Saidi, B. Sajadi, and G. Molaeimanesh, "The effect of source motion on contaminant distribution in the cleanrooms," Energy and Buildings, vol. 43, no. 4, pp. 966-970, 2011.View Article
[19] C. Méndez, J. San José, J. Villafruela, and F. Castro, "Optimization of a hospital room by means of CFD for more efficient ventilation," Energy and Buildings, vol. 40, no. 5, pp. 849-854, 2008.View Article
[20] K. Zhong, X. Yang, and Y. Kang, "Effects of ventilation strategies and source locations on indoor particle deposition," Building and environment, vol. 45, no. 3, pp. 655-662, 2010.View Article
[21] K. Hagström, A. Zhivov, K. Siren, and L. Christianson, "Influence of the floor-based obstructions on contaminant removal efficiency and effectiveness," Building and Environment, vol. 37, no. 1, pp. 55-66, 2002.View Article
[22] H. Lee and H. Awbi, "Effect of internal partitioning on indoor air quality of rooms with mixing ventilation—basic study," Building and Environment, vol. 39, no. 2, pp. 127-141, 2004. View Article
[23] X. Cao, J. Liu, N. Jiang, and Q. Chen, "Particle image velocimetry measurement of indoor airflow field: A review of the technologies and applications," Energy and Buildings, vol. 69, pp. 367-380, 2014. View Article
[24] C. Beghein, Y. Jiang, and Q. Y. Chen, "Using large eddy simulation to study particle motions in a room," Indoor air, vol. 15, no. 4, pp. 281-290, 2005. View Article
[25] Q. Chen and Z. Zhang, "Prediction of particle transport in enclosed environment," China particuology, vol. 3, no. 6, pp. 364-372, 2005. View Article
[26] Z. F. Tian, J. Y. Tu, G. Yeoh, and R. Yuen, "Numerical studies of indoor airflow and particle dispersion by large eddy simulation," Building and Environment, vol. 42, no. 10, pp. 3483-3492, 2007. View Article
[27] J. Posner, C. Buchanan, and D. Dunn-Rankin, "Measurement and prediction of indoor air flow in a model room," Energy and buildings, vol. 35, no. 5, pp. 515-526, 2003. View Article
[28] Z. Zhang and Q. Chen, "Comparison of the Eulerian and Lagrangian methods for predicting particle transport in enclosed spaces," Atmospheric environment, vol. 41, no. 25, pp. 5236-5248, 2007. View Article
[29] Q. Chen, "Comparison of different k-ε models for indoor air flow computations," Numerical Heat Transfer, Part B Fundamentals, vol. 28, no. 3, pp. 353-369, 1995. View Article
[30] W. Lu, A. T. Howarth, and A. P. Jeary, "Prediction of airflow and temperature field in a room with convective heat source," Building and Environment, vol. 32, no. 6, pp. 541-550, 1997. View Article
[31] Z. J. Zhai, Z. Zhang, W. Zhang, and Q. Y. Chen, "Evaluation of various turbulence models in predicting airflow and turbulence in enclosed environments by CFD: Part 1—Summary of prevalent turbulence models," Hvac&R Research, vol. 13, no. 6, pp. 853-870, 2007. View Article
[32] J. Srebric, V. Vukovic, G. He, and X. Yang, "CFD boundary conditions for contaminant dispersion, heat transfer and airflow simulations around human occupants in indoor environments," Building and Environment, vol. 43, no. 3, pp. 294-303, 2008. View Article
[33] Z. Zhang and Q. Chen, "Numerical analysis of particle behaviors in indoor air using Lagrangian method," in Proceedings of Roomvent, 2004.
[34] A. Li and G. Ahmadi, "Dispersion and deposition of spherical particles from point sources in a turbulent channel flow," Aerosol science and technology, vol. 16, no. 4, pp. 209-226, 1992. View Article
[35] M. R. Sippola and W. W. Nazaroff, "Particle deposition from turbulent flow: Review of published research and its applicability to ventilation ducts in commercial buildings," Lawrence Berkeley National Lab.(LBNL), Berkeley, CA (United States), 2002. View Article
[36] F. Chen, C. Simon, and A. C. Lai, "Modeling particle distribution and deposition in indoor environments with a new drift–flux model," Atmospheric Environment, vol. 40, no. 2, pp. 357-367, 2006. View Article