Journal of Fluid Flow, Heat and Mass Transfer (JFFHMT)
ISSN: 2368-6111

Volume 1, Year 2014 - Pages 57-64
DOI: 10.11159/jffhmt.2014.009
Membrane Characterization based on the Upstream Pressure Decay in a Dynamic Gas Permeation Test
N. Al-Qasas, J. Thibault, B. Kruczek
Department of Chemical and Biological Engineering, University of Ottawa, 161 Louis Pasteur, Ottawa, Ontario, Canada K1N 6N5
nevalqasas@gmail.com; bkruczek@uottawa.ca; jules.thibault@uottawa.ca
Abstract - The time-lag method is believed to be the most usable method for extracting the membrane properties via a simple dynamic permeation experiment; however this method suffers from major drawbacks that limit its use for some materials and under certain conditions. One of the major drawbacks of the time-lag method is that it relies on monitoring the pressure rise downstream from the membrane due to gas permeation, whereas the method is derived by assuming that the pressure downstream from the membrane is maintained at zero during the entire permeation experiment. To rectify this problem, it is proposed to characterize the membrane based on the pressure decay upstream from the membrane during a conventional time-lag experiment, while continuously evacuating the downstream side of the membrane. This modification allows for a better adherence to the boundary conditions on which the time-lag method relies. Right after initiation of the gas permeation experiment, the membrane behaves as a semi-infinite solid, and the rate of pressure decay is directly proportional to the square root of time. Once the permeating gases emerge downstream from the membrane, the membrane no longer behaves as a semi-infinite solid and the pressure decay becomes a non-linear function of the square root of time. In the proposed new method, the membrane properties are extracted based on the deviation of the recorded pressure decay from the semi-infinite behavior in the square root of the time domain. In this paper, we present the mathematical bases of the new method along with preliminary experimental results. Results indicate that diffusivity, solubility and permeability of nitrogen in polyphenylene oxide (PPO) membrane used in this study are very close to the literature values.
Keywords: Membrane characterization, Semi-infinite solid, Permeation experiments, Upstream measurements.
© Copyright 2014 Authors - This is an Open Access article published under the Creative Commons Attribution License terms. Unrestricted use, distribution, and reproduction in any medium are permitted, provided the original work is properly cited.
Date Received: 2013-09-26
Date Accepted: 2014-11-19
Date Published: 2014-12-18
Nomenclature
- A: Cross sectional membrane area, m2
- C: Gas concentration, mol/m3.
- D: Gas diffusivity in membrane, m2/s
- FO: Fourier number, dimensionless
- L: Thickness of membrane, m
- p: Pressure, Pa
- C0: Initial concentration, mol/m3
- x: Membrane coordinate, m
- VA: Downstream volume, m3
- po: Initial pressure, Pa
- P: Permeability, mol/m s Pa
- R: Universal gas constant, Pa m3/ mol K
- S: Solubility of membrane, mol/Pa m3
- T: Temperature, K
- Vu: Upstream volume, m3
- CL: Concentration at x = L, mol/m3
- t: Time coordinate, s
- n: Capacitance parameter
1. Introduction
There is a growing interest in membrane technologies in various industrial applications. Separation using membranes offer various advantages over other separation techniques mainly due to their simplicity in terms of design and equipment, smaller footprints and lower energy consumptions. Virtually all membranes used in industrial gas separations are made from organic polymers. Gas transport in polymeric membranes is described by the solution-diffusion mechanism in which penetrant molecules are first dissolved in the membrane and then diffuse across the membrane. Therefore, understanding the sorption and diffusion behaviour of such membranes is paramount to design membrane processes and to evaluate their efficiency. In addition to separation processes, polymeric films and membranes are used extensively in food packaging, drug delivery systems, and painting and coating applications [1]. For non-interacting systems, the permeability (P), diffusivity (D) and solubility (S) of certain gas molecules in the membrane material are constant parameters and therefore considered as a material property. They can be determined in a single dynamic gas permeation test, known as a time-lag method, which was conceived nearly a century ago by Daynes [2] . The time-lag method has been used since due to its simplicity. It relies on the temporal variation of the pressure in the downstream reservoir.
The pressure changes downstream from the membrane are directly related to the gas flux emerging from the membrane. In turn, the gas flux anywhere within the membrane is governed by Fick's first law. The thin membrane is used as a separator between two chambers with known volumes. Both volumes are initially evacuated to remove any present species; the experiment starts by applying a step pressure increase in the upstream chamber and the resulting pressure rise in the downstream chamber is then monitored as a function of time. As the permeation rate reaches steady state, an extrapolation of the linear portion of the pressure rise curve to the time coordinate yields the time lag (q). The time lag is a function of the membrane thickness and gas diffusivity in the membrane. Therefore, measuring the experimental q and knowing the membrane thickness (L) allows evaluating the diffusion coefficient in the membrane. The slope of the linear portion of the pressure rise curve is directly proportional to the permeability coefficient, and thus P can also be evaluated. Therefore, knowing P and D, the solubility S can be obtained from the ratio of P and D. In principle, the conventional time lag analysis are applicable only for the transport in rubbery polymers, in which sorption is governed by Henry's law. In glassy polymers, sorption is no longer governed by a linear isotherm, and S becomes a function of the feed pressure, which also makes D and P to be pressure-dependent. Despite the fact that the transport coefficients are no longer independent of the operating conditions, the conventional lag method is also used for the characterization of glassy membranes. Recently, Wang et al. [3] have reviewed the application of the time lag method for the analysis of gas transport in glassy membranes. The dual mode sorption did not always fit the experimental data found in literature, therefore other models like the partial immobilization model (PIM) and the dual diffusion model (DDM), were presented and fitted to experimental data. Their results showed that most experimental data lie between bounds provided by the PIM and DDM.
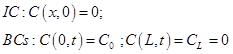
The conventional time-lag method is derived using the Fick's second law of diffusion:

The above differential equation is solved under the following boundary conditions:
If the downstream chamber were continuously evacuated during the experiment, which is required by the second boundary condition, after the time corresponding to 3θ, the gas permeation would be within 1% of the steady state value. Consequently, it is often aimed to obtain the steady state slope from the data between 3 and 4 time lags. If the data is taken too early, the deviation from the steady state permeation is too large; on the other hand, waiting too long to take the data increases the influence of the buildup in the downstream chamber. Although in a properly designed experiment, the feed pressure is much greater than the downstream pressure resulting from gas permeation, there is a systematic error that is in many cases cannot be neglected [4].
Since the conventional time-lag method relies on monitoring the rate of pressure increase in the downstream chamber, the second boundary condition is never rigorously valid. This represents the major drawback of the conventional time-lag method. Although Eq. (1) can be solved under more realistic second boundary conditions and the solutions are available in the literature [5] the corresponding expressions for the time lag become more complex and the method loses its mathematical simplicity. Despite the fact that the second boundary condition is never satisfied, it is a common practice to use the simplest form of the expression for the time lag that assumes C(L,t) = 0. Taveira et al. [6] investigated the effect of neglecting permeate pressure built up in the downstream chamber on the errors in the determined transport coefficients. The errors were correlated with the capacitance parameter, which is inversely proportional to the volume of the downstream chamber. These errors are greater or much greater than 5%, unless the capacitance parameter is less than a certain threshold, which is difficult to attain in practical systems. Therefore, they recommended designing flexible experimental set-ups that allow adding or removing calibrated volumes downstream from the membrane according to experimental needs. On the other hand, Lashkari and Kruczek [7] showed that this approach would lead to even larger errors due to non-negligible resistance to gas accumulation in high vacuum systems. At high vacuum, the transport of the gas molecules emerging from the membrane is governed by Knudsen diffusion, which implies that the measured time lag depends on the location of the pressure transducer downstream from the membrane [8]. Moreover, although the resistance to gas transport in high vacuum is inversely proportional to the internal diameter of tubing, the presence of relatively large diameter accumulation chambers recommended by Taveira et al. [6], which in themselves are resistance-free, greatly magnify the resistance effects in tubing that connects a membrane cell with the accumulation chambers (9; 7). In addition, the measurements of the time lag involves the contributions of many other system-related response times; therefore, in the case of highly diffusive and thin membranes, in which the time lag is small, the influence of system-related delays cannot be neglected [10,11,12]. On the other hand, in the case of barrier materials characterized by very low diffusion coefficients, the actual time to reach quasi-steady state might very long, which precludes application of the conventional time-lag method [13].
To overcome drawbacks of a conventional time-lag method, a new method, which relies on monitoring of the pressure decay in the upstream chamber while the downstream side of the membrane is continuously evacuated, is proposed. This approach allows to comply with the second boundary condition during the entire permeation experiment, as well as to attain the actual steady state rather than quasi steady state permeation.
2. Mathematical Description of the Method
The main objective of this proposed method is to extract the transport properties of the membrane from the upstream pressure decay data rather than downstream pressure rise data. The mathematical bases of the new method are described next.
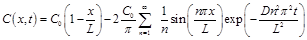
The solution of Eq. (1) subject to the initial and boundary conditions specified by Eq. (2) is given by:
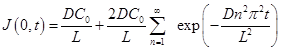
Application of Fick's first law of diffusion to Eq. (3) and evaluating the resulting expression at x = 0 allows obtaining the equation for the gas flux entering the membrane as a function of time:
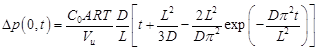
Integrating Eq. (4) over time and applying the ideal gas law leads to the expression for the pressure decay in the upstream chamber due to gas permeation into the membrane:
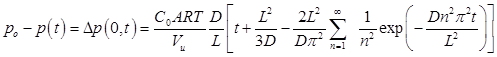
where po is the feed pressure, A is the membrane area, Vu is the upstream volume, R is the universal gas constant, and T is the absolute temperature. At relatively long times, the infinite series in Eq. (5) can be approximated by its first term and Eq. (5) simplifies to:
In
general, Eq. (6) is valid at Fourier number, Fo > 0.2, where  . On the other hand, at very short times (Fo
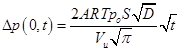
< 0.05), i.e. before gas molecules emerge from the membrane, the membrane
behaves as a semi-infinite solid and it can be shown that the pressure decay in
the upstream chamber is a linear function of the square root of time:
. On the other hand, at very short times (Fo
< 0.05), i.e. before gas molecules emerge from the membrane, the membrane
behaves as a semi-infinite solid and it can be shown that the pressure decay in
the upstream chamber is a linear function of the square root of time:
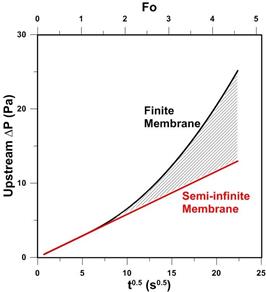
Subtracting Eq. (7) from Eq. (6) leads, after rearrangements, to the following expression:
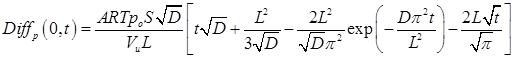
The above equation describes the deviation between the actual pressure decay due to gas permeation into a slab membrane from that which would occur if gas were permeating into a semi-infinite membrane. The deviation given by Eq. (8) is shown graphically as a function of the square root of time in Fig. 1. It can be observed that experimentally meaningful deviations between Eq. (5) and Eq. (7) occur at Fo > 1, despite the fact that at Fo ≈ 0.05 gas molecules start to emerge from the membrane. At Fo > 1, the exponential term in Eq. (8) disappears and thus it simplifies to:
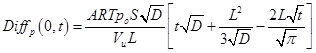
There are
two unknowns in Eq. (9), D and S. However, since Eq. (5) and
Eq. (7) coincide at early times, the term  can
be evaluated from the early linear behavior in the square root of the time
domain. Then, knowing the only unknown in Eq. (9) is
D. In other words, by plotting the experimental pressure decay versus
can
be evaluated from the early linear behavior in the square root of the time
domain. Then, knowing the only unknown in Eq. (9) is
D. In other words, by plotting the experimental pressure decay versus  and recording the deviation from the
semi-infinite pressure decay, allows solving Eq. (9) for D. Once D
is known, then S can be determined from the previously determined
and recording the deviation from the
semi-infinite pressure decay, allows solving Eq. (9) for D. Once D
is known, then S can be determined from the previously determined  Finally, knowing D and S, the permeability coefficient (P)
is simply the product of D and S.
Finally, knowing D and S, the permeability coefficient (P)
is simply the product of D and S.
It should be emphasized that once steady state permeation is attained, that is the pressure decay becomes a linear function of time; one could extract the membrane properties from the inflow time lag and the slope of the pressure decay curve in the time domain. However, because of limitations of the current experimental system, which will be discussed in the next section, this approach is not yet feasible.
3. Experimental Procedures and Results
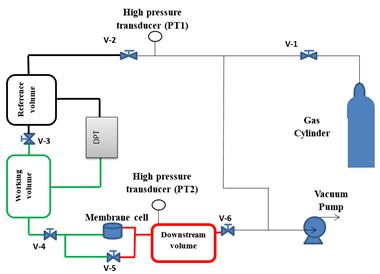
The key aspect of the new characterization method relies on the very accurate monitoring of the pressure decay resulting from gas permeation into the membrane. Since the magnitude of this pressure decay must be orders of magnitude smaller than the feed pressure, commercially available absolute pressure transducers do not have a sufficient resolution to carry out this measurement. To solve this problem, the upstream part of a constant volume system used for membrane characterization in the conventional time-lag method was modified, as described previously by Al-Ismaily et al. [13]. Figure 2 shows a schematic diagram of the experimental setup. Briefly, the upstream section is split into a working volume and a reference volume. The two volumes, which are separated by a valve, are connected to a high accuracy differential pressure transducer (DPT, MKS model 226A.2TCDCDFB2A1) with a working range from -0.2 mmHg to 0.2 mmHg (>&Plusmn;27 Pa). During the actual gas permeation experiment, the working and reference volumes are separated and the pressure decay due to gas transport from the working volume into the membrane is very accurately monitored by the DPT.
Since the gas permeation experiment should be initiated by a step increase in feed pressure from the initial high vacuum to a finite value, and at the same time the working and reference volumes should also be at the same pressure, the working volume is further split into two sub-sections by another valve. When the latter valve is closed and the valve between the working and reference volumes is opened, the desired feed pressure can be set, while the upstream part of the membrane remains under high vacuum. Ideally, once the desired feed pressure is set, the valve between the working and reference volumes should be closed, and the experiment should be initiated by opening the valve inside the working volume. However, in this scenario there would be a sudden expansion in the working volume orders of magnitude greater than the range of the DPT, which would preclude recording any pressure decay data. To solve this problem, the actual gas permeation experiment is started by first opening the valve in the working volume, while the valve between the working and reference volumes is opened, followed by immediate closing of the latter valve. Although this approach precludes recording the pressure decay in the first couple of seconds of the experiment, it allows to accurately monitoring the pressure decay afterwards [13]. Also, during the entire gas permeation experiment, the downstream section is continuously evacuated to ensure that the boundary condition, C(L,t) = 0, is satisfied.
The actual gas permeation experiments were carried out using pure nitrogen from a gas cylinder and a polyphenylene oxide (PPO) membrane of thickness L = 23.5&Micro;m. PPO is a well-known membrane material, which has been thoroughly studied in our laboratory.
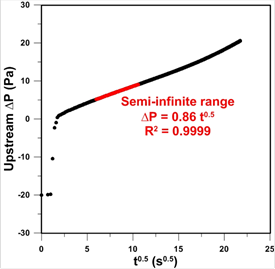
Figure 3
presents the experimentally recorded pressure decay as a function of the square
root of time from the experiment in which po = 17 kPa. To
increase the range of ΔP measurement, the zero point of the DPT
was moved to -20 Pa. A constant pressure in the first second of experiment
represents the time elapsed between pressurizing the membrane and closing the
valve between the working and the reference volumes. It can be noticed that
right after closing the valve between the two volumes, the pressure decay
rapidly increases for another couple of seconds. This rapid pressure increase
is referred to as a compression effect due to closing the valve between the two
volumes [13]. However, eventually the expected linear behavior due to gas
transport into a semi-infinite membrane is observed. The red section of the
curve was used to determine the slope, which is directly proportional to . It can also be noticed that as time increases, the pressure decay curve shows
an upward deviation from the semi-infinite behaviour as expected.
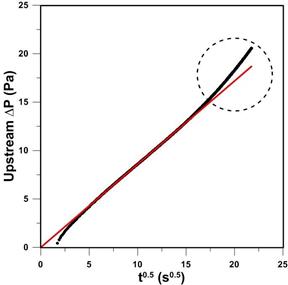
Figure 4
provides a closer look at the experimental data presented in Fig. 3, by forcing
the intercept to be equal to zero. In principle, the membrane should behave as
a semi-infinite medium right after initiation of the gas permeation experiment.
Consequently, by forcing ΔP versus through
the origin should allow correcting the pressure decay data for the compression
effect and a delay in recording ΔP. However, as seen in Fig. 4, when
extending the red linear section from Fig 3 for the entire time frame of the
experiment, it is evident the actual linear behaviour is observed only after  This
initial deviation cannot be explained by the compression effect discussed by
Al-Ismaily et al. [13]. Instead, the following explanation is proposed. When
the valve separating the working and reference volume is being closed, the gas
from the entire upstream section flows toward the membrane and, right after
closing the valve, there is a pressure imbalance in the reference volume. More
specifically, the pressure far away from the valve separating the two volumes
is slightly greater than the pressure close to the valve, where the DTP is
connected. Since the pressure in the reference volume must equilibrate, during
the time in which this equilibration occurs the pressure at the point where the
DPT is connected slightly increases, which causes artificially higher pressure
decay that is evident in Fig. 4. The fact that the pressure in the reference
volume is not instantaneously constant following the closure of the valve
between the working and the reference volumes precludes correcting the upstream
pressure decay data with absolute certainty. Consequently, the currently used
system is not suitable for the determination of the upstream time lag, which
would provide yet another alternative for the complete membrane
characterization.
This
initial deviation cannot be explained by the compression effect discussed by
Al-Ismaily et al. [13]. Instead, the following explanation is proposed. When
the valve separating the working and reference volume is being closed, the gas
from the entire upstream section flows toward the membrane and, right after
closing the valve, there is a pressure imbalance in the reference volume. More
specifically, the pressure far away from the valve separating the two volumes
is slightly greater than the pressure close to the valve, where the DTP is
connected. Since the pressure in the reference volume must equilibrate, during
the time in which this equilibration occurs the pressure at the point where the
DPT is connected slightly increases, which causes artificially higher pressure
decay that is evident in Fig. 4. The fact that the pressure in the reference
volume is not instantaneously constant following the closure of the valve
between the working and the reference volumes precludes correcting the upstream
pressure decay data with absolute certainty. Consequently, the currently used
system is not suitable for the determination of the upstream time lag, which
would provide yet another alternative for the complete membrane
characterization.
It is
important to emphasize that the method proposed in this paper does not require
correcting the upstream pressure decay data, as long as there is a sufficient
time frame during which a linear behavior, as well as a deviation from the
linear behavior, can be observed. In other words, the difference between the
two curves, as a function of >is
the same in both Fig. 3 and Fig. 4.
Using five randomly chosen points from the circled region in Fig. 4, the diffusivity coefficient was determined from the experimental difference between the two curves and the slope of the red line by solving Eq. (8). Then, knowing D and the slope of the red line, solubility S was determined. Such determined values of D and S are plotted in Figs. 5a and 5b, respectively. It is important to emphasize that differences when using Eq. (8) and Eq. (9) were negligible, which suggest the disappearance of the exponential term and thus reaching the steady state permeation.
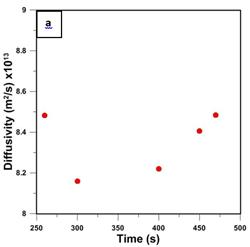
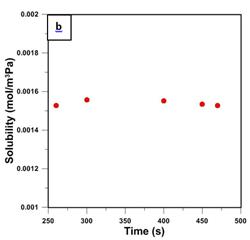
The average diffusivity and solubility coefficients based on the five data points shown in Fig. 5 are 8.34x10⁻¹³ m2/s and 1.540x10⁻³ mol/m3 Pa. These values are considerably different from the diffusivity and solubility coefficients of 4.52x10⁻¹² m2/s, and 2.74x10⁻⁴ mol/m3 that were reported by Al-Ismaily et al. [13]. Interestingly, the permeability coefficient of 1.28 x 10⁻¹⁵ mol/s m Pa, which is the product of DS, in the current investigation, is remarkably similar to the permeability coefficient reported by Al-Ismaily et al. of 1.24 x 10⁻¹⁵ mol/s m Pa [13]. The major source of error in the new method reported in this paper is the uncertainty in the actual feed pressure. Considering Eq. (9), if for a given difference between the curves po was smaller than the used value, the calculated D would increase while S would decrease. The problem with an uncertainty in the actual feed pressure can be rectified by modifying the current configuration of the upstream section of the system. The details of this modification and the corresponding results of membrane characterization will be reported in a future publication.
4. Conclusions
A mathematical basis for a new method for the characterization of gas transport in membrane has been presented. The method requires accurate monitoring of the upstream pressure decay due to gas transport into the membrane, which allows continuous evacuation of the downstream side of the membrane. The latter, allows obeying the boundary condition at the downstream face of the membrane, which is unique compared to a conventional time-lag method. In turn, the method relies on (1) monitoring the initial pressure decay that is characteristic to the transport into a semi-infinite membrane, (2) observing a clear deviation from the semi-infinite model at longer times, and (3) the analysis of the experimental pressure decay in the square root of time domain rather than linear time domain. At this point, the major challenge in the implementation of this method is an uncertainty in the actual feed pressure during a gas permeation test, which can be rectified by modification of the current experimental set up. Nevertheless, the experimentally determined permeability coefficient on N2 in a PPO membrane using the new method was remarkably similar to the value obtained previously in our lab using different characterization methods.
References
[1] G.H. Fredrickson, and E. Helfand, "Dual-Mode transport of penetrants in glassy polymers" Macromolecules, vol. 18, pp. 2201-2207, 1985. View Article
[2] H.A. Daynes, "The process of diffusion through a rubber membrane", Proc. R. London, vol. 97A, pp. 286-307, 1920. View Article
[3] L. Wang, J.-P. Corriou, Ch. Castel, and E. Favre, "Transport of gasses in glassy polymers under transient conditions: Limit-behavior investigations of dual-mode sorption theory", I&EC Research Industrial and Engineering Research, vol. 52, pp. 1089-1101, 2013. View Article
[4] R.C.L. Jenkins, P.M. Nelson, and L. Spirer, "Calculations of the transient diffusion of gas through a solid membrane in to a finite outflow volume", Transactions of the Faraday Society, vol. 66, pp. 1391-1401, 1970. View Article
[5] S.W. Rutherford, and D.D. Do, "Review of time lag permeation technique as a method for characterisation of porous media and membranes", Adsorption, vol. 3, pp. 283-312, 19997. View Article
[6] P. Taveira, A. Mendes, and C. Costa, "On the determination of diffusivity and sorption coefficients using different time-lag models", Journal of Membrane Science, vol. 221, pp. 123-133, 2003. View Article
[7] S. Lashkari, and B. Kruczek, "Effect of resistance to gas accumulation in multi-tank receivers on membrane characterization by the time lag method. Analytical approach for optimization of the receiver", Journal of Membrane Science, vol. 360, pp. 442-453, 2010. View Article
[8] B. Kruczek, H.L. Frisch, and R. Chapanian, "Analytical solution for the effective time lag of a membrane in a permeate tube collector is which Knudsen flow regime exists", Journal of Membrane Science, vol. 256, pp. 57-63, 2005. View Article
[9] S. Lashkari, B. Kruczek, and H.L. Frisch, "General solution for the time lag of a single tank receiver in the Knudsen flow regime and its implications for the receiver's configuration", Journal of Membrane Science, vol. 283, pp. 88-101, 2006. View Article
[10] X.Q. Nguyen, Z. Broz, and P. Uchytil, "Methods for the determination of transport parameters of asses in membranes", Journal of Chemical Society Faraday Trans., vol. 88, no. 24, pp. 3553-3560, 1992.
[11] X.Q. Nguyen, Z. Broz, F. Vasak, and Q.T. Nguyen, "Manometric techniques for determination of gas transport parameters. Application to the study of dense and asymmetric poly (Vinyltrimethylsilane) membranes", Journal of Membrane Science, vol. 91, pp. 65-76, 1994. View Article
[12] J.P.G. Villaluenga, and B. Seoane, "Experimental estimation of gas-transport properties of linear low - density polyethylene membranes by an integral permeation method," Journal of Applied Polymer Science, vol. 82, pp. 3013-3021, 2001. View Article
[13] M. Al-Ismaily, J.G. Wijmans, and B. Kruczek, "A shortcut method for faster determination of permeability coefficient from time lag experiments," Journal of Membrane Science, vol. 423-424, pp. 165-174, 2012. View Article