Journal of Fluid Flow, Heat and Mass Transfer (JFFHMT)
ISSN: 2368-6111

Volume 1, Year 2014 - Pages 48-56
DOI: 10.11159/jffhmt.2014.008
Thermal Accumulation in a General Car Cabin Model
C.-Y. Tseng, Y.-A. Yan, J.C. Leong*
Department of Vehicle Engineering, National Pingtung University of Science and Technology, Taiwan R.O.C.
*+886-8-770-3202 ext. 7468; cleong@mail.npust.edu.tw
Abstract - Automobile air-conditioning systems are not very efficient even for use in conjunction with internal combustion engines. This problem is more critical if they are to be used in electric vehicles because conventional systems consume a significantly more energy and therefore tremendously shortens the travel distance per charge of an electric vehicle. Besides the development of new generation air-conditioning system, one of the easier remedies is to reduce the heating effects of a cabin so that the requirement for air-conditioning can be minimized and thus its energy consumption by the system. Current work aims to identify some of the key factors that may help minimize the cooling load of an electrical vehicle. This work investigates the solar radiation effect on a 5:1 reduced scale car cabin, whose dimensions were based on the actual dimension of a Formosa Martiz. In the process of radiative heating, the temperatures in the cabin were found increase at a much higher rate in the beginning. On the other hand, the installation of window film and sun screen effectively reduced the rise in cabin temperature. Hence, their installation will significantly help saving the overall car energy and therefore extend an electric car travel distance per charge. The color of the cabin external surfaces should be carefully chosen so that these surfaces can effectively reflect the radiative heat energy. Also, the cabin ceiling should be insulated as much as possible to reduce the amount of heat conduction into the cabin space.
Keywords: Car cabin, Solar irradiation, Temperature measurement, Experiment.
© Copyright 2014 Authors - This is an Open Access article published under the Creative Commons Attribution License terms. Unrestricted use, distribution, and reproduction in any medium are permitted, provided the original work is properly cited.
Date Received: 2013-08-23
Date Accepted: 2014-05-09
Date Published: 2014-11-04
1. Introduction
In general, a reliable car is expected to be driven for at least 300 miles (482 km) before another easy and quick refueling. Not only so, the vehicle has to be capable of keeping up with the flow of traffic. Since their first debut in the 18 century, all gasoline cars have been improved and have become an asset every modern family must own. Unfortunately, the extensive use of these vehicles has brought forth a tremendous change in lifestyle to the world population in terms of both convenience and tragedy. Despite the mobility the gasoline vehicles offers their users, their smoke and pollutant emission have greatly polluted the environment and is believed to be one of the culprits leading to recent dramatic change in climate. To remedy this, the use of fossil fuel has to be minimized if not entirely eliminated.
For this reason, electric cars have lately been given a lot of attention because they, unlike gasoline cars, produce almost no pollution. Unfortunately, an average electric car can only travel up to 100 miles (161 km) on a single electric charge. Even so, it has been reported that Toyota RAV4 EV can travel at most 125 miles per charge. In 2008, Simon Hackett and Emilis Prelgauskas even drove a Tesla Roadster and had completed 313 miles (501 km) on a single charge in the 10th annual Global Green Challenge. This achievement has set a new record for the production of electric vehicle [1].
Since the automobile air-conditioning system consumes a lot of power, the activation of automobile air-conditioning system in any electric vehicle can greatly jeopardize the mileage per charge of the electric car [2]. Regardless of how soon a highly efficient air-conditioning system is developed for the electrical vehicle, it is always a good practice to minimize the dependence of the electric car users on air-conditioning system. When there is less need for air-conditioning system, a better mileage per charge for the electric vehicle can be achieved.
Fujita et. al. [3] have developed a numerical simulation to predict the thermal environment of a simplified car cabin model under different air-conditioning conditions. Their analysis took into consideration of the effect of solar thermal irradiation, the heat conduction among the car materials, the ventilation inside the instrument panel, and the air leaks that take place through the gaps of the interior parts. At the same year, Kataoka and Nakamura [4] have investigated the variation of cabin air temperature under prescribed cooling cycle condition and solar thermal irradiation on the wall to consider the transient and actual driving conditions. Through experimental means, Martinho et al. [5] have studied the thermal comfort in a multi- purpose vehicle (MPV) cabin through the equivalent temperature index. On the other hand, Song et. al. [6] have introduced the mathematical model of air flow in cabin dealing with complex boundary condition as well as the computational domains corresponding to the air and solid component of the car.
Rosendahl and Olesen [7] have presented the different results about the thermal environment inside a vehicle for different air temperatures, operative temperatures, and equivalent temperatures. The tests were carried out in the winter season during the heat-up process of the car cabin. Based on the measurements, the time used to reach the level of thermal comfort was evaluated. Kilic and Sevilgen [8] have collected the velocity and temperature measurements in a car cabin during a heating period. At the same time, Korukcu and Kilic [9] have used an infrared thermal camera to determine the variation of the instantaneous temperature distributions of all surfaces inside a car cabin and to identify the sources of thermal discomfort. Yang et al. [10] have built a transparent acrylic car cabin model almost half the size of a real car. They have measured the airflow characteristics at 18 different regions in a car cabin using the PIV technique. In conjunction with climatic data collected in Athens, GA from April through August 2007, Grundstein et al. [11] reported that the average highest cabin temperatures on clear days were 68°C in the summer and 61°C in the spring, but were on average approximately 10°C cooler on cloudy days during the spring and summer.
Zhu et al. [12] have numerically and experimentally examined the environmental conditions in public transportation buses. Their CFD model was used to calculate the distributions of the mean age and mean residual lifetime of air and to evaluate the ventilation system efficiency. Their work also experimentally collected and analyzed the indoor environmental quality in a Harvard University shuttle bus. At the same year, Al-Kayiem et al. [13] have published their experimental and numerical results. Their subject was a salon car parked in an open space exposed to the direct sun. The six scenario investigated include a full windows closing case, four different windows opening settings and sun shade usage case. The temperatures at 12 different locations inside the car have been recorded for many days. They concluded that the use of sunshade and/or dropdown side windows effectively reduce the heat accumulation within the cabin. Most recently, Kamar et al. [14] have measured the cabin temperatures under road test using T-type thermocouples to validate their prediction of automotive air-conditioning system performance. Sevilgen and Kilic [15] performed a 3D numerical analysis of steady-state and transient temperature distribution in the car cabin. Their computational results were compared to and validated by experimental measurements.
Since the usage of conventional automobile air-conditioning systems are highly inefficient for electric vehicles, the authors deeply feel that, while new generation vehicle air-conditioning system may take a much longer time to develop, a quick and simple yet practical approach is to reduce the total amount heat entering the cabin of an electric vehicle. This motivates current work whose objective is to study the increase in cabin temperature under the influence of prolonged solar irradiation. Understanding how these important factors influence the cabin temperature will be beneficial in improving electric car mileage per charge through passive thermal design and daily practice of electric vehicle users.
2. Experiment
2.1. Car Cabin Model
A 5:1 reduced scale experimental cabin model has been built based on the actual measurement of a Formosa Martiz. For simplicity, the front and rear compartments of the car model have been neglected. However, the dashboard and four seats have been included for the completion of investigation. Fig. 1 shows the actual model after assembly.
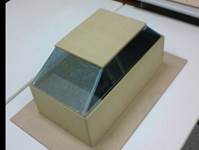
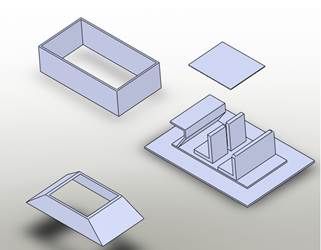
The model has a dimension of 50 cm (length) x 24.4 cm (width) x 14.4 cm (height). The projection height of the glass is 9 cm. The front and rear tilted angles are 35° and 45°, respectively. The glass composing the side windows were accurately calculated through Solidworks, a 3D CAD design software. These four pieces of glasses were adhered to each other with Silicone adhesive. The interior of the cabin model consists of a dashboard and four seats. The dashboard and side panels were all made of wood because it has been reported that the heat exchange between the car body and the car interior was very limited according to unpublished experimental data [16]. For this same reason, the engine and rear compartments of the model were neglected as well. The arrangement of these accessories is shown in Fig. 2.
2.2. Data Acquisition System
Other than the environment temperature, the temperature variations at 19 locations in the cabin have been traced and recorded using K-Type thermocouples and a data logger (FLUKE 2640A).
This data logger is capable of simultaneously recording 20 temperature readings through its channels. Its temperature readings have a precision of 0.1°C. Some of these locations where thermocouples are attached include the cabin ceiling, the dashboard, the front and rear windscreens, the side window, the front and backseats, the front and rear legrooms, the center of the cabin space, etc.
2.3. Apparatus Arrangement
To simulate the solar thermal irradiation, a 350W infrared light source was used. It was fixed at a given distance d away from the cabin model illuminating at a given elevation angle . This angle is measured from a horizontal planar datum, as shown in Fig. 3.
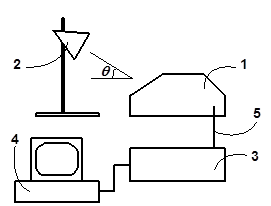
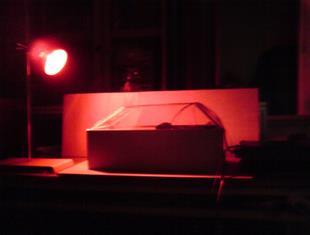
The same figure also displays the experimental setup of current work. This experiment as performed in a dark room so that the effect of ambient thermal irradiation can be minimized. Fig. 4 shows a snapshot of current experiment.
The simulated solar flux q in this experiment can be estimated as

where h is the efficiency of the infrared light bulb (which normally varies between 0.90 and 0.95), P is the power of the light source, and d is the distance between the light source and the car cabin. As a matter of fact, the exact value of d should vary from point to point depending on where the light hits the surface of the car cabin. In general, this distance was fixed at 30 cm in current work. Based on the above values, the simulated solar flux q was roughly 278 W/m2. Since the distance between the light source and the car model was control within 0.5 cm, the error of the simular solar flux was 9 W/m2. Since the car cabin in this work is a reduced model by 5:1, the solar flux employed here is equivalent to a solar flux of approximately (1390±45) W/m2. This value is comparable to a sunny condition where the solar flux is about 1357 W/m2 [17].
3. Results and Discussions
3.1. Effects of Irradiation Shielding
3.1.1. Tinted Glass
Figs. 5 compare the temperature variation at different locations associated to the car cabin model. The blue and red lines correspond to the case whose glasses are tinted or not by window film installation, respectively.
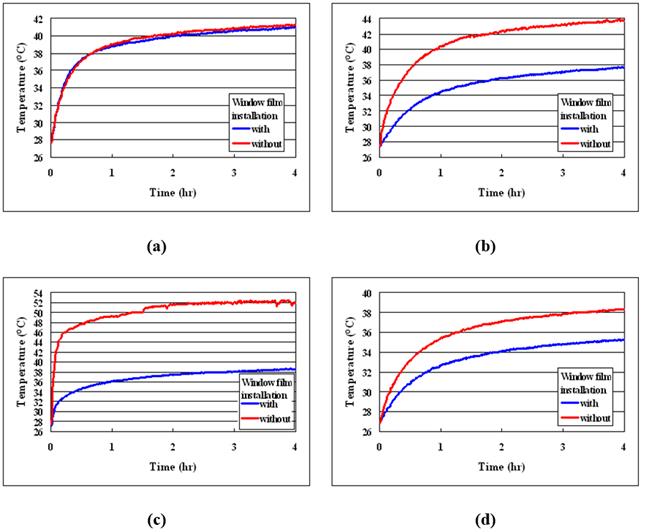
It was found that except for the front windscreen (as in Fig. 5(a)), the increase in temperature inside the cabin could be significantly reduced if the glasses were tinted. However, it can be discovered that the temperature at the front windscreen increased sharply within 20 minutes after the beginning of radiative heating process. After approximately 1 hour, temperature increased at a much slower rate continuously. At the dashboard, the rate of temperature increase was apparently different right at the beginning of the heating process, as shown in Fig. 5(b). After approximately 1 hour, the rate of temperature became constant. The drop in temperature variation during the heating process was the most significant at the front seat bottom. In this study, the seats were made of wood but completely covered by a layer of black synthetic leather. In this case, although the ray from the infrared light source was directed towards the front seat back, the light was partially blocked by the ceiling causing the temperature of the front seat bottom to be much higher than that of the front seat back. Because of the tinted glass, the front seat bottom temperature dropped tremendously. As shown in Fig. 5(d), the temperature on the front seat back surface demonstrated a trend very similar to that on the dashboard. This phenomenon is very much different from that at the front seat bottom because the infrared beam had not directly shined on the front seat back.
Combining all the temperature variation in Fig. 5, if the glass was not tinted, the temperature at the front seat bottom was consistently the highest, followed by the front windscreen, the dashboard, and the front seat back. This finding contradicts to the fact reported in the literature, which indicates that the temperature of the dashboard is the highest. It is remarkable to point out that the dashboard in this study was purposely made of wood. This study proves that the raise in actual dashboard temperature is in a great extent related to the dashboard material. If the glass was tinted, the temperature on the front windscreen remained the highest followed by the dashboard, the front seat bottom, and the front seat back.
Also discovered is that the window film installation made the greatest difference in the beginning of the heating process because the rate of heat accumulation within the cabin was greatly reduced in the first hour. After a certain period of time, the rates of temperature increased with and without the installation of window film appeared to be the same.
3.1.2. Others
The effects of the installation of either window film or sun screen are compared and shown in Fig. 6.
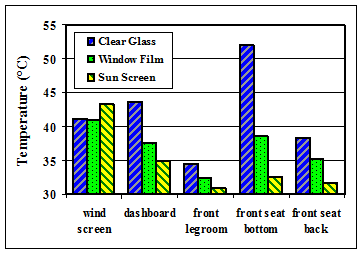
It shows the temperatures at 5 locations in the cabin under a consistent radiative heating through the infrared light source for 2 hours. Apparently, in a cabin with clear glass, the temperature on the front seat bottom was the highest while that at the front legroom was the lowest. Obviously, the installation of these devices effectively helps keeping the cabin cooler. Between these two devices, the effect of using sun screen obviously seems to overcome that of using window film except at the front windscreen. The temperature at the windscreen demonstrates a completely opposite trend under the effect of these devices. As a matter of fact, the front windscreen is the hottest among the three scenarios. In this work, the window film was pasted on the glass while the sun screen was placed inside the cabin immediately below the front windscreen. Since the temperatures in the cabin were the coolest when sun screen was installed, the placement of the sun screen had no doubt blocked the radiative heat from entering the cabin. However, the sun screen reflected the heat back to the front windscreen at the same time and eventually providing more heat to the front windscreen. Hence, the placement of the sun screen beneath the front windscreen caused a two stage heating process on the front windscreen.
3.2. Effects of Sun Position
3.2.1 Elevation Angle
Fig. 7 proves that the solar elevation angle has a crucial influence on the temperature variations within the cabin.
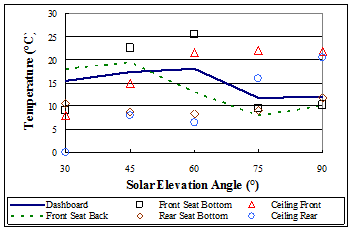
In this case, the car was assumed to park in such a way that its windscreen was perfectly aligned in the direction facing the sun. At relatively small sun elevation angles (i.e., q ≤ 30°), solar thermal radiation penetrated the front windscreen and reached the front facing surfaces, such as the dashboard, the front seat bottom, and the front seat back. Among them, the highest temperature was found on the front seat back. This is because this almost vertical surface was at an orientation which was associated to the greatest value for view factor over other surface orientations. As the solar elevation angle continued to increase (i.e., q = 45°), the temperature readings on almost all the surfaces increased because the amount of radiative heat reflected from the front windscreen decreased and therefore more heat was transmitted through the front windscreen. It was found that the increase in temperature was much greater at the front seat bottom than the front seat back. When the solar elevation angle was further increased to 60°, the temperature on the front seat bottom increased accordingly. However, the temperature on the front seat back actually dropped tremendously as it hided in the shadow of the cabin ceiling. At large solar elevation angles (i.e., ≥ 60°), it follows that the temperatures at the dashboard and the front seats dropped because the presence of the ceiling had blocked the solar irradiation. Also, the ceiling temperature was higher at the front part than the rear part. In fact, this phenomenon is not supposed to happen in actual case because the infrared light source in current study is comparatively small. Therefore, the infrared source is unable to provide a parallel beam of light. In contrary, the irradiation from sun can be assumed parallel because not only does the sun is much large in size than the Earth but also it is very far away from us. On the other hand, the temperature at the front portion of the ceiling remained unchanged while that at its rear portion increased continuously.
3.2.2. Car Orientation
If the solar irradiation shines upon the cabin from the side instead of the front, it is found that the variation of temperature increase within the cabin space changed dramatically, as clearly depicted in Fig. 8.
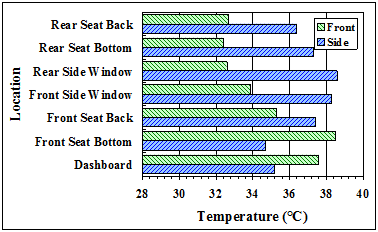
As expected, the dashboard and front seat temperatures increased the most when the car was facing the sun. In contrast, the temperatures recorded on the surfaces at the rear portion of the cabin were clearly among the lowest. Also discovered was that the front side window was warmer than the rear side window. Again, this phenomenon is less likely to happen in real situation because the irradiation from the sun is generally parallel and thus provides relatively identical radiative heating condition for both the front and rear side windows. Besides, the front seats were consistently hotter than the rear seats for the same reason aforementioned. However, if the infrared light source shined upon the car cabin on the side, the temperatures at the front windscreen and front seat bottom actually dropped significantly. At the same time, the temperatures at both the front seat back and the entire backseat actually increased. Generally, the amount of temperature increase on the cabin accessories was clearly greater than the amount dropped particularly at the dashboard and the front seat bottom. This implies that there was an increase amount of heat radiated into the cabin simply because of the increase in window glass area that allowed more thermal radiation to enter the cabin.
3.3. Effects of Exterior Color
The color of the car cabin exterior was also investigated in this work. The external surface of the cabin model was painted in either metallic blue or metallic silver. The light source was placed in a way such that the radiative heat from the light entered the cabin space through the side windows. The temperatures recorded at 7 different locations after 4 hours of radiative heating are shown in Fig. 9.
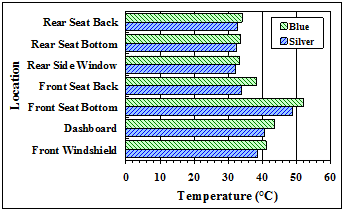
Because the light shined from the side, the temperature at the dashboard was no longer the highest. Instead, the temperature at the front seat bottom was greater than that at the dashboard regardless of the color of the cabin exterior. When the cabin exterior was painted with different colors, the temperature readings have provided a strong evident that the cabin with silver exterior is cooler than the cabin with blue exterior. This is because the solar reflectivities for silver and slate blue surfaces are 0.60 and 0.27, respectively [21] and the silver exterior is therefore capable of reflecting more radiative heat energy away from the cabin side panels and therefore allowing less heat energy to enter the cabin space through heat conduction mechanism. It was surprising to find that even the glasses portion of the cabin benefit from replacing the blue exterior with silver exterior. This finding somewhat suggests that, other than the solar irradiation, the temperature differences within the cabin also contribute to the raise in temperature for the accessories in the cabin. In other words, thermal convection drives an effective mechanism for heat transport from the lower portion of the cabin to the upper portion. Based on the observation obtained here, it is suggested that the appropriate color of electric car should be chosen so that its thermal reflectivity can be maintained at a high level. This will evidently improve the thermal comfort in the electric car cabin.
3.4. Effects of Roof Materials
The effect of the thermal properties of the car body has also been investigated, particularly the roof of the car cabin. The roofs of the cabin model were made of either a steel plate or a wooden plate. The thermal diffusivity of stainless steel is about 3.4x10⁻⁶ m2/s to 12x10-6 m2/s depending on the grade of the steel [18-19] while that of wood is roughly 0.161x10⁻⁶ m2/s [20]. This property signifies the ability of a material to conduct thermal energy relative to its ability to store thermal energy. Clearly, the steel roof transfers more heat into the cabin while the wood roof tends to store more heat within the material. Not only do their thermal diffusivity different, their surface properties directly related to thermal radiation are also apparently distinctive and too complicated to quantify. On the other hand, the thermal conductivity of stainless steel is about 16-24 W/mK while that of wood is roughly 0.1-0.4 W/mK depending on the water content in the wood. The thicknesses of the steel and wooden roofs are 1.2 mm and 6 mm, respectively. Therefore, the thermal resistances for both the steel and wooden roofs are 5x10⁻⁵-7.5x10⁻⁵ m2K/W and 1.5x10⁻²-6x10⁻² m2K/W, respectively. Based on these figures, it is found that the thermal resistance of the wooden roof is at least 200 times greater than that of a steel roof. Fig. 10 shows the temperature of various locations in the cabin model after a 1.5-hour radiative heating period.
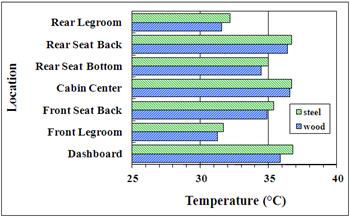
Since the light source was placed 30 cm away from the model and an elevation angle of 30°. Based on measurement, the temperatures at the steel and wooden roofs are 38.4°C and 42.1°C, respectively. Under this setting, the roof of the model absorbed a great deal of the radiative heat energy from the light source. As a result, the roof serves as another heat source transferring heat energy into the cabin through heat conduction mode. Current experimental measurements suggested that the cabin with a wooden roof was generally about 5°C cooler than that with a stainless steel roof despite the fact that the top surface of the wooden roof is generally about 5°C hotter than the stainless steel one.
4. Conclusions
Based on the experimental findings of this work, several important conclusions can be made to assist the improvement of future electric car designs. These findings suggest that electric car windows should at least be tinted whenever possible. Furthermore, the external surface of the cabin should be painted appropriately to keep the cabin interior temperature a few degrees Celsius lower. On the other hand, the solar elevation angle plays an important role in the heating process of the car cabin. The locations in the cabin absorbing the most thermal radiation depend on the time of a day during the solar irradiative heating process. Not only so, because of its greater transparent glass area, the irradiative thermal energy entering the cabin space through the side windows is greater than that through the front windshield. Radiative heat from the sun would enter the cabin space through conduction via the cabin roof. Current experimental results confirm that the cabin ceiling insulation significantly helps reducing the overall cabin air temperature.
Acknowledgements
The financial support of this work by the National Science Council of Taiwan under contract number NSC 97-3114-E-020-001- was greatly appreciated.
References
[1] E. Prelgauskas, "New EV Range World Record Set," [Online]. Available: http://www.ev.com/tag/emilis-prelgauskas, Accessed on Sept. 9, 2012. View Site
[2] R. Farrington , J. Rugh, "Impact of vehicle air-conditioning on fuel economy, tailpipe emissions, and electric vehicle range," Earth Technologies Forum, Washington D.C., USA: 2000. View Article
[3] A. Fujita , J.-I. Kanemaru, H. Nakagawa, Y. Ozeki, "Numerical simulation method to predict the thermal environment inside a car cabin," JSAE Review, vol. 22, pp. 39-47, 2001. View Article
[4] T. Kataoka , Y. Nakamura, "Prediction of thermal sensation based on simulation of temperature distribution in a vehicle cabin," Heat Transfer-Asian Research, vol. 30, pp. 195-212, 2001. View Article
[5] N.A.G. Martinho , M.C.G. Silva, J.A.E. Ramos, "Evaluation of Thermal Comfort in a Vehicle Cabin," Proceedings of the Institution of Mechanical Engineers, Part D: Journal of Automobile Engineering, vol. 218, pp. 159-166, 2004. View Article
[6] S.-H. Song , C. Yang, X.-L. Gou, "Simulation of air-flow and temperature field in air-conditional automobile cabin," Computer Simulation, 2004-09, 2004. View Article
[7] J. Rosendahl B.W. Olesen, "Comparison of temperature measurement methods for evaluation of the thermal environment in vehicles," International Journal of Vehicle Design, vol. 42, pp. 22-34, 2006. View Article
[8] M. Kilic, G. Sevilgen, "Evaluation of heat transfer characteristics in an automobile cabin with a virtual manikin during heating period," Numerical Heat Transfer, Part A: Applications, vol. 56, pp. 515-539, 2009. View Article
[9] M.O. Korukcu, M. Kilic, "The usage of IR thermography for the temperature measurements inside an automobile cabin," International Communications in Heat and Mass Transfer, vol. 36, pp. 872-877, 2009. View Article
[10] J.H. Yang, S. Kato, H. Nagano, "Measurement of airflow of air-conditioning in a car with PIV," Journal of Visualization, vol. 12, pp. 119-130, 2009. View Article
[11] A. Grundstein, V. Meentemeyer, J. Dowd, "Maximum vehicle cabin temperatures under different meteorological conditions," International Journal of Biometeorology, vol. 53, no. 3, pp 255-261, 2009. View Article
[12] S. Zhu, P. Demokritou, J. Spengler, "Experimental and numerical investigation of micro-environmental conditions in public transportation buses," Building and Environment, col. 45, pp. 2077-2088, 2010. View Article
[13] H.H. Al-Kayiem, M.F. Sidik, M.F., Y.R.A.L. Munusammy, "Study on the thermal accumulation and distribution inside a parked car cabin," American Journal of Applied Sciences, vol. 7, pp. 784-789, 2010. View Article
[14] H.M. Kamar, M.Y. Senawi, N. Kamsah, "Computerized simulation of automotive air-conditioning system: development of mathematical model and its validation," International Journal of Computer Science Issues, vol. 9, pp. 23-34, 2012. View Article
[15] G. Sevilgen, M. Kilic, "Three dimensional numerical analysis of temperature distribution in an automobile cabin," Thermal Science, vol. 16, pp. 321-326, 2012. View Article
[16] A. Alexandrov, V. Kudriavtsev, M. Reggio, "Analysis of Flow Patterns and Heat Transfer in Generic Passenger Car Mini-Environment," 9th Annual Conference of the CFD Society of Canada, pp. 27-29, 2001. View Article
[17] E.V.P. Smith, and D.M. Gottlieb, "Solar flux and its variations," Space Science Reviews, vol. 16, pp. 771-802, 1974.View Article
[18] J.E. Jensen, W.A. Tuttle, R.B. Stewart, H. Brechna, and A.G. Prodell, Selected Cryogenic Data Notebook, Brookhaven National Laboratory Associated Universities, Inc., 1980. View Book
[19] S.V. Stankus, I.V. Savchenko, A.V. Baginskii, O.I. Verba, A.M. Prokop'ev, and R.A. Khairulin, "Thermal conductivity and thermal diffusivity coefficients of 12Kh18N10T stainless steel in a wide temperature range," High Temperature, vol. 46, no. 5, pp 731-733, 2008. View Article
[20] R. Bergman, Z. Cai, C.G. Carll, C.A. Clausen, M.A. Dietenberger, R.H. Falk, C.R. Frihart, S.V. Glass, C.G. Hunt, R.E. Ibach, D.E. Kretschmann, D.R. Rammer, and R.J. Ross, Wood Handbook, Wood as an Engineering Material, Forest Products Laboratory, General Technical Report FPL-GTR-190, 2010. View Book
[21] Color Specifications, Metal Panel Systems, Inc [Online]. Available: http://www.metalpanelsystems.com/colorspecs01.htm, Accessed on: Feb. 1, 2014.