Journal of Fluid Flow, Heat and Mass Transfer (JFFHMT)
ISSN: 2368-6111

Volume 4 - Year 2017 - Pages 19-34
DOI: 10.11159/jffhmt.2017.003
Numerical Simulation of Full Scale Upper Plenum Test Facility Experiments
Thomas Höhne1, Deendarlianto2
1Helmholtz-Zentrum Dresden-Rossendorf (HZDR), Institute of Fluid Dynamics
P.O.Box 510119, D-01314 Dresden, Germany
T.hoehne@hzdr.de
2Department of Mechanical & Industrial Engineering, Faculty of Engineering, Gadjah Mada
University Jalan Grafika, No.2 Yogyakarta 55281, Indonesia
Abstract - Scaling of flow conditions are one of the still open topics for the use of Computational Fluid Dynamics (CFD) codes in nuclear reactor safety. For safety relevant flow phenomena of Konvoi type nuclear reactors it is recommended to use full scale tests for code validation. Experiments of the Upper Plenum Test Facility (UPTF) are predestined since they are 1:1 scaled tests. Therefore, three UPTF test series were selected and CFD post-test calculations were performed. The major focus was analysing the qualitative flow behaviour. In the case of the CFD calculation the stratification in the cold leg is accurately predicted by the code. The calculated lowest temperatures are in the range of the experiment. The flow behaviour in the downcomer is well predicted apart from some spurious circumferential oscillations. The two phase CFD calculation is in good agreement with the experimental data. It indicates that CFD is also a promising approach for analyzing multiphase problems in the nuclear reactor safety analysis. In addition, a full scale model with all details of the UPTF test facility was developed. The detailed numerical grid model can be used for further test analysis.
Keywords: CFD, horizontal flow, UPTF, PWR, AIAD, single phase flow, two-phase flow
© Copyright 2017 Authors - This is an Open Access article published under the Creative Commons Attribution License terms Creative Commons Attribution License terms. Unrestricted use, distribution, and reproduction in any medium are permitted, provided the original work is properly cited.
Date Received: 2017-04-13
Date Accepted: 2017-09-26
Date Published: 2017-12-01
1. Introduction
The use of three-dimensional CFD may improve the prediction of pressurized thermal shocks, coolant mixing, and thermal striping with the required accuracy and spatial resolution.
Today CFD codes have reached the level of maturity (at least for single-phase applications) to be used in nuclear reactor safety applications.
The development, verification and validation of CFD codes requires further work on the complex physical modelling processes involved, and on the development of resourceful numerical schemes.
In order to validate the CFD Code ANSYS CFX for reactor safety relevant flow phenomena it is essential to use the full scale UPTF experiments. All other separate effect test rigs and test facilities like ROCOM [1] are scaled. Scaling parameters of flow conditions are one of the still open topics for the use of CFD codes in nuclear reactor safety. Three UPTF tests were selected and post-test calculation were performed. The major focus was analyzing the qualitative flow behavior.
2. The Test Facility UPTF
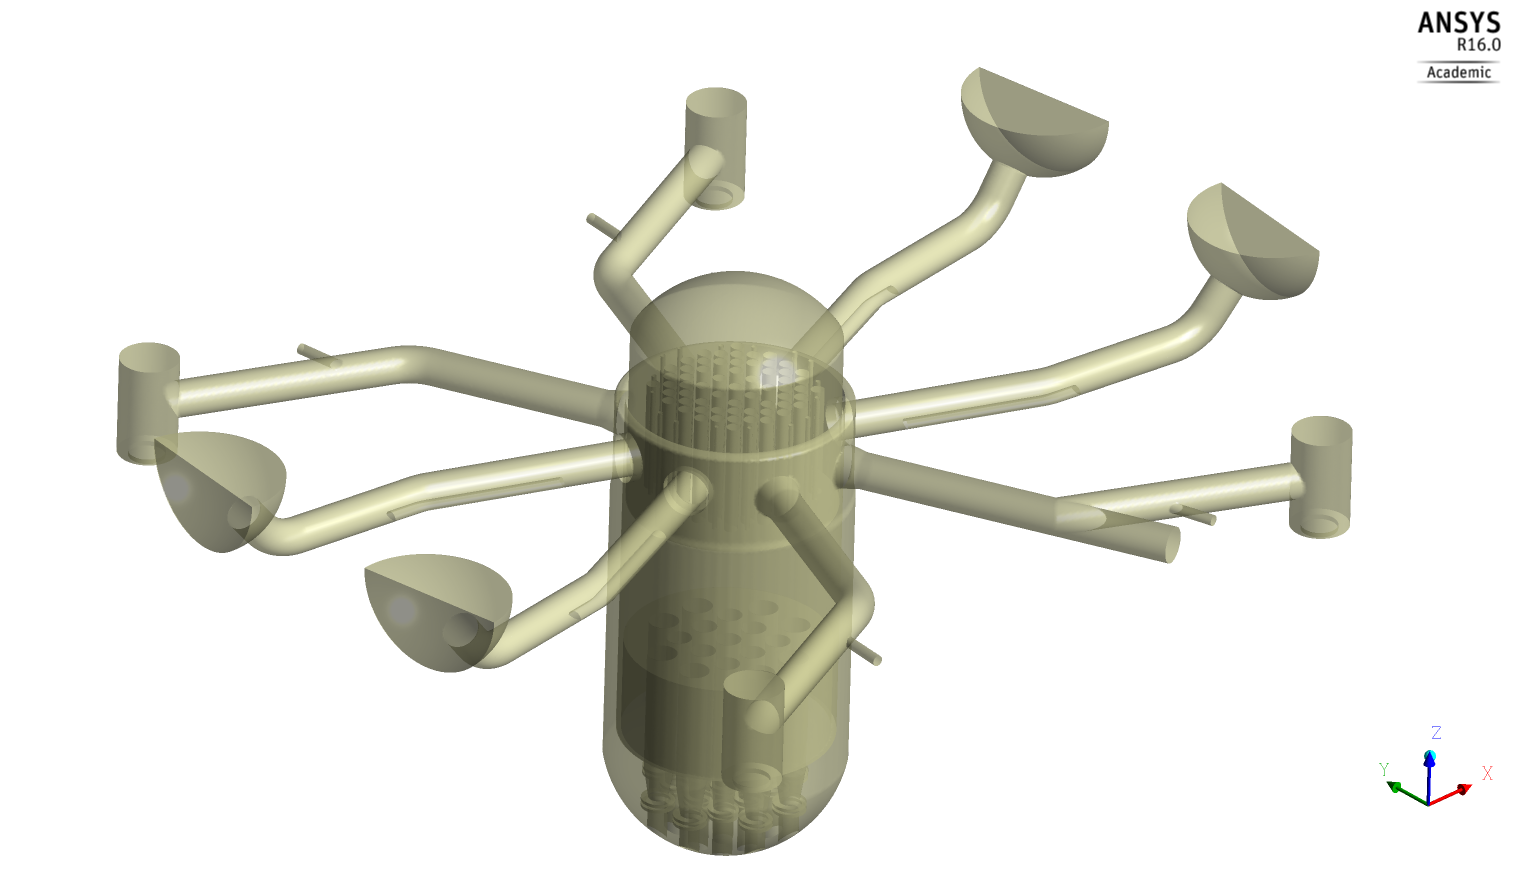
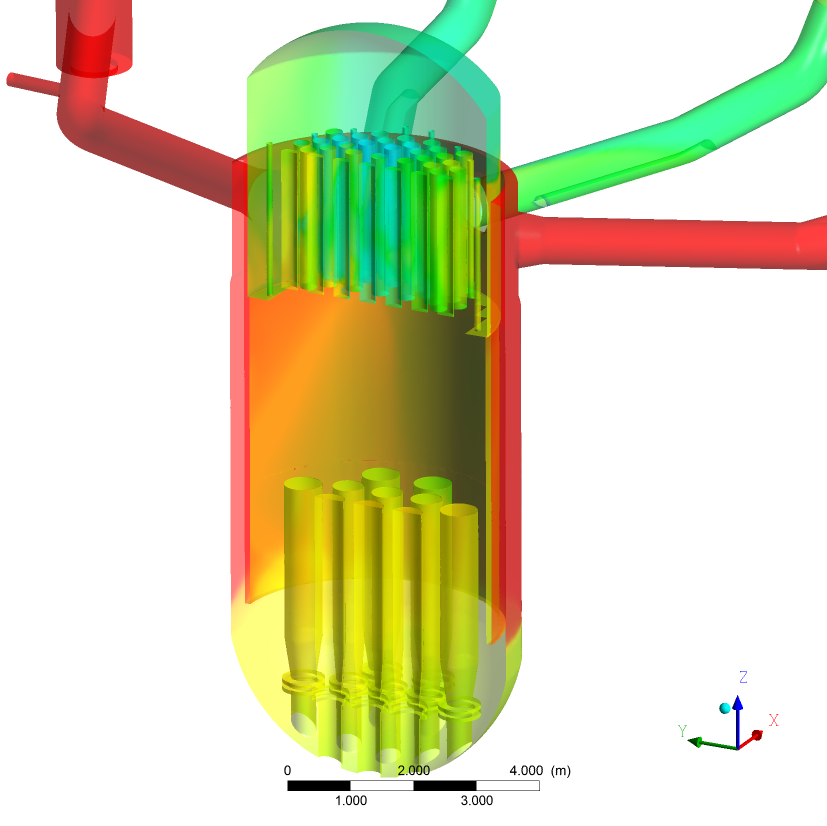
The UPTF was a full-scale model of the primary system of the four loop 1300MWe Siemens/KWU Pressurized Water Reactor (PWR) at Grafenrheinfeld in Germany (Figs. 1). The test vessel upper plenum internals, the downcomer, and the primary coolant piping were simulated accurately (Fig. 1). However, other significant components of the PWR such as the coolant pumps, the core, the steam generator, and the containment were replaced by simulators which imitate the thermal-hydraulic behavior in these components during large break Loss-Of-Coolant Accident (LOCA) scenarios. Both hot leg and cold leg breaks of various sizes have been modelled and experiments were taken out. The Emergency Core Cooling (ECC) injection systems of the UPTF were designed to simulate the numerous ECC systems of PWRs in Germany, USA, and Japan. A detailed explanation of the test facility is given by Umminger [2].
3. UPTF Test I
Buoyancy-driven stratification due to density differences between the coolant and the primary loop inventory can play an important role during loss-of-coolant accidents in nuclear power plants. The injection of moderately cold Emergency Core Cooling (ECC) water may induce such stratification. This stratification can cause high temperature gradients and bigger thermal stresses of the Reactor Pressure Vessel (RPV) wall. A severe hazard to the life span of a RPV is the occurrence of this Pressurized Thermal Shock (PTS) phenomenon during an ECC injection in a LOCA. Moreover, in case of unintentional injection of ECC water with low boron concentration, a boron dilution transient could be started.
The postulation of a homogeneous distribution (i.e. ideal mixing) of the injected ECC water at the core inlet of PWR does not yield conservative results [3].There are for example numerous postulated accident scenarios in which the reactor core would persist undamaged or may not even reach criticality under the assumption of ideal mixing, whereas incomplete mixing would result in fuel rod failures.
In reality, partial mixing occurs, and the detailed mixing pattern at the core inlet is required to make precise and realistic predictions. This mixing pattern is the result of complex three-dimensional fluid flow in the primary loop. Recent progress in computer hardware and numerical techniques has made it feasible to predict the mixing behavior using CFD codes, see for instance the contributions by Höhne [4]. Nevertheless, as CFD codes contain empirical models (for example turbulence models) it is essential to validate the numerical results using experimental data. This is especially important in case of safety-relevant coolant mixing phenomena.
There are several experiment facilities to study the mixing of cold ECC water injected into the cold leg of a PWR, see [1]. In order to examine coolant mixing in the RPV of a German-type PWR, the 1:1 scaled UPTF was used in the current work for the code validation.
The UPTF Test I was done in order to investigate fluid-fluid mixing in the cold leg and downcomer during a small break LOCA. This fluid-fluid mixing results from the high pressure injection of the cold ECC water into the cold leg at a time when the reactor coolant system is at higher temperature. This mixing relates to the reactor safety problem of PTS.
In general, if the mixing is sufficient, a slow cool-down occurs which provides enough time to prevent significant temperature gradients in the wall of the RPV. Good mixing occurs when there is a significant flow in the loops, even when the flow results only from natural circulation. However, in certain small break loss of coolant accident (SBLOCA) scenarios, it is possible that stagnant flow conditions arise in one or more loops. For this condition, the flow in the cold leg is thermally stratified. Specifically, the ECC injection results in a cold stream, which flows along the bottom of the cold leg from the injection nozzle to the downcomer, whereas a hot stream flows along the top of the cold leg counter current to the cold stream. This situation is considered in UPTF Test I.
For UPTF Test I, the primary system was at first filled with stagnant hot water at 463 K (190°C). No coolant circulation was initiated. The cold ECC water was injected into a single cold leg. The ECC water injection mass flow rate was equal to 40 kg/s and the temperature of this ECC water was 300 K (27°C). Unfortunately, no detailed measurement data were available. Therefore only a qualitative comparison of the flow behavior and temperature distribution of the experiment [5] and the CFD calculation was performed.
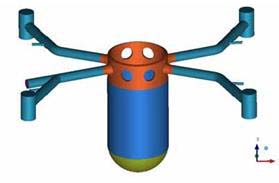
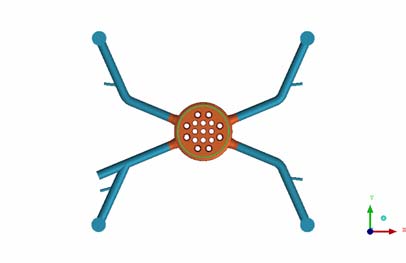
3.1. Geometry and Problem Statement Test I
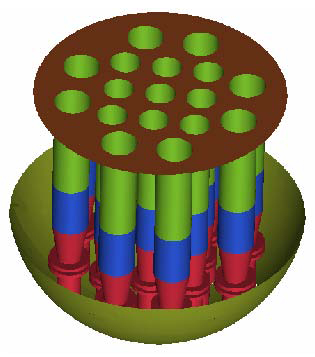
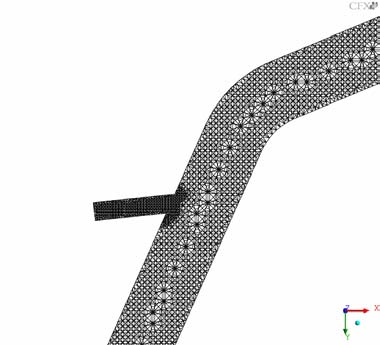
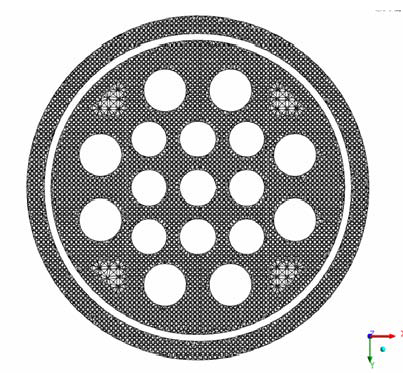
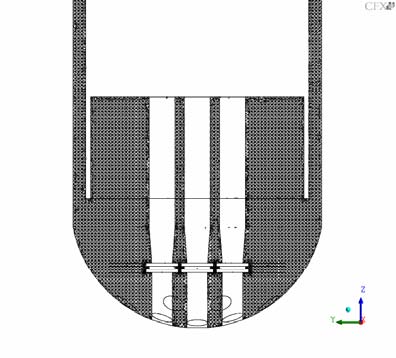
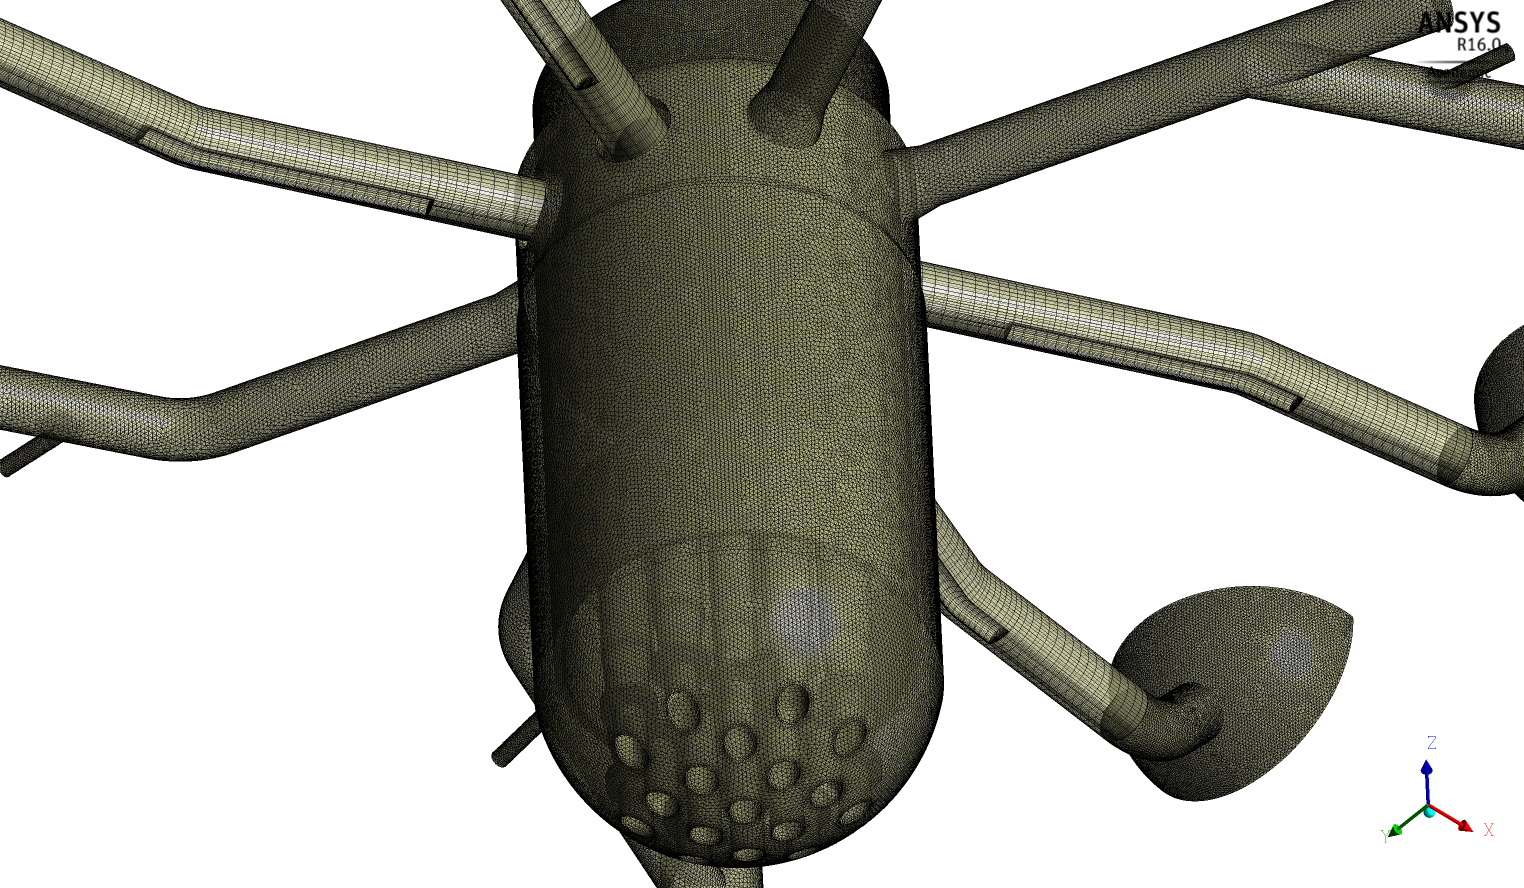
The CAD geometry was generated with ICEM-CFD [6] (Figs. 2 -4). Local mesh refinement at the ECC injection line and around the steam support tubes was done (Fig 5). The grid contains 4.3 Million elements and 0.8 Million nodes. It purely consists of tetrahedral elements. Lower plenum structures (steam support tubes) were included in the model (Figs. 6 and 7). All four loops including the broken leg and the four pump simulators were modelled.
The calculation was performed with the commercial CFD code ANSYS-CFX [6]. Initially, all fluid is stagnant at a pressure of 1.8 MPa and a temperature of 463 K (190 °C). The initial temperature of the cold legs, reactor pressure vessel, and core barrel is also equal to 463 K (190 °C). The ECC water injected through the safety injection nozzle has a mass flow rate of 40 kg/s and a temperature of 300 K (27 °C). A turbulence intensity of 5 % and a turbulence length scale of 1/10 of the diameter of the injection nozzle have been assumed.
At the outlet of the computational domain, a reference pressure outlet condition has been specified. In the study, the CFD simulations were performed according to the Best Practice Guidelines (BPG) [10]. A convergence criterion of 1 × 10⁻⁴ was used to guarantee negligibly small iteration errors. In the calculations shown below, the High-Resolution (HR) discretization scheme of ANSYS CFX [6] was used to discretize the convective terms in the model equations. A second-order implicit scheme was used to approximate the transient terms. The used time step size used was 0.5 s.
The buoyancy production terms in the k,ω equations for additional production and dissipation of turbulence due to the density differences between hotter and colder coolant were included. A transient of 150 s was simulated. The calculations on 8 processors took 4 days CPU time.
3.3. Results and Discussion Test I
This test was run with the ECC flow rate of 40 kg/s [5].
After the start of the ECC water injection a "cold water stream" at the point of injection, continues towards both ends of the cold leg and decays away as the resulting plume drops into the downcomer. A "hot water stream" flows counterwise to this "cold water stream" in the cold leg between injection nozzle and upper downcomer supplying the flow essential for mixing. Two dimensional contour plots of the fluid temperatures measured in the cold leg are given in Fig. 8. These figures show the time dependence of the fluid stratification in the cold leg between injection nozzle and downcomer. Two dimensional contour plots (unwrapped downcomer) of the measured fluid temperatures are shown in Fig. 9.
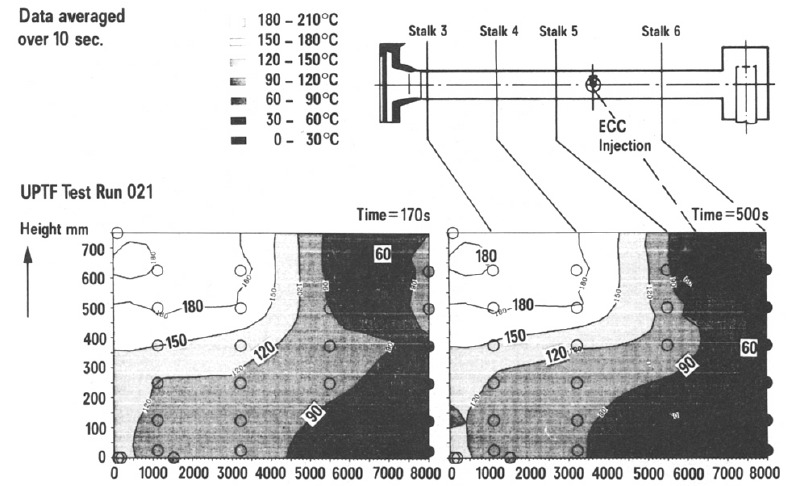
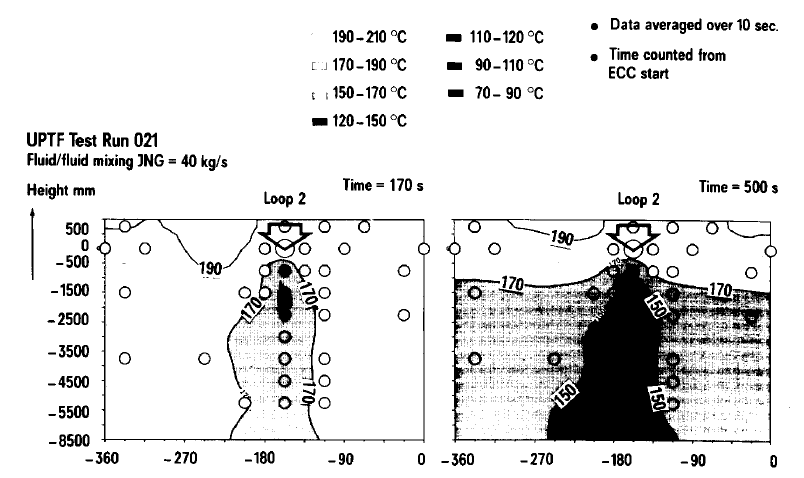
These figures show the development of the cold water plume in the downcomer. The non-symmetry of the contour relative to the cold leg centerline is due to the interpolation between a limited number of fluid temperature measurements in the downcomer and not a physical effect. The following phenomena were observed in this fluid-fluid mixing test:
- Fluid temperature stratification was measured in the cold leg between downcomer and injection nozzle demonstrating the counter-flow of a cold water stream flowing to the upper downcomer on the bottom of the cold leg and a hot water stream on top of the pipe.
- A plume of cold water was penetrating downwards the downcomer below the cold leg center line.
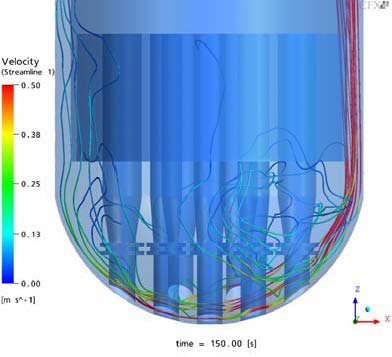
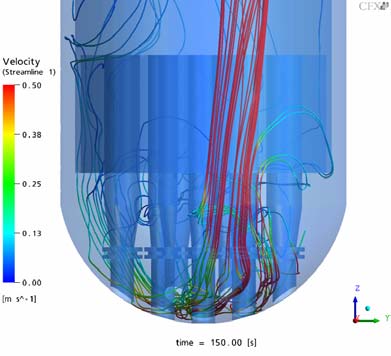
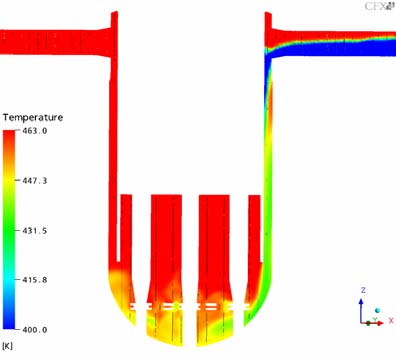
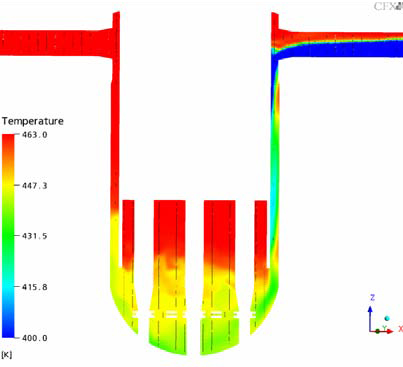
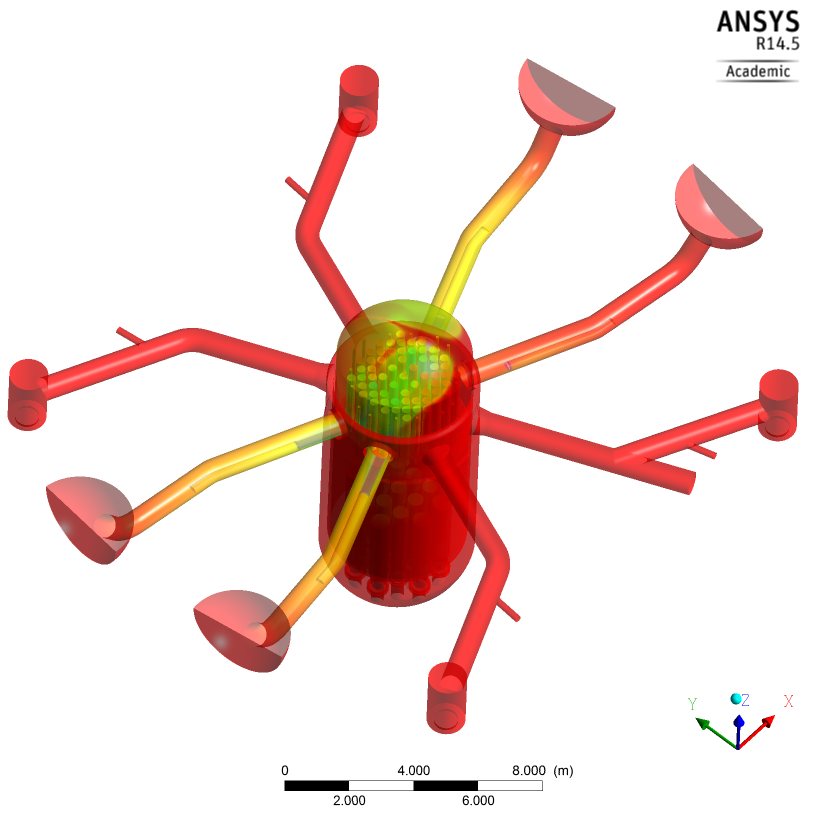
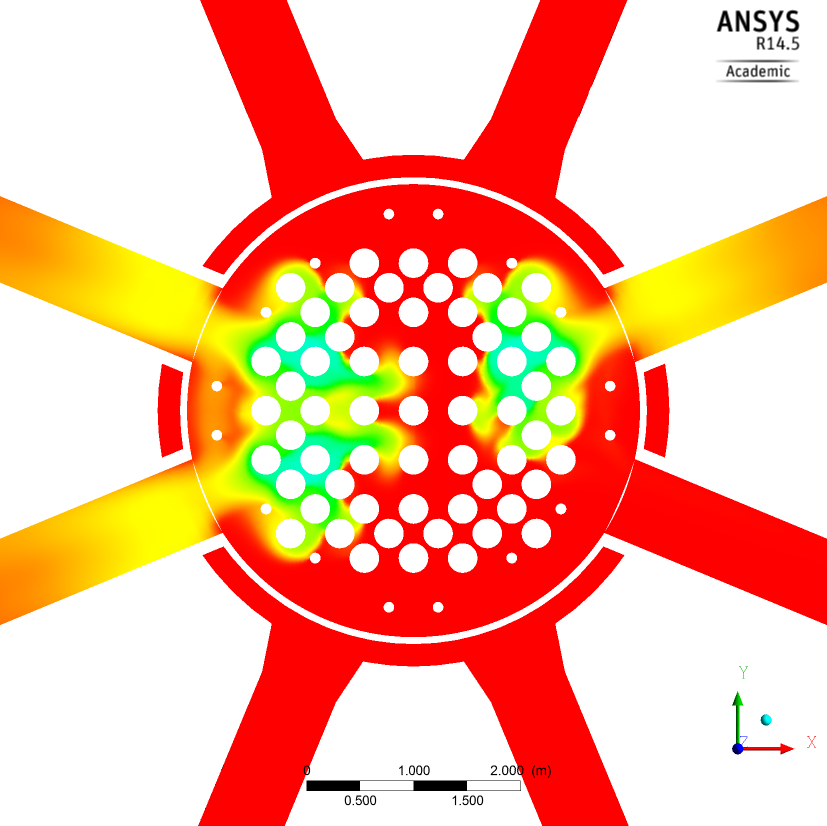
At the early state of the ECC injection, the ECC water is filling up the lower part of the corresponding cold leg. Strong mixing of the cold ECC water with the ambient hot coolant, existent in the system, is observed in the area of the ECC injection tube. Further downstream, an intense stratification is detected in the cold leg. The cold water flows towards the RPV and in the opposite direction of the pump simulator, where the cold water accumulates (Fig. 10). The stratification in the part of the cold leg leading to the RPV remains at a constant level throughout the transient. The cold water plume flows downwards past the vessel wall. Some oscillations can be observed in circumferential direction of the downcomer (Fig. 20 and 11). In the Figures 12 and 13, a detailed view of the flow in the downcomer is presented. At the connection of the RPV with the cold leg, the flow attaches to the core wall, but starts to detach and re-attach at a lower level in the downcomer with a result of mixing in radial direction.
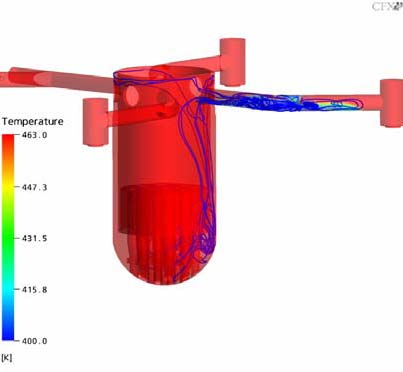
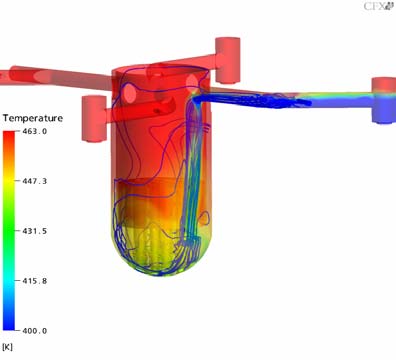
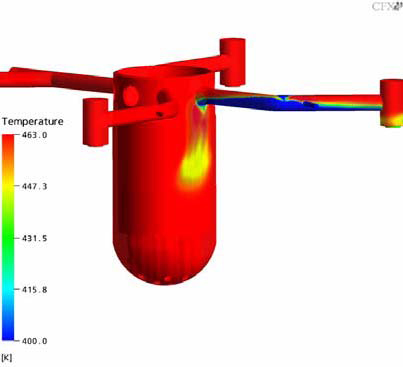
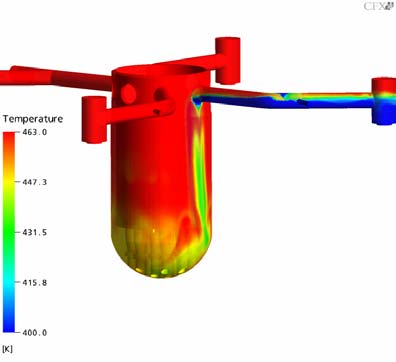
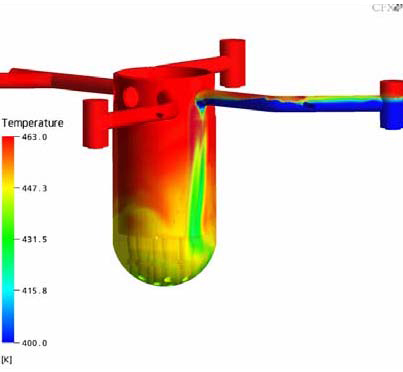
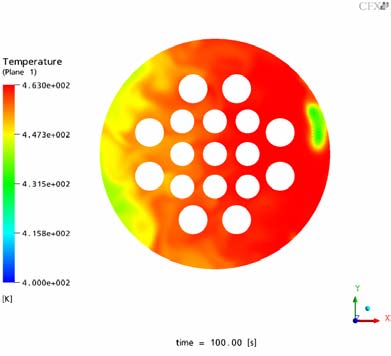
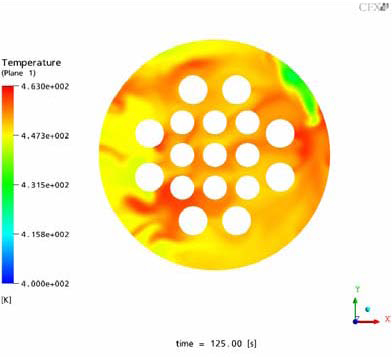
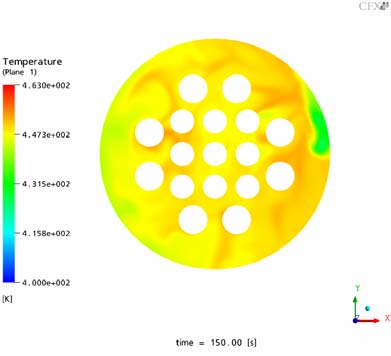
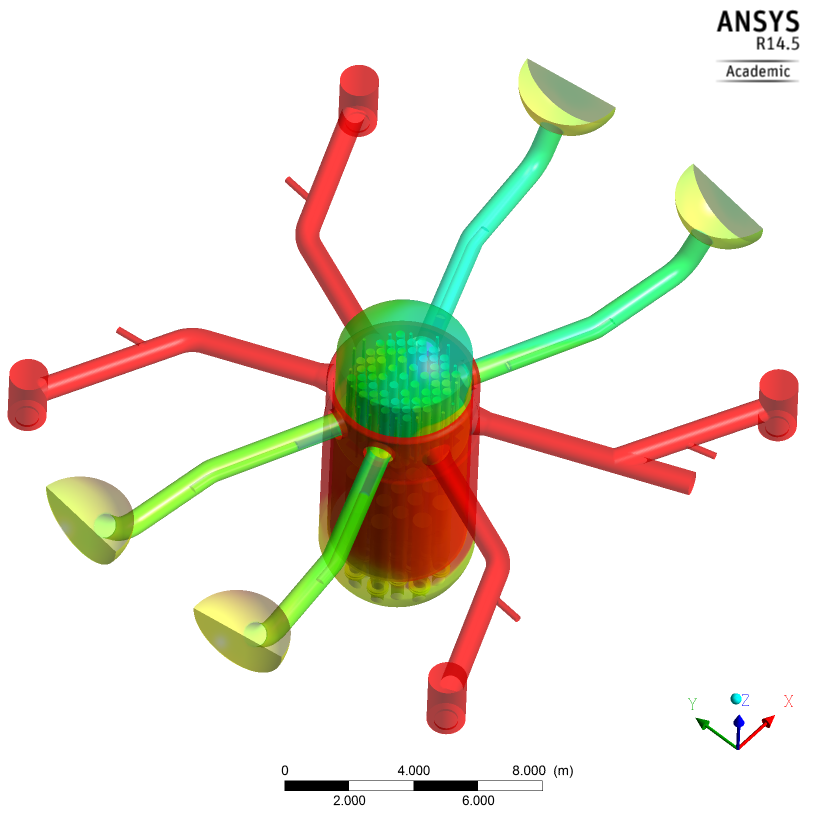
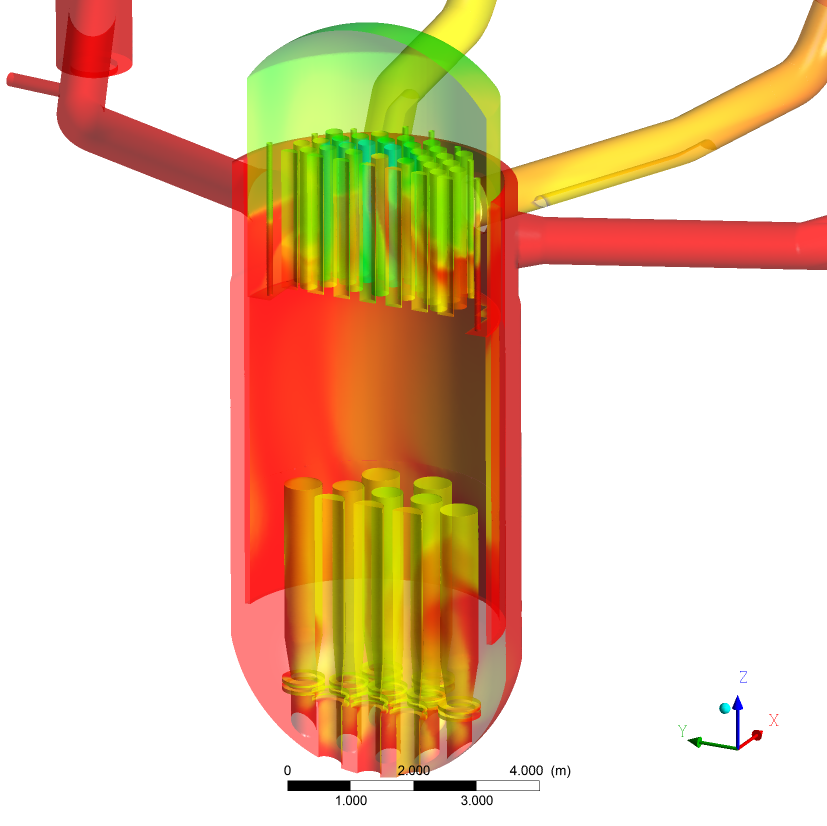
The Figures 10-21 show the transient temperature and flow behavior in the RPV during the cold water injection from different views. In Figs. 10 and 11 the flow field of the whole UPTF reactor vessel is shown. Figures 12 and 13 show the flow field after 150s (x,z plane and y,z plane at the lower plenum). The Figures 14-16 describe the temperature distribution at the RPV wall at different times of the transient, the Figures 17 and 18 the temperature distribution in a vertical cut of the RPV. The temperature distribution in lower plenum below the core inlet is shown in Figure 19 -21.
In the bottom of the reactor vessel the ambient coolant and the ECC water are well mixed by the turbulent flow between the lower plenum internals (Fig. 12, 13 and 19-21). At the core inlet region (no core was modelled at the UPTF test facility) the already well mixed ECC water reaches the opposite side of the injection loop (100s after simulation start) and distributes afterwards over the whole core inlet plane (150s after simulation start). This phenomenon exists due to the flow structure at the vessel wall of the lower plenum. The heavier ECC water falls down to the bottom of the RPV and due to the shape of the lower plenum, main components of the flow are directed to the opposite side of the injection loop (see Figs. 11 and 13). The orifices of the steam support tubes slightly influence this distribution with an additional generation of turbulence (Figs. 19-21).
Compared to the experimental findings (Figs. 8 and 9) the following conclusion can be drawn:
- The stratification in the cold leg is accurately predicted by the code (Figs. 8 and 16). The calculated lowest temperatures are in the range of the experiment.
- The heavier ECC water falls down to the bottom of the RPV in a almost vertical stream (see Fig. 9 and 15/16. The coldest temperatures occur at this stream. The flow behavior in the downcomer is well predicted apart from some spurious circumferential oscillations.
4. UPTF Test II
In the event of hypothetical accident scenarios in a PWR, emergency approaches have to be mapped out, in order to guarantee the reliable removal of decay heat from the reactor core, also in case of component breakdown. One essential passive heat removal mechanism is the reflux-condenser mode. This mode can appear for instance during a small break loss-of-coolant-accident (LOCA) in a primary circuit [7]. In this event, which caused by damage at certain positions of primary circuit, steam will be generated in the primary circuit of a PWR. The produced steam will flow upward, moving counter-currently to the flow of the cooling water. Therefore, it is essential that the injected cooling water is sufficient and able to penetrate into the core. This emergency core cooling (ECC) water is limited by the flooding phenomena. To be able to evaluate the ECC response of the reactor during this accident scenario, the counter-current flow of both phases should be fully determined. The terminology during this scenario includes the counter-current flow limitation (CCFL), zero liquid penetration, flooding/ de-flooding, and also hysteresis effect.
The behavior of this system is poorly understood despite many years of research on the topic. As a result, the design and refinement of such systems often requires exhaustive experimentation and the use of purely empirical correlation. Therefore, the CCFL cannot be predicted with a high level accuracy by a one dimensional (1D) system code. For the above reasons, Deendarlianto et al. [7] has already reviewed the capabilities of the CFD methods on the CCFL in a model of PWR hot leg including the investigation of CCFL mechanisms, heat transfer effects, flow patterns, hysteresis behavior, and the extension of the obtained flow behavior from small scale to full reactor scale. They concluded that the considerable robust three-dimensional (3D) closure relations for this application remain an unachieved goal due to lack of detailed phenomenological knowledge and consequent application of empirical one-dimensional experimental correlations to the multidimensional problem. Moreover, the available literature regarding this important topic is rare.
Various multidimensional CFD models were developed to simulate the CCFL phenomena in a PWR hot leg model i.e. Murase et al. [9], Minami et al. [10], and Kinoshita et al. [11]. In general volume of fluid (VOF) and Euler-Euler two-fluid models were used in the commercial CFD, whereas difference interfacial friction factor obtained from 1-D experimental correlations were implemented to the 3-D problems. Nevertheless, under a reflux condensation condition mode, numerical computation reveals that different flow structures appeared in the region away from flooding curve and in the region near the flooding curve.
In order to validate the algebraic interfacial area density (AIAD) model, Deendarlianto [7] performed CFD studies of the experiment 1/3rd scale model of the German Konvoi PWR hot leg with a rectangular cross section. Here 3-D CFD simulation of Euler-Euler model was implemented. As a result, the CFD model proved that liquid slug plays an important on the initiation of flooding if the AIAD model is implemented. On the other hand, the implementation of this model for a full scale PWR hot leg was not carried-out.
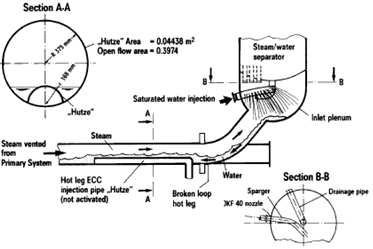
UPTF Test II was an experimental research program on the countercurrent flow of steam and saturated water in a PWR hot leg (Fig. 22). The objective of the test was to investigate the steam-water countercurrent flow phenomena in a PWR-hot leg during the reflux condensation mode of a small break LOCA. In this case steam was condensed in the steam generators and the condensate is flowing counter wise to the rising steam in the hot leg [8].
The experimental devices and procedure used in UPTF Test II were described in [8] and only the main features are presented here. In each experimental run, the saturated water was injected in a steam generator of the broken leg and flow countercurrent with the steam from primary system. The test section consisted of a test pipe having internal diameter of 750 mm as shown in Fig. 22. In the experiment, the system pressures were 3 and 15 bars. To measure the water level in the hot leg pipe, a 3-beam-gamma-densitometer was used. It is located between the bend and the Hutze of hot leg (6 m away from vessel of reactor pressure vessel (RPV) simulator). This instrument consisted of a gamma ray source and detector located on opposite sides of the fluid volume to be measured.
4.1. Geometry and Problem Statement Test IIIn the present paper the capability of the AIAD model to simulate CCFL phenomenon in a full scale PWR hot leg of UPTF TEST II in a commercial ANSYS CFX [6] code will be presented. The calculation is carried-out on the basis of their morphologies and real physics. Here, the flow was treated as transient and is a 3-D that has to be solved by applying computational fluid dynamics (CFD) methods, whereas Euler–Euler approach was used as noted by Höhne &Mehlhoop [13]. However it requires a careful treatment of several aspects of the model. Those are interfacial area density, turbulence model near free surface and interphase momentum models. For the above reasons, the momentum exchange coefficient depends on the local morphology should be involved [13]. The conceptions of the proposal are as follow:
- The interfacial area density allows the recognition of the morphological form and the corresponding exchanging for each correlation from one item pair to another. In the range of intermediate of volume fluid fraction of gas and liquid, the interfacial area density is set to the interfacial area density for the surface.
- The concept also improves the physical modeling in the asymptotic limits of bubbly and droplet flows.
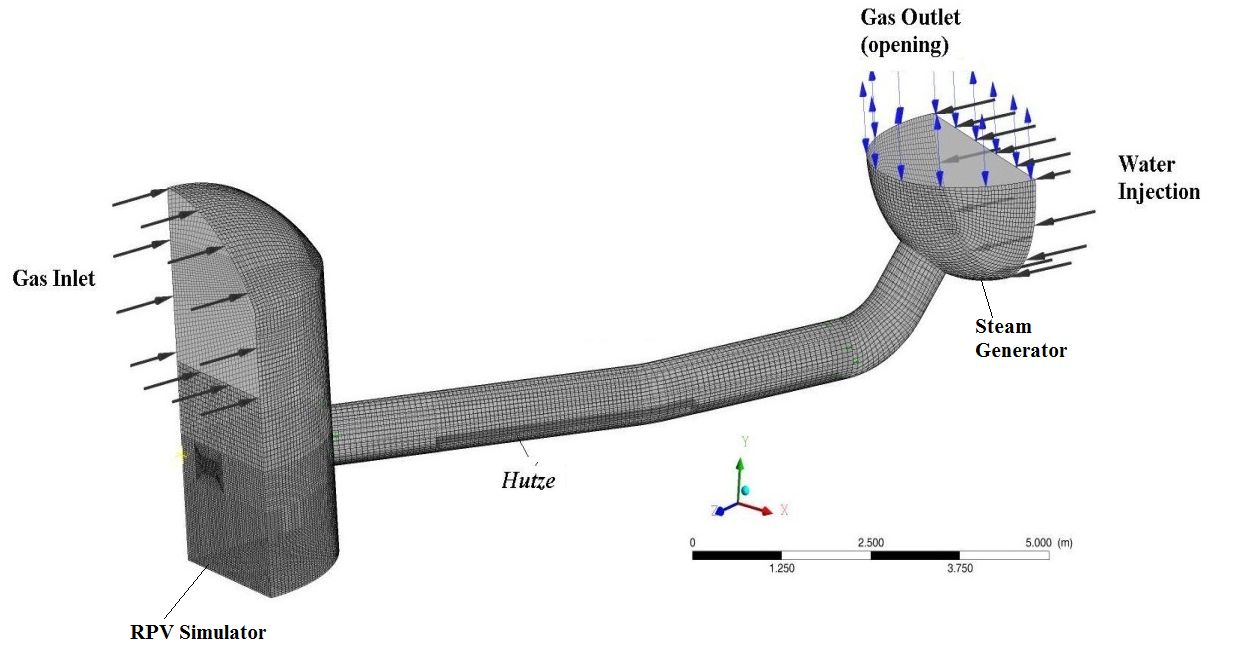
In the present CFD simulations, the following boundaries were used. The inhomogeneous multiphase model of a structured mesh was implemented. It is consisted of 29100 hexahedral elements and 30102 nodes as shown in Fig. 23. The time step was Dt = 10-4 s. The maximum of coefficient loop of each time step was 30. In order to obtain the convergence in the calculation terms, the root mean square (RMS) of the residuals were less than 10-4.
The SST buoyancy turbulence model was employed. It works by solving a turbulence/frequency-based model (k–w) at the wall and standard k–e in the bulk flow. In the calculations, both phases were treated as isothermal and incompressible. Furthermore, a drag coefficient, CD, in AIAD model was implemented into ANSYS CFX. The calculations were carried-out in parallel of 4 processors of HZDR Linux cluster. Intitial calculations were carried out to set up the state of the start of experiment (Fig. 24).
Table 1. Calculation runs of selected UPTF experimental data series.
| Run No. | Pressure (Bar) | Injected mass flow rate | Water down flow rate (kg/s) | |
| Steam (kg/s) | Water (kg/s) | |||
| 39 | 15 ± 0.18 | 24 ± 0.6 | 29.6 ± 0.6 | |
| 41 | 15 ± 0.18 | 40.2 ± 0.6 | 29.5 ± 0.6 | 0 |
| 45 | 15 ± 0.18 | 28.0 ± 0.6 | 29.5 ± 0.6 | |
Three calculations (UPTF Test II experimental run of 39 & 45) were selected from UPTF Test II series as summarized in Table 1. The calculation times of both calculations were 1169 and 1372 hours, respectively.
4.3. Results and Discussion Test II
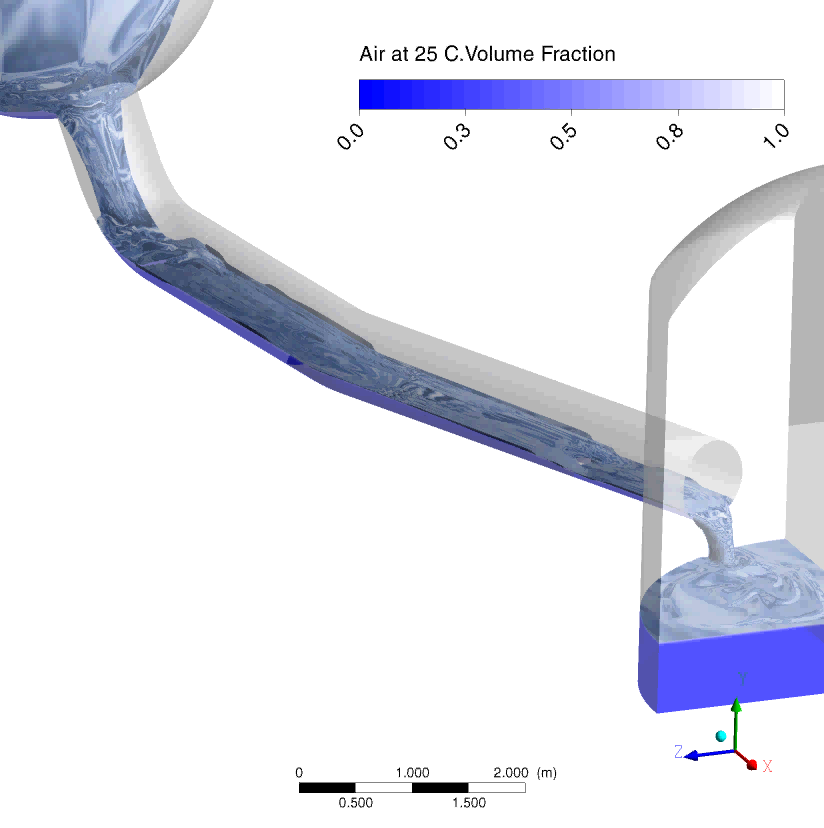
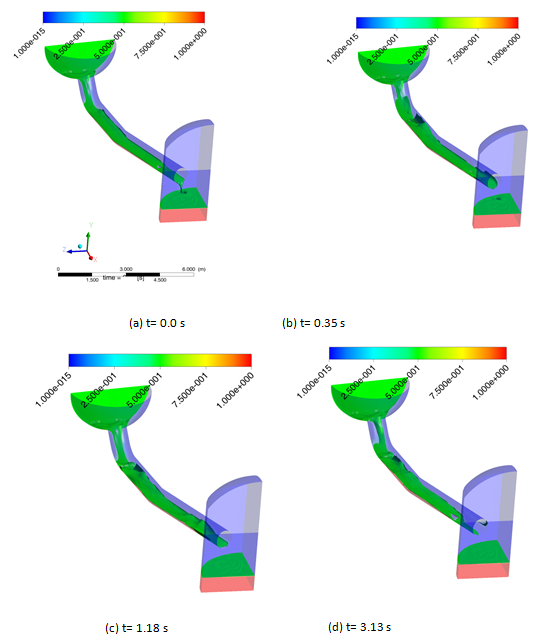
Figure 25 shows the snapshot from CFD calculation of the interfacial behavior of UPTF TEST II of run 39. In the figure, (a), (b), (c), and (d) correspond to the cases of the time progress of 0 s, 0.35 s, 1.18 s, and 3.13 s, respectively. Close observation of the figure indicates that the flow pattern on the inclined part of the hot leg channel is a supercritical stratified flow. Here a hydraulic jump as the transition condition from supercritical to subcritical flows is detected near the bended region (Figs. 26(a)-(d)). Next it is reported that 3-D effect dominated strongly in the CCFL condition. The observed results are in a good agreement with the experimental facts from Deendarlianto et al. (2008). It is noticeable that the interface of steam and water in the horizontal pipe was disturbed by the steam flow. The film thickness in the hydraulic jump area increases as the time proceeds. In addition, a backward motion of the wave is detected near the reactor pressure vessel (RPV) as shown clearly at Figs. 25(c) and (d), thus indicating the initiation of CCFL.
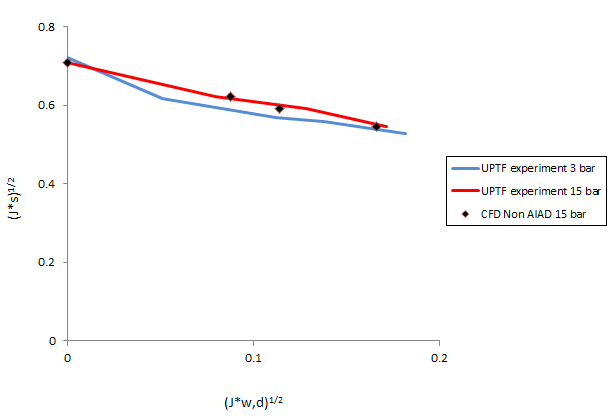
A comparison of the CCFL data between the CFD calculation and UPTF experiment is given in Fig. 26. Here, a non-dimensional superficial velocity Jk*, namely as Wallis parameter, is used, and defined as follows.
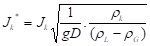
where the subscribe k indicates the injected steam or discharge water in RPV.
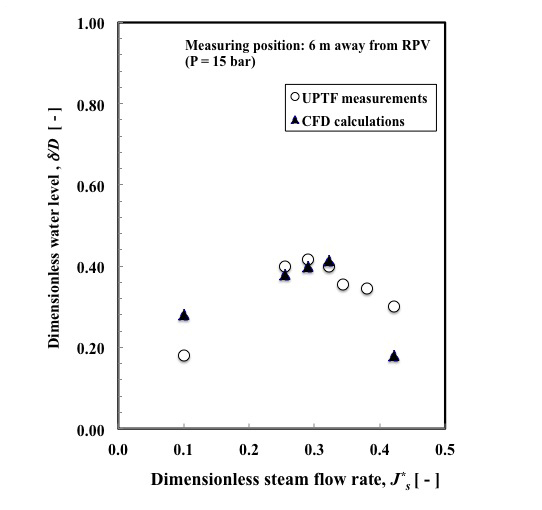
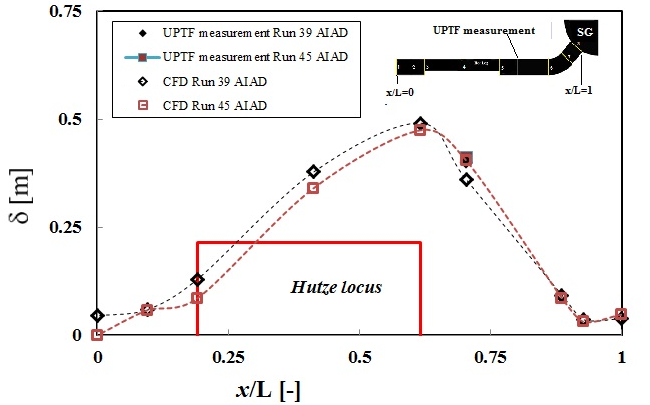
Close observation of Fig. 26 reveals the calculated CCFL conditions in a good agreement with that of the experimental data. Next, the calculated time-averaged water levels along the hot leg pipe are shown in Fig. 27. As shown in the figure, the calculated water level at inclined riser decreases from x/L=1.0 to 0.9, indicating a supercritical stratified flow. More the calculated water levels are in a good agreement with that of the UPTF experimental data. Moreover a comparison of the averaged water levels between the CFD calculation and the UPTF Test II are given in Fig. 28. In the figure δ/D and Js* are normalized water level δ/D and dimensionless steam flow rate Js*, and indicated that the CFD calculation is in agreement with the experimental data of UPTF Test II.
5. UPTF Test III
The UPTF Test III was a single effect experiment to study the interaction between the single-phase or two-phase natural circulation in the hot leg and the hot side fed emergency cooling water in small break loss of coolant accidents.
The seven test runs were set up to study the following phenomena:
- Transport of the hot leg injected emergency core cooling water in the upper plenum or toward the steam generator depending on the hot leg mass flow rates,
- Analyzing the condensation potential of the emergency core cooling water,
- Mixing analysis of saturated water and emergency cooling water,
- Influence of flow conditions in the hot leg through the hot-side safety injection,
- Influence of pressure ( 3 and 15 bar ) on the scaling and thus checking the scaling concept used
The experimental findings were the following: The UPTF- results for emergency cooling water/vapor counter flow or counter flow of emergency cooling water and a mixture of steam and water in the fuel element header prove:
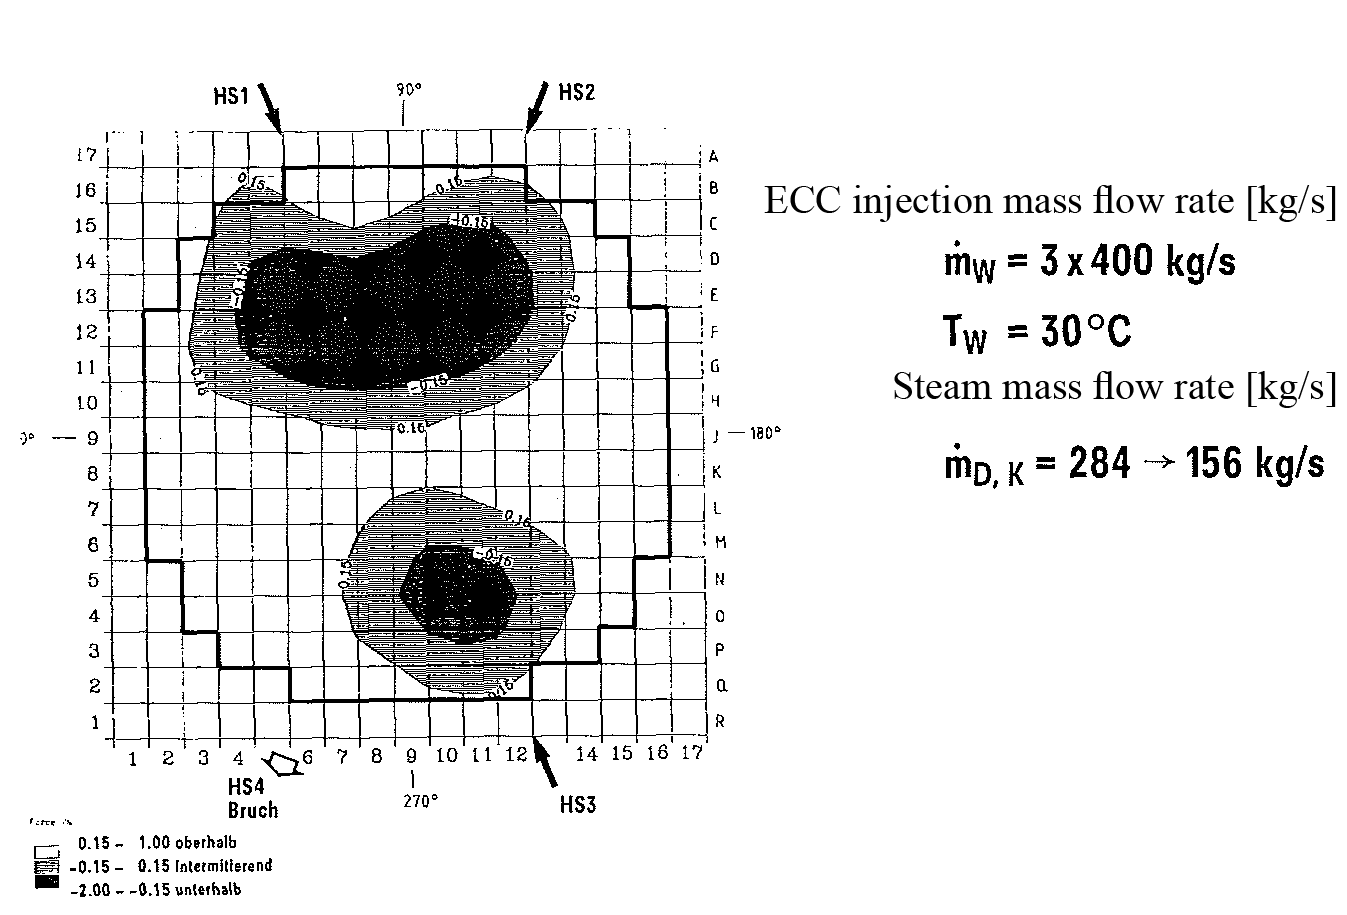
- the disjunct distribution of the flow area in the fuel element head plate in break through channels in areas with water (steam-) up-flow (Fig. 29)
- the full inflow of hot leg side emergency core cooling injection water into the core
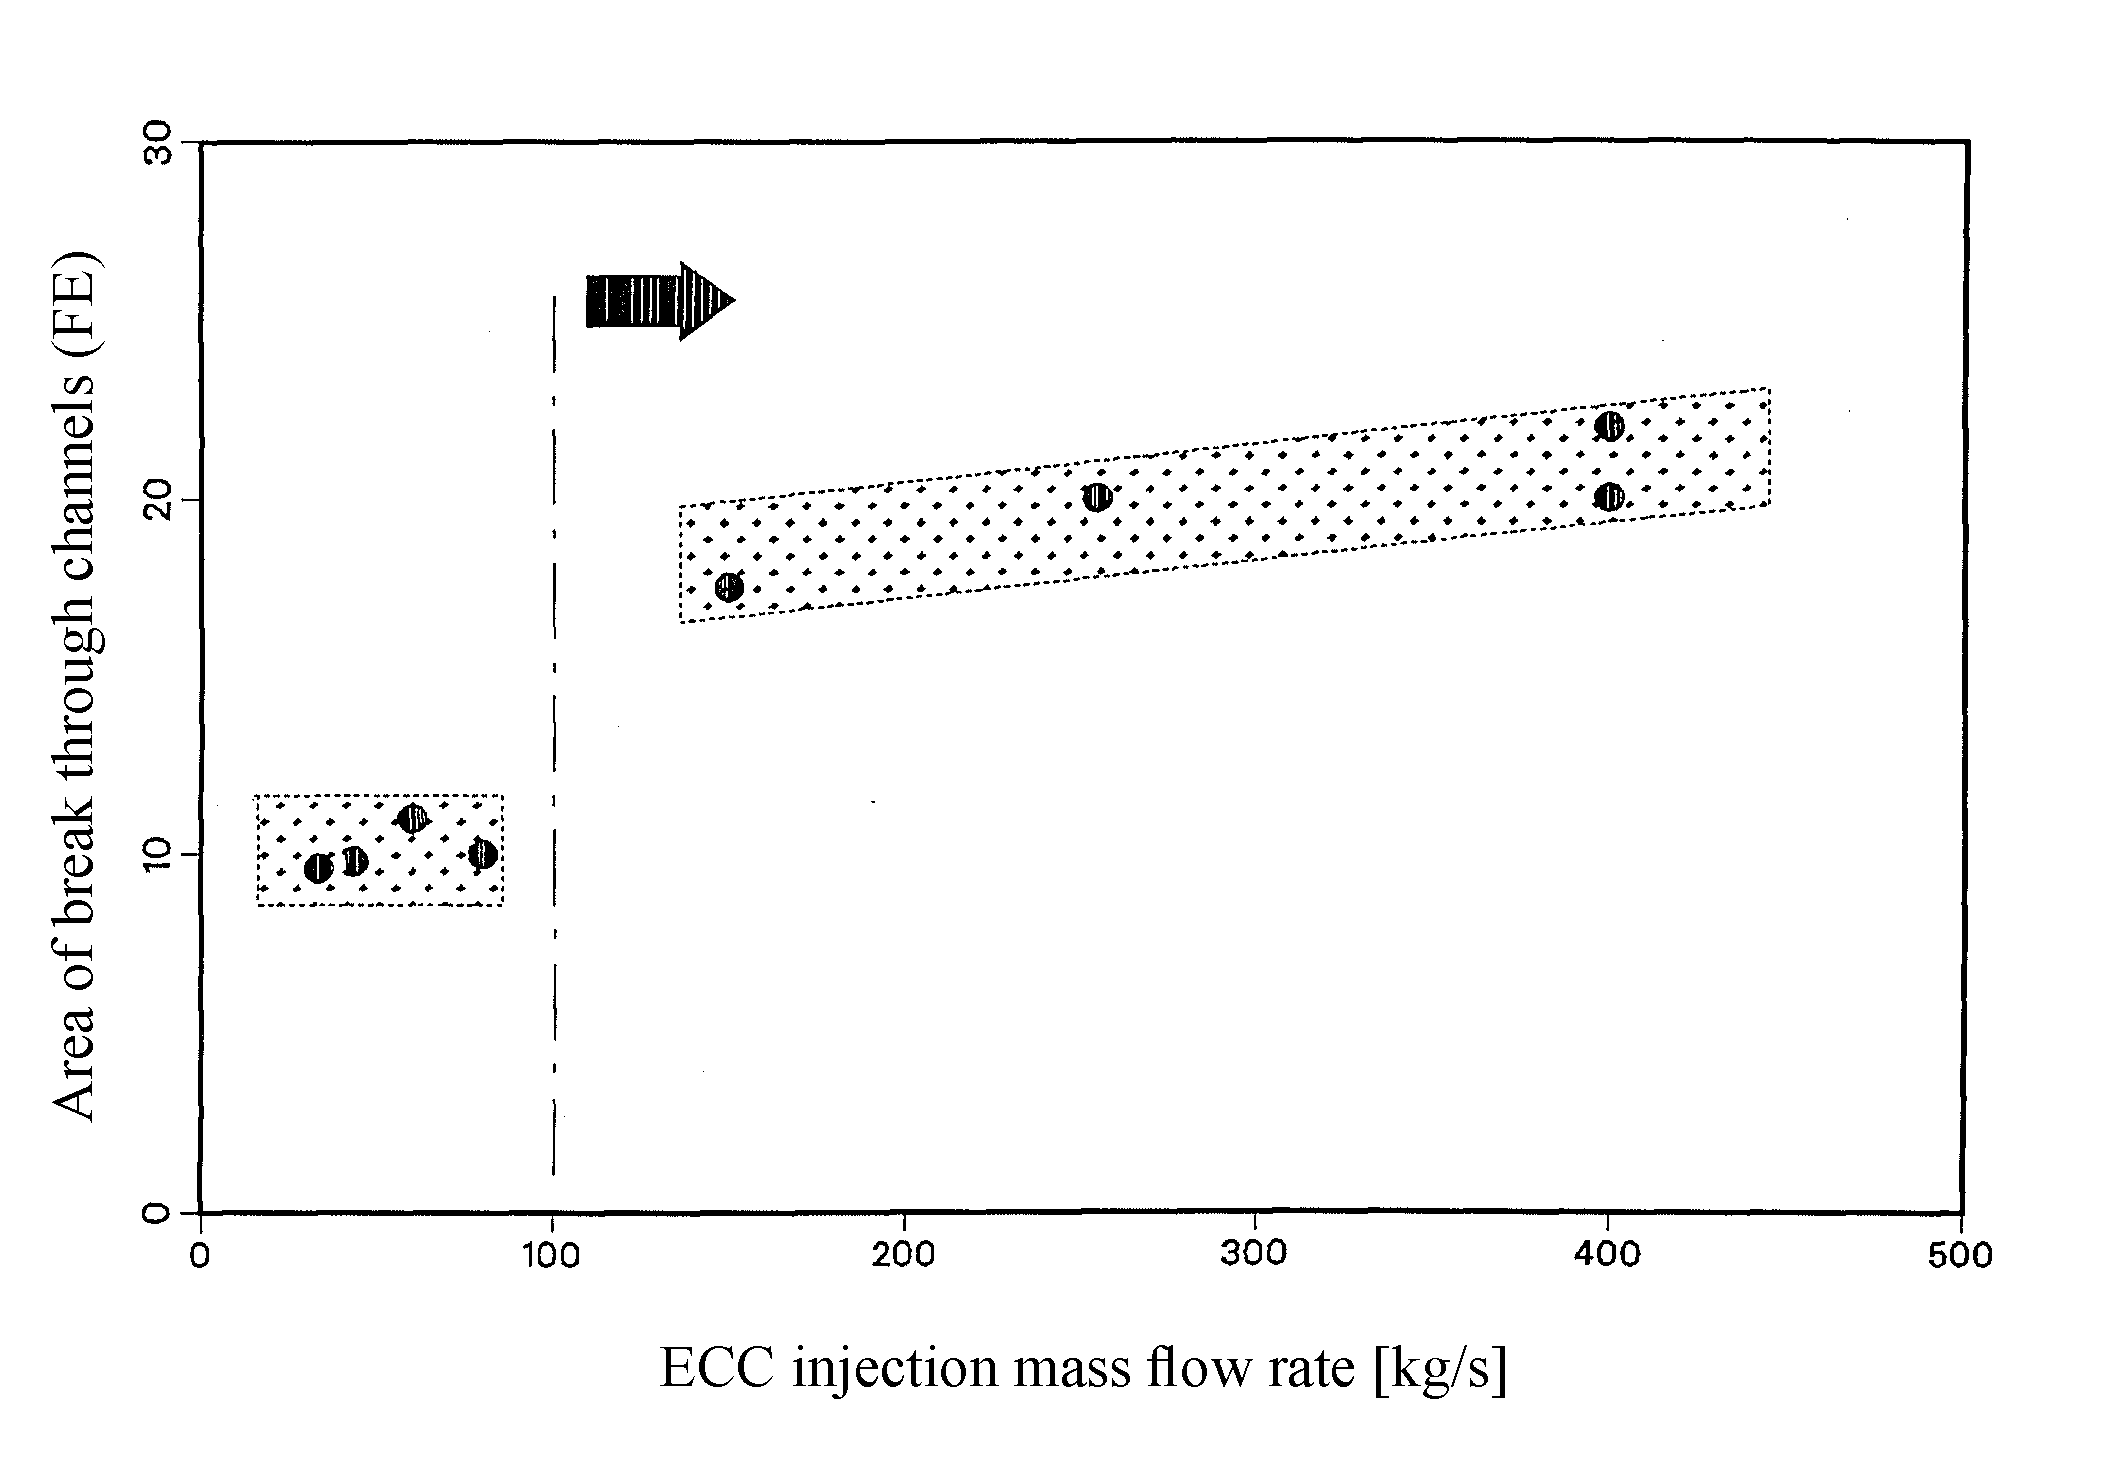
With the UPTF-temperature and mass flow measurements near the fuel element header break through channels were determined smaller than 20 fuel elements per ECC injection line (Fig. 30).
At the operating conditions with water level in the core and the upper plenum above the hot legs and a relatively low core-vapor production shows UPTF Test III:
- The outermost row of support tubes draws the emergency core cooling water down and thus prevents a deeper penetration of break through channels towards the core center. The ECC water flows before the support tubes towards the fuel element header.
The emergency core cooling water gets along the path from the ECC injection to the fuel element header significant admixing (37 ° C to 150 ° C).
5.1. Geometry and Problem Statement Test III
The CAD geometry was generated with ICEM-CFD [6]. The grid consists of 18 Million elements and 10 Million nodes. It is a hybrid mesh. It contains hexahedral and tetrahedral elements. Lower plenum structures (steam support tubes) were included in the model. Local mesh refinement at the ECC injection line and around the steam support tubes was done. All four loops including the broken leg and the four pump simulators were modelled.
The CFD code for simulating the UPTF experiments studies was ANSYS CFX (ANSYS CFX, 2017). In the current study, the CFD simulations were carried out according to the Best Practice Guidelines (Menter, 2004), with respect to model validation against experiments and grid studies. A convergence criterion of 10-4 was considered to ensure negligibly minor iteration errors. In the calculations shown below, the High-Resolution (HR) discretization scheme of ANSYS CFX was used to discretize the convective terms in the model equations. A second-order implicit scheme was used to approximate the transient terms. The time step size was 0.1 s. The Shear Stress Transport (SST) turbulence model was used to model the effects of turbulence on the mean flow. The initial conditions were modelled according to the experimental values.
5.3. Results and Discussion Test III
In this calculation three hot leg side ECC injections were assumed according to the experiment. The ECC water is distributed in channels that correspond with the falling water regions in the outer core region (Figs. 33-38), while hotter and therefore lighter coolant is rising in the centre of the core. In the lower plenum the downwards flowing coolant is redirected into the centre of the core and flowing upwards (Fig. 37).

Compared to the experimental findings, the calculation also shows the disjunct distribution of the flow area in the fuel element head plate in break through channels in areas with water up-flow (Fig. 29 vs. Fig. 37) and the full inflow of hot leg side emergency core cooling injection water into the core (Fig. 37). In the experiment (Fig. 30) break through channels were determined smaller than 20 fuel elements per ECC injection line. Also the CFD calculation shows this trend. Using the experimental conditions with water level in the core and the upper plenum above the hot legs and a relatively low core-vapor production; the calculation shows, that the core can be cooled all the time during the transient.
6. Summary and Conclusion
Three UPTF tests were selected and post-test calculation were performed. The major focus was analyzing the qualitative flow behavior. In the case of the CFD calculation of UPTF Test I the stratification in the cold leg is accurately predicted by the code. The calculated lowest temperatures are in the range of the experiment. The flow behavior in the downcomer is well predicted apart from some spurious circumferential oscillations. The two phase CFD calculation is in good agreement with the experimental data of UPTF Test II. It indicates that CFD is a promising approach for the nuclear reactor safety analysis. In addition, a full scale model with all details of the UPTF test facility was developed. The CFD calculation is in good agreement with the experimental data of UPTF TEST III. In order to analyze further UPTF experiments quantitative comparison is necessary in future.
Acknowledgement
The project was partly funded by the Nuclear Special Committee “Plant engineering” of VGB PowerTech (Germany).
References
[1] T. Höhne, S. Kliem, “IAEA CRP benchmark of ROCOM BORON DILUTION and PTS test cases for the use of CFD in reactor design,” Computational Fluid Dynamics for Nuclear Reactor Safety Applications - CFD4NRS-6, Cambrigde, USA, 2016
[2] K. Umminger, W. Kastner, J. Liebert, T. Mull, “Thermal Hydraulics of PWR’s with Respect to Boron Dilution Phenomena: Experimental Results from the Test Facilities PKL and UPTF,” Ninth Int. Topical Meeting on Nuclear Reactor Thermal Hydraulics (NURETH–9), San Francisco, California, USA, CD-ROM, 1999.
[3] U. Grundmann, U. Rohde, “Investigations on a boron dilution accident for a VVER-440 type reactor by the help of the code DYN3D,” ANS Topical Meeting on Advances in Reactor Physics, Knoxville, TN, vol. 3, pp. 464-471, 1994.
[4] T. Höhne, S. Kliem, U. Rohde, “Buoyancy driven mixing studies of natural circulation flows using ROCOM experiments and CFD,” Chemie Ingenieur Technik, vol. 83, no. 8, pp. 1282-1289, 2011. View Article
[5] P. A. Weiss, R. J. Hertlein, “UPTF Test Results: First Three Separate Effect Tests,” Nuclear Engineering and Design, vol. 108, pp. 249-263 1988. View Article
[6] ANSYS CFX, 2017. User Manual. Ansys Inc
[7] Deendarlianto, T. Höhne, D. Lucas, K. Vierow, “Gas-liquid countercurrent two-phase flow in a PWR hot leg: a comprehensive research review,” Nuclear Engineering and Design, vol. 243, pp. 214-233, 2012. View Article
[8] F. Mayinger, P. Weiss, K. Wolfert, “Two-Phase Flow Phenomena in Full-Scale Reactor Geometry,” Nuclear Engineering and Design, vol. 145, pp. 47-61 1993. View Article
[9] M. Murase, Y. Utanohara, I. Kinoshita, N. Minami, A. Tomiyama, “Numerical Calculations on Countercurrent Air-Water Flow in Small-Scale Models of a PWR Hot Leg using a VOF Model,” in Proceeding of the 17th International Conference on Nuclear Engineering (ICONE 17), Brussels, Belgium, 2009. View Article
[10] F. Menter, CFD Best Practice Guidelines for CFD Code Validation for Reactor Safety Applications. ECORA FIKS-CT-2001-00154. 2002.
[11] N. Minami, Y. Utanohara, I. Kinoshita, M. Murase, A. Tomiyama, “Numerical Calculations on Countercurrent Gas-Liquid Flow in a PWR Hot Leg (1) Air-Water Flow in a 1/15-Scale Model,” in Proceeding of the 13th International Topical Meeting on Nuclear Reactor Thermal Hydraulics (NURETH-13), Kanazawa City, Japan, 2009.
[12] Kinoshita, Y. Utanohara, M. Murase, N. Minami, A. Tomiyama, “Numerical Calculations on Countercurrent Gas-Liquid Flow in a PWR Hot Leg (2) Steam-Water Flow under PWR Plant Conditions,” in Proceeding of the 13th International Topical Meeting on Nuclear Reactor Thermal Hydraulics (NURETH-13), Kanazawa City, Japan, 2009.
[13] T. Höhne, J.-P. Mehlhoop, “Validation of closure models for interfacial drag and turbulence in numerical simulations of horizontal stratified gas-liquid flows,” International Journal of Multiphase Flow, vol. 62, pp. 1-16, 2014. View Article