Journal of Fluid Flow, Heat and Mass Transfer (JFFHMT)
ISSN: 2368-6111

Volume 3 - Year 2016 - Pages 1-7
DOI: 10.11159/jffhmt.2016.001
Finite Element Analysis of Vane Geometry for Shear Thinning Materials
Behzad Nazari1, Shahram Niazi2, Mahmoud Zohrabi3, Douglas W. Bousfield1
1University of Maine, Department of Chemical and Biological Engineering
5737 Jenness Hall Rm 117, Orono, ME, USA 04469
behzad.nazari@maine.edu; bousfld@maine.edu
2Amirkabir University of Technology, Department of Chemical
Engineering
Hafez Ave, Tehran, Iran 15874
shahram.niazi@aut.ac.ir
3Yasouj University, Department of Mechanical Engineering
Daneshgah Ave, Yasouj, Iran 75914
mahmoud.zohrabi@std.yu.ac.ir
Abstract - Various materials such as cellulose nanofibers (CNF) suspensions contain non-isotropic structures that can lead to strong shear thinning behaviour in parallel-plate geometries; a slip layer seems to form between the plate and the material in such standard geometries. The link between parallel-plate results and data from vane geometries is not clear in the literature. The power-law viscosity model was used to fit the steady-shear results from parallel-plate geometry. The torque-rotation rate results were also obtained from a vane geometry for CNF suspensions at three solids levels (2-4 wt%). A finite element method was used to solve the flow equations for calculating the torque applied on the solid surfaces in the vane geometry. The power-law model gave reasonable results for the prediction of torque. It was shown by shear rate distributions that the shearing layers of the fluid existed predominately at radial positions close to the vane radius and the viscosity value at this shear rate becomes important in determination of the torque.
Keywords: Vane rheometer, Finite element, Non-Newtonian fluids, Cellulose nanofibers
© Copyright 2016 Authors - This is an Open Access article published under the Creative Commons Attribution License terms Creative Commons Attribution License terms. Unrestricted use, distribution, and reproduction in any medium are permitted, provided the original work is properly cited.
Date Received: 2015-08-17
Date Accepted: 2016-01-18
Date Published: 2016-02-05
1. Introduction
Colloidal suspensions are a challenge to characterize in terms of rheology because of a number of issues such as wall depletion of particles, time dependent effects caused by flocculation, and structure formation generated by flow. Standard rheological tests give much insight into these phenomena but the use for this data to predict the flow behaviour in complex geometries is not always straight forward, especially for concentrated suspensions that are far from Newtonian behaviour. Cellulose nanofibers (CNF) are produced by the mechanical breakup of wood fibres, by fermentation of specific bacteria that produce nanoscale cellulose, or by acid hydrolysis of cellulosic materials. Attributable to their special physical and chemical properties as well as their inherent renewability and sustainability, these fibres have attracted enormous attention [1]-[5]. Seeking for new applications for these materials, the flow properties of CNF-water suspensions are important to understand. Probably owing to the fibres ability to form network structures and flocs, CNF suspensions show strong shear-thinning behaviour even at solids of 1 wt% [6]-[8]. The power-law flow curves is commonly used for mildly attractive colloids [9] including CNF [10]. At very low shear rates, the colloidal fibres are randomly oriented without getting influenced by the flow-induced alignment. This gives rise to the Newtonian plateau where the Brownian diffusion is effectively competing with flow. The Newtonian plateau is followed by the shear-thinning regime where hydrodynamic forces impose order, particles align along flow streamlines and viscosity decreases [11]. This behaviour is also observed in the flow of polymer melts and solutions [12], [13]. A vane rheometer consists of an impeller rotating in a baffled cylinder geometry. This geometry supposedly minimizes slip between the sample and the solid walls. For complex fluids such as high-solids suspensions or polymeric liquids, vane geometry facilitates an accurate and direct measurement of yield stress [14]-[16]. However, owing to the complex flow pattern in vane, it is a challenging to relate the measured quantities such as shaft torque and angular velocity to rheological properties; namely viscosity as well as storage and loss moduli [16]. Several researchers [17], [18], assuming zero-secondary flow at low shear rates for the vane, reported that the geometry can be used for measuring rheological properties, but it is clear that high shear rates cause secondary flow regimes within the geometry. Additionally, even though fluid flow in vane geometries has been studied by a number of researchers [16], [19], [20], the interpretation of the experimental results is not quantitative perhaps attributable to lack of an analytical model. To obtain velocity, pressure, and other flow parameters in a vane geometry, numerical methods such as finite element can solve conservation equations. The study of two-dimensional fluid flow in the vane geometry is prevalent [21], [22], however this doesn’t address the vertical-direction flow that a three-dimensional model can describe. Several researchers [23]-[25] made good use of Couette analogy to calculate shear rate and stress from angular velocity and torque measured by vane. Obtained by magnetic resonance imaging measurements, velocity profiles revealed a deviation from cylindrical symmetry hypostasised in Couette analogy [26]. This perhaps reflects the complexity of flow regime in vane geometry. Recently, a three dimensional finite element model for the flow of a Newtonian fluid in vane geometry was developed to obtain the velocity and pressure profiles throughout the geometry. In a recent study [27], velocity and pressure profiles throughout vane geometry was calculated by means of a three-dimensional finite element model for the flow of Newtonian fluids. It was reported that by surface integrations of the numerical data of total stress, the torque applied on the solid surfaces can be predicted and subsequently compared to experimental data. Because of the extreme shear-thinning nature of CNF suspensions, it is critical to use non-Newtonian viscosity equations for modelling the flow of these systems. Here, the power-law model is used to fit data obtained from steady-shear flow in parallel-plate geometry. The model is used in a three dimensional finite element framework to predict velocity, pressure and torque in a vane geometry. The accuracy of the model is tested in contrast with experimental data. Utilizing velocity and shear rate profiles, the validity of Couette analogy is also studied in the present case.
2. Theoretical background
In vector form, the steady mass and momentum balance equations are represented by the following expressions:


where ![]() is the velocity vector,
is the velocity vector, ![]() is
the fluid density,
is
the fluid density, ![]() is
pressure, and
is
pressure, and ![]() is
the extra stress.
is
the extra stress. ![]() is the body force vector. To solve Equation 1 and 2, appropriate constitutive
relations are demanded. A starting point is the expression for a viscous fluid given
as
is the body force vector. To solve Equation 1 and 2, appropriate constitutive
relations are demanded. A starting point is the expression for a viscous fluid given
as
The dynamic viscosity ![]() depends
on the velocity field. In viscous fluids equations,
depends
on the velocity field. In viscous fluids equations, ![]() is
related to shear rate
is
related to shear rate ![]() calculated by
calculated by

where, Δu is the summation of velocity gradient and velocity gradient transpose tensors resulting in II∆u showing the second invariant defined as


For the fluid in this study, the power-law viscosity equation was used as follows:

where ![]() and
and ![]() are the
power-law constant and index, respectively. Assuming
incompressible flow, we can consider density
are the
power-law constant and index, respectively. Assuming
incompressible flow, we can consider density ![]() as
a constant as well. With these two assumptions, the conservation equations
morph into
as
a constant as well. With these two assumptions, the conservation equations
morph into


Equation 8 and 9 are applicable to isothermal study of incompressible viscous fluid flow. In our previous work [27], boundary conditions and shaft torque calculation using total stress were explained.
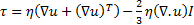
The geometry of the vane consists of blades,
shaft, cylinder, and baffles depicted in Figure 1. The impeller is 5 mm distant
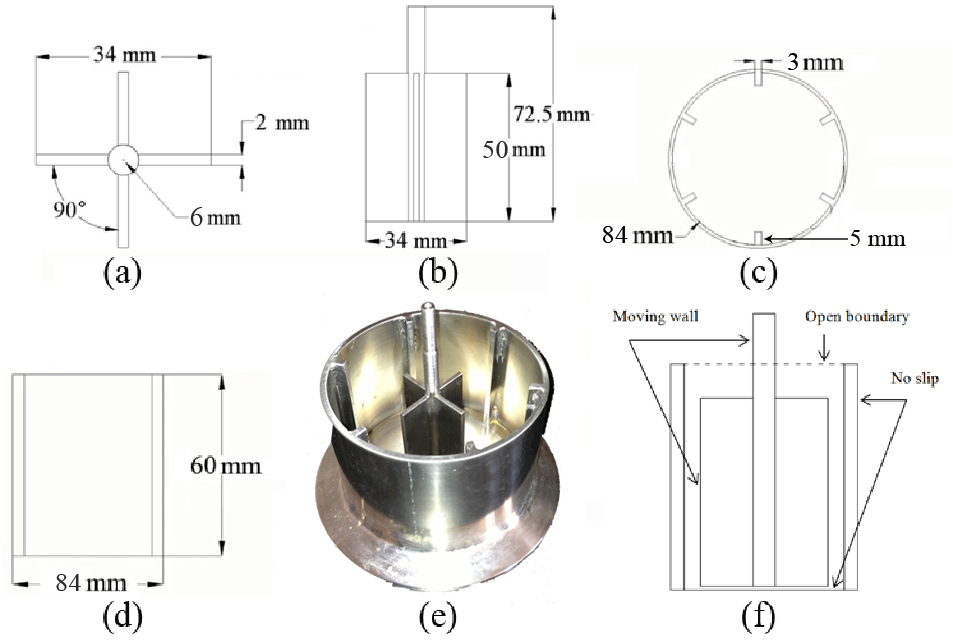
from the container bottom. In Figure 2, the mesh elements are depicted.
There are 840735 elements with a mesh average size of 0.2274 mm3 in
the model mesh. A mesh size analysis was run prior to choosing the number of
elements for the model revealing that 650000 elements would result in values
that are within 2% of results with finer meshes. A commercial finite element
package (COMSOL Multiphysics 5.0) was used to solve the conservation equations.The
solution is based on Galerkin’s method with the tolerance of the relative
errors set at ![]() . The mesh size analysis and
fairly small error tolerance assured the repeatable convergence of the model.
. The mesh size analysis and
fairly small error tolerance assured the repeatable convergence of the model.
3. Experimental
A controlled stress rheometer (Bohlin CVO) was used to obtain torque-angular velocity data with a temperature-control unit set at 25 °C. A parallel-plate geometry with a diameter of 40 mm and a gap of 2 mm was used to obtain steady-shear viscosity of the fluids at different shear rates (0.001-200 s-1). The fluids studied in this paper were CNF/water suspensions at 2, 3, and 4 wt%. CNF was produced at the University of Maine Process Development Center using a bleached softwood kraft pulp. The pulp is dispersed with a beater at 2.5% solids and sent to a refiner with specialized plates. The pulp was circulated through the refiner until the fines content is over 90% as measured with a standard fibre size analyser (Morfi, Techpap). The refined CNF is fed to a lab scale ultra-fine friction grinder (Supermasscolloider, Masuko). Ten litres of the suspension is circulated through the grinder for two hours to make ground CNF. The density approximates that of water because of the low solids content. CNF level in the suspensions was adjusted either by adding water or by filtration. The vane and the container were custom made to fit the rheometer. The gap between the shaft and baffles is 20 mm; this assures that any large flocs or fibres will not be able to mechanically bridge the gap. Detailed dimensions are given in Figure 1.
4. Results and discussion
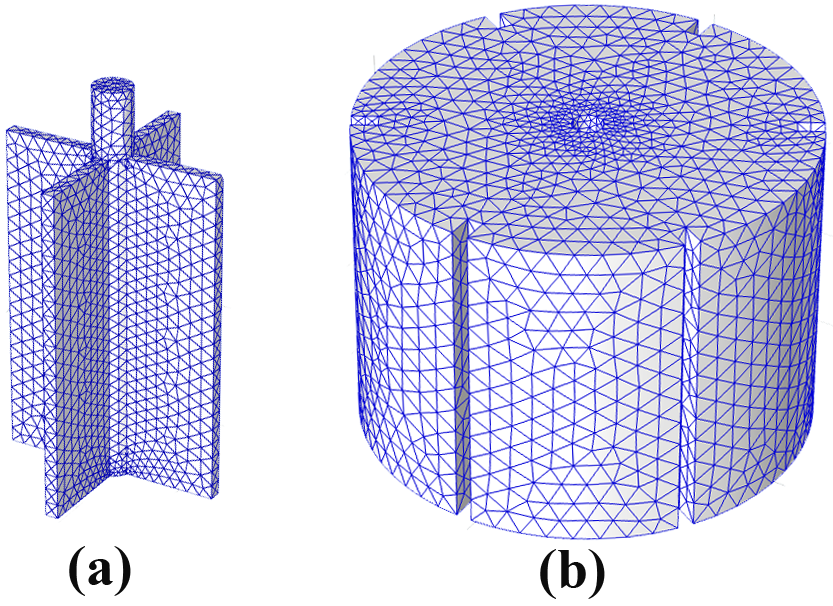
In Figure 3, the steady-shear viscosity of
the samples measured by the rheometer equipped with the parallel-plate geometry
is shown versus shear rate. The lines in Figure 3 represent power-law fits and
the parameters are revealed in Table 1. Based on the oddly low power-law
exponent values (<0.25), the CNF suspensions exhibit extreme shear-thinning
behaviour. These values are consistent with the findings by other researchers
[6], [7]. Based on the power-law index values (viscosity at shear rate 1.0 s-1),
adding more fibres to the suspension logically increased the viscosity of the
system. The model was run with different angular velocities of the impeller
between 0 and 200 rpm. Tangential velocity magnitudes (![]() ) at a surface 30 mm higher than the cylinder
bottom are presented in Figure 4a. Arising from the boundary conditions set-up,
it is clear that the higher velocities occur in the vicinity of the impeller
while in areas adjacent to cylinder walls, especially baffles, almost
stationary regions are evidenced. These results are akin to the findings for
Newtonian fluids [27]. In Figure 5, the tangential velocity at 100 rpm as a
function of radial position can be seen. Based on our previous study [27], up
to the radial position of the vane (17 mm), solid-body rotation rules the fluid
flow, but for the non-Newtonian fluids studied in this paper, it can be seen that
the flow is slightly different, and solid-body rotation occurs up to around radial
position 12 mm.
This can be related to the shear-thinning behaviour of the suspensions that
makes momentum transfer present among layers within radial positions smaller
than the vane radius.
) at a surface 30 mm higher than the cylinder
bottom are presented in Figure 4a. Arising from the boundary conditions set-up,
it is clear that the higher velocities occur in the vicinity of the impeller
while in areas adjacent to cylinder walls, especially baffles, almost
stationary regions are evidenced. These results are akin to the findings for
Newtonian fluids [27]. In Figure 5, the tangential velocity at 100 rpm as a
function of radial position can be seen. Based on our previous study [27], up
to the radial position of the vane (17 mm), solid-body rotation rules the fluid
flow, but for the non-Newtonian fluids studied in this paper, it can be seen that
the flow is slightly different, and solid-body rotation occurs up to around radial
position 12 mm.
This can be related to the shear-thinning behaviour of the suspensions that
makes momentum transfer present among layers within radial positions smaller
than the vane radius.
Shear rate profile at a surface 30 mm higher than the container base at 100 rpm is presented in Figure 5. At the circular path of the blades edge (radial position ~17 mm), the maximum shear rate occurs and at regions between blades, shear rate reasonably approaches zero (solid-body rotation). Similar results were observed by other researchers [26]. Based on Figure 5, the shear rate is almost zero throughout the geometry except for at radial position equal to the vane radius, then it can be said that the maximum shear rate is the prominent shear rate at each shaft speed. Previously shown [27], the linear relationship between average shear rate and angular velocity was examined and the result was consistent with experimental work [28] for Newtonian fluids in vane rheometer. Also in this study, we calculated the maximum shear rates for the CNF suspensions with different angular velocities shown in Figure 6. As revealed, a linear relationship was established between the shaft speed and the prominent shear rate. Based on Figure 6, as CNF content increases, the slope of the line representing the dependence of shear rate on shaft speed increases as well. This perhaps can be attributed to the lower power-law exponent of the suspensions with greater CNF contents which makes the resistance against flow more sensitive to the speed of moving walls. This finding was different than the results for Newtonian fluid flow in the vane geometry [27].
Table 1. The power-law parameters fitted to the experimental steady-shear viscosity data.
| CNF content (wt%) | k(Pa.sn) | n |
| 2 | 23.1 | 0.21 |
| 3 | 119.5 | 0.13 |
| 4 | 924.1 | 0.09 |

In Figure 4b, pressure profile for the 3 wt% CNF at a surface 30 mm higher than the container base at shaft rotation rate 100 rpm is depicted. It is evident that pressure in regions adjacent to the surfaces that are normally forced by the flow streams is higher. Looking at red and blue areas (high and low pressure regions, respectively), in Figure 4b, reveals that the impeller is rotating counter clock wise. Using numerical values of velocity and pressure profiles, stress can be calculated to obtain torque applied on the shaft [27].
The predicted shaft torque values are compared to the experimental data for samples with different CNF contents (2-4 wt%) in Figure 7. The predicted values followed the experimental trends. The shaft-torque vs. shaft-speed curves level off at higher shaft-speeds which can be related to the shear-thinning nature of the CNF suspensions. Based on the findings about Newtonian fluid flow in vane geometry [27], within the shaft-speed range tested here, turbulence is not likely to happen.
These suspensions are viscoelastic with the storage modulus larger than the loss modulus. Therefore, viscoelastic constitutive equations may be required to fully predict the system. The presence of the small scale fibres can act as a drag reducer [29]. The predicted vortex and eddy flow may be suppressed by the fibres. Therefore, as the rotation rate increases, the eddy flow is predicted to increase, when inertial terms are included, that leads to an increase in dissipation of energy and torque. In the experimental system, the fine scale fibres suppress this mechanism and gives more of a viscous response. In our previous work [27], using Steffe suggestions [28] about vortices formation, we showed that it is not likely at all for vortices to occur in the studied range of angular velocities. As mentioned earlier, the presence of the fibres or fibre flocs are likely to suppress these vortices and this mechanism for energy dissipation.
At low rotation rates, the under-prediction of the results is likely linked to the lack of characterization of the suspensions at even lower shear rates. The experimental results show a yield stress, while the rheology data from the parallel-plate geometry does not indicate a yield stress. An equation that includes a yield stress, for instance Bingham model, may give better predictions at low shear rates.
5. Conclusions
A three dimensional analysis of a vane rheometer was completed by a finite element method for CNF/water suspensions using rheological parameters obtained from parallel-plate geometry. The predicted values followed the experimental trends. The power-law model resulted in reasonable prediction of shaft-torque compared with experimental data. The model under-predicted the torque at low shear rates because the constitutive equation used did not have a yield stress included. The shear rate profiles revealed that shearing layers of fluid were predominantly located in the vicinity of the vane radial position. This finding was consistent with Couette analogy.
References
[1] R. J. Moon, A. Martini, J. Nairn, J. Simonsen and J. Youngblood, Cellulose nanomaterials review: structure, properties and nanocomposites,” Chem. Soc. Rev., vol. 40, no. 7, pp. 3941-3994, 2011. View Article
[2] N. Lavoine, I. Desloges, A. Dufresne and J. Bras, Microfibrillated cellulose – Its barrier properties and applications in cellulosic materials: A review, Carbohydrate Polymers, vol. 90, no. 2, pp. 735-764, 2012. View Article
[3] A. Kiziltas, B. Nazari, D.J. Gardner and D.W. Bousfield, Polyamide 6–Cellulose Composites: Effect of Cellulose Composition on Melt Rheology and Crystallization Behavior, Polymer Engineering & Science, vol. 54, no. 4, p. 739–746, 2014. View Article
[4] I. Siró and D. Plackett, Microfibrillated cellulose and new nanocomposite materials: a review, Cellulose, vol. 17, no. 3, pp. 459-494, 2010. View Article
[5] D. Liu, X. Chen, Y. Yue, M. Chen and Q. Wu, Structure and rheology of nanocrystalline cellulose, Carbohydrate Polymers, vol. 84, no. 1, pp. 316-322, 2011. View Article
[6] A. Karppinen, T. Saarinen, J. Salmela, A. Laukkanen, M. Nuopponen and J. Seppälä, Flocculation of microfibrillated cellulose in shear flow, Cellulose, vol. 19, no. 6, pp. 1807-1819, 2012. View Article
[7] S. Shafiei-Sabet, W. Hamad and S. Hatzikiriakos, Rheology of nanocrystalline cellulose aqueous suspension, Langmuir, vol. 28, no. 49, p. 17124–17133, 2012. View Article
[8] T. Saarinen, S. Haavisto, A. Sorvari, J. Salmela and J. Seppälä, The effect of wall depletion on the rheology of microfibrillated cellulose water suspensions by optical coherence tomography, Cellulose, vol. 21, no. 3, pp. 1261-1275, 2014. View Article
[9] P. C. F. Møller, . J. Mewis and . D. Bonn, Yield stress and thixotropy: on the difficulty of measuring yield stresses in practice, Soft Matter, vol. 2, no. 1, pp. 274-283, 2006. View Article
[10] S. Ahola, P. Myllytie, M. Österberg, T. Teerinen and J. Laine, Effect of polymer adsorption on cellulose nanofibril water binding capacity and aggregation, BioResources, vol. 3, no. 4, pp. 1315-1328, 2008. View Article
[11] V. S. Rudraraju and C. M. Wyandt, Rheological characterization of Microcrystalline Cellulose/Sodiumcarboxymethyl cellulose hydrogels using a controlled stress rheometer: part I, International Journal of Pharmaceutics, vol. 292, no. 1-2, p. 53–61, 2005. View Article
[12] B. Nazari, H. Nazockdast and A. A. Katbab, Rheology and crystallization of polyethylene/organoclay nanocomposite films, Society of Plastics Engineers (SPE): Plastics Research Online, Bethel, 2013. View Article
[13] B. Nazari, H. Nazockdast and A. A. Katbab, The role of flow induced microstructure in rheological behavior and nonisothermal crystallization kinetics of polyethylene/organoclay nanocomposites, Polymer Engineering & Science, vol. 54, no. 8, p. 1839–1847, 2014. View Article
[14] T. Lecompte, . A. Perrot, V. Picandet, . H. Bellegou and S. Amziane, Cement-based mixes: Shearing properties and pore pressure, Cement and Concrete Research, vol. 42, no. 1, p. 139–147, 2012. View Article
[15] M. Dong, X. Mao, Z. Zhang and Q. Liu, Gelcasting of SiC using epoxy resin as gel former, Ceramics International, vol. 35, no. 4, pp. 1363-1366, 2009. View Article
[16] H. A. Barnes and Q. D. Nguyen, Rotating vane rheometry — a review, Journal of Non-Newtonian Fluid Mechanics, vol. 98, no. 1, p. 1–14, 2001. View Article
[17] J. Yan and A. E. James, The yield surface of viscoelastic and plastic fluids in a vane viscometer, Journal of Non-Newtonian Fluid Mechanics, vol. 70, no. 3, p. 237–253, 1997. View Article
[18] M. Keshtkar, M. C. Heuzey and P. J. Carreau, Rheological behavior of fiber-filled model suspensions: Effect of fiber flexibility, Journal of Rheology, vol. 53, no. 3, pp. 631-650, 2009. View Article
[19] L. P. Martínez-Padilla and D. Quemada, Baffled cup and end-effects of a vane-in-a-large cup rheometer for Newtonian fluids, Journal of Food Engineering, vol. 80, no. 1, p. 24–32, 2007. View Article
[20] L. P. Martínez-Padilla and C. Rivera-Vargas, Flow behavior of Mexican sauces using a vane-in-a-large cup rheometer, Journal of Food Engineering, vol. 72, no. 2, p. 189–196, 2006. View Article
[21] H. Zhu, N. S. Martys, C. Ferraris and D. D. Kee, A numerical study of the flow of Bingham-like fluids in two-dimensional vane and cylinder rheometers using a smoothed particle hydrodynamics (SPH) based method, Journal of Non-Newtonian Fluid Mechanics, vol. 165, no. 7-8, p. 362–375, 2010. View Article
[22] J. D. Sherwood, Transient flow of viscoelastic, thixotropic fluid in a vane rheometer or infinite slot, Journal of Non-Newtonian Fluid Mechanics, vol. 154, no. 2-3, p. 109–119, 2008. View Article
[23] C. Baravian, A. Lalante and A. Parker , Vane rheometry with a large, finite gap, Applied Rheology, vol. 12, no. 2, pp. 81-87, 2002. View Article
[24] P. Estellé and C. Lanos, Shear flow curve in mixing systems—A simplified approach, Chemical Engineering Science, vol. 63, no. 24, p. 5887–5890, 2008. View Article
[25] P. Estellé, C. Lanos, A. Perrot and S. Amziane, Processing the vane shear flow data from Couette, Applied Rheology, vol. 18, no. 3, pp. 34037-34042, 2008. View Article
[26] G. Ovarlez , F. Mahaut, F. Bertrand and X. Chateau, Flows and heterogeneities with a vane tool: Magnetic resonance imaging measurements, Journal of Rheology, vol. 55, no. 2, pp. 197-223, 2011. View Article
[27] B. Nazari, R. H. Moghaddam and D. Bousfield, A three dimensional model of a vane rheometer, International Journal of Heat and Fluid Flow, vol. 42, p. 289–295, 2013. View Article
[28] J. F. Steffe, Rheological Methods in Food Process Engineering (2nd ed.), East Lansing: Freeman Press, 1996. View Book
[29] M. D. Graham, Drag reduction in turbulent flow of polymer solutions, Rheology Reviews, Madison, 2004. View Article